Introduction
Snowpack metamorphism leads to changes in the form and size of crystals, with internal deformations and mutual displacement of crystals or their parts and infringement of communication between them. During the process of formation of a snow cover and its stratification in snowpack, the conditions influencing the speed of change of structure and the size of an ice crystal are created. The important factor influencing the processes of metamorphism of a snow cover is the temperature mode which defines the direction and intensity of the sublimation of water vapor (Vojtkovskij and others, 1988), which in turn is a controlling factor in the metamorphism of the snow sublimation column.
However, the rate of sublimation in snowpack metamorphism is determined not only by the direction and intensity of the sublimation of water vapor, but by the amount of water vapor contained in the pore space and the underlying surface, as well as the proximity of water saturation sources.
In addition to internal conditions created in the snow cover, environmental factors strongly influence the processes of sublimation of metamorphism. The collection of environmental factors can distinguish stratigraphic complexes of snow cover (Reference Mikhalev and LobkinaTroshkina, 1980; Reference Kazakov, Gensiorovskiy and ZhiruevKazakov and others, 2011), in which in certain landscapes the same type of spectra of the stratigraphic column are formed under similar conditions. Analysis of the rate of metamorphism in the the stratigraphic complexes of the south of Sakhalin island, Sea of Okhotsk, allows us to reveal the relation of change of speed with other things being equal. The velocity gradient sublimation metamorphism predicts the time of formation of thicker snow avalanche layers.
Sublimation recrystallization in the conditions of Sakhalin island is the basic genetic mechanism of the formation of avalanches with a volume of >5000m3. Avalanches of recrystallization of snowpack in south Sakhalin, according to observations, comprise ∼31% of the total number of avalanches. Thus, the use of stratigraphic data on the humidifying of the complex can significantly affect the efficiency of avalanche prediction.
Methods
During four winter seasons (2005/06, 2006/07, 2007/08 and 2010/11), field observations were made of the sublimation rate of snow cover on the metamorphism of two test sites located within the same stratigraphic complex. The sites have similar geomorphological characteristics, but differ in the degree of humidifying landscape. The degree of wetting of the landscape was determined on the basis of soil–plant display (Lilenko, 1994). The selected sites were in a foothill loop of Susunajsky ridge, near the city of Yuzhno-Sakhalinsk.
The chosen stratigraphic complex of snow cover in Susunajsky ridge is characterized by moderately recrystallized snowpack.
Site 1 is characterized by moderate hydromorphic-type facies, and is exposed to excessive moisture in the spring during snowmelt and during heavy rainfall from late August to early October. All soil horizons include gley, with the degree of gley increasing with depth. The dominant tree species are birch and alder. Shrubs, tall grasses and sedges are common in the undergrowth.
Site 2 is characterized by a strongly hydromorphic-type facies that is almost constantly wet. Humus–gley soil is prevalent. The site is located in a swampy small creek with tall grasses and bushes. The tree species are willow and alder.
The study sites were observed once a week from January till March, allowing the basic structural changes in snowpack to be tracked.
The sites quantifying the rate of sublimation of the metamorphism of snowpack were calculated: the coefficient of recrystallization, K R, and the coefficient of the secondary stratification snow cover, K SB, are
where H is the total thickness of snow cover, H 1 is the total thickness of layers of secondary-idiomorphic snow and H 2 is the total thickness of layers of skeletal crystals.
We determined the rate of growth of the diameter of crystals in the snow layer, which enables us to judge the speed of a single layer of metamorphism.
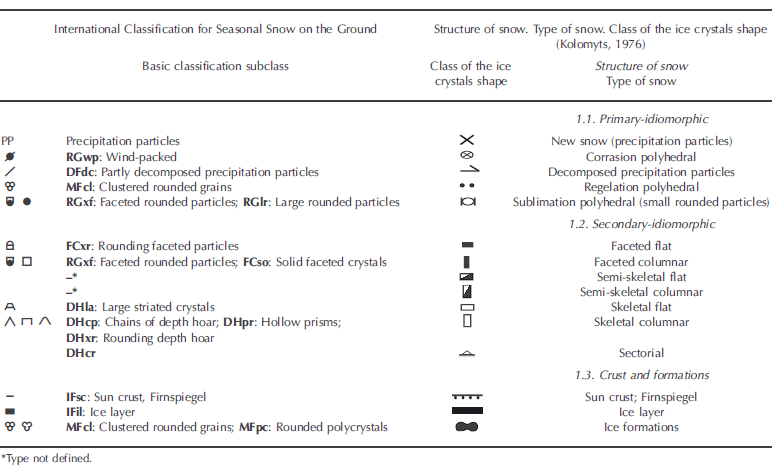
The snowpack structure was studied using E.G. Kolomyts’s technique (Reference KolomytsKolomyts, 1976) and the calculations of the Sakhalin Department of the Far East Geological Institute of the Far East Branch of the Russian Academy of Sciences. The snow section is divided into different genesis and morphology of the layers in which the shape of the crystal was determined by Kolomyts’s crystal morphology classifications of the postponed snow (Reference KolomytsKolomyts, 1976; Table 1), where the sublimation phase of metamorphism snow cover is described, depending on the structure of the snow.
Table 1. The relationships of symbols used in this study with the international classification of snow (Reference FierzFierz and others, 2009)
*Type not defined.
The density of each layer was measured, along with the temperature at the snow layer contacts, to determine the average height of snow cover.
The basis of the snow-cover structure is secondary-idiomorphic crystals. The morphometric characteristics of these crystals allowed us to follow the dynamics of change in constructive stages of metamorphism of snow depth in general and at the time of a specific event (snowfall, temperature change, etc.).
Results
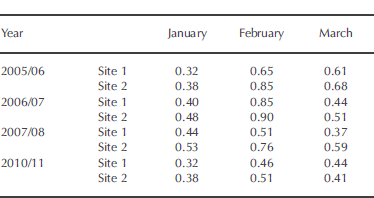
The maximum value of the secondary stratification snow cover in winter is obtained in February and the minimum in January (Table 2). The reduction in the rate of secondary stratification in March is due to both the development of destructive metamorphism, and a large amount of precipitation. The coefficient of secondary stratification is higher at site 2 than at site 1, due to site 2 being more humid and having a correspondingly large amount of water vapor in snow cover.
Table 2. The coefficient of secondary stratification at both sites for the four winter seasons
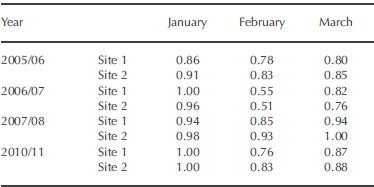
The coefficient of recrystallization is about the same at both sites (Table 3). The minimum values are obtained in February each year, which can be attributed to snowstorms at the start of the season. January and March values range from 0.8 to 1.
Table 3. The coefficient of recrystallization at both sites for the four winter seasons
One of the characteristics of snow cover, affecting the growth rate of ice crystals, is the density of the snow layer (Zhidkov, 1992). Layers of high density (>30% relative to adjacent layers) were recorded at the selected sites. The dynamics of the growth of ice crystals in these and the underlying layers follow from this (Figs 1 and 2).
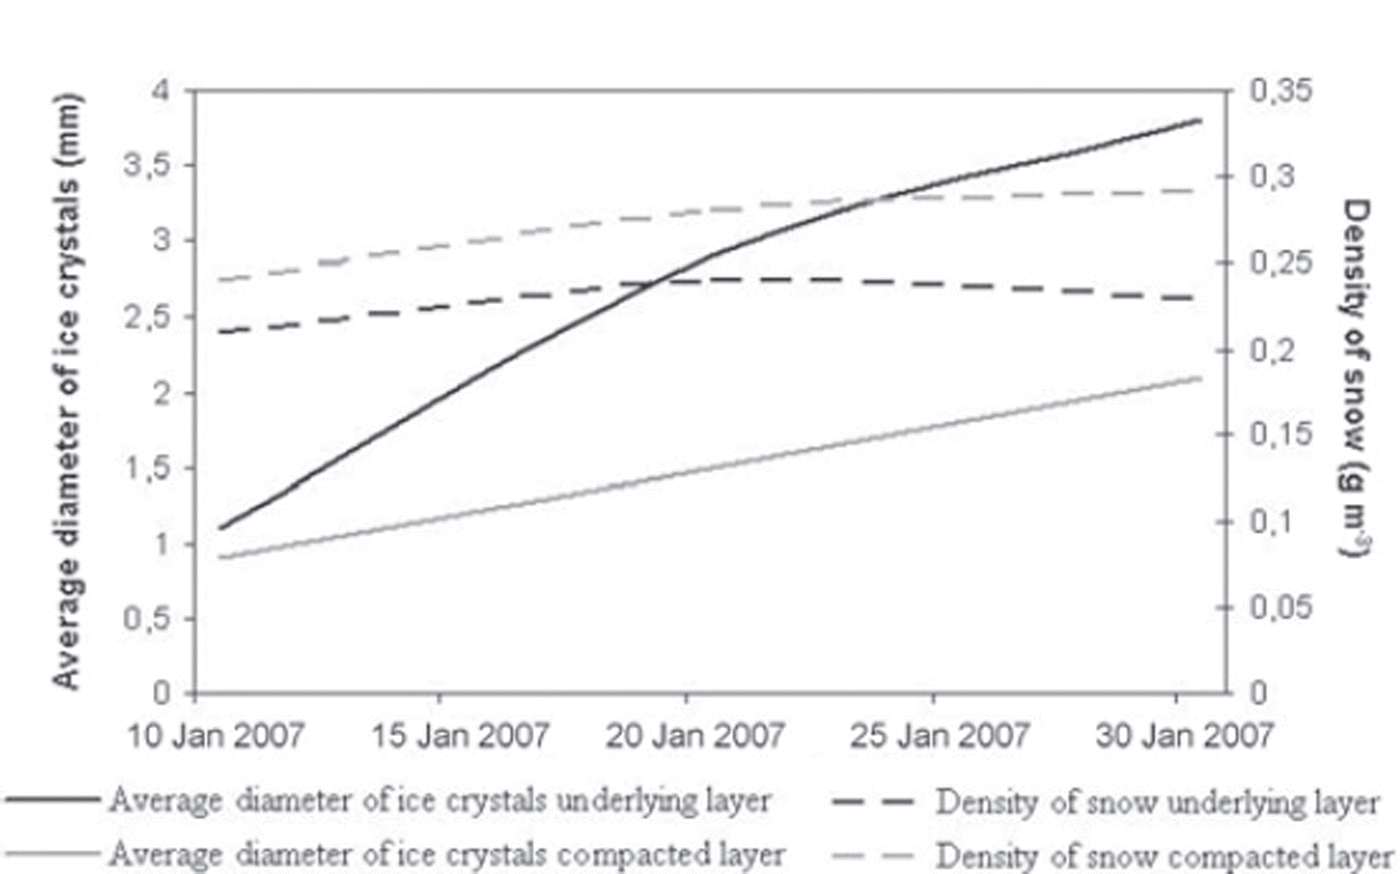
Fig. 1. The dynamic of growing ice crystals and changing density of snow cover at site 1 (January 2007).
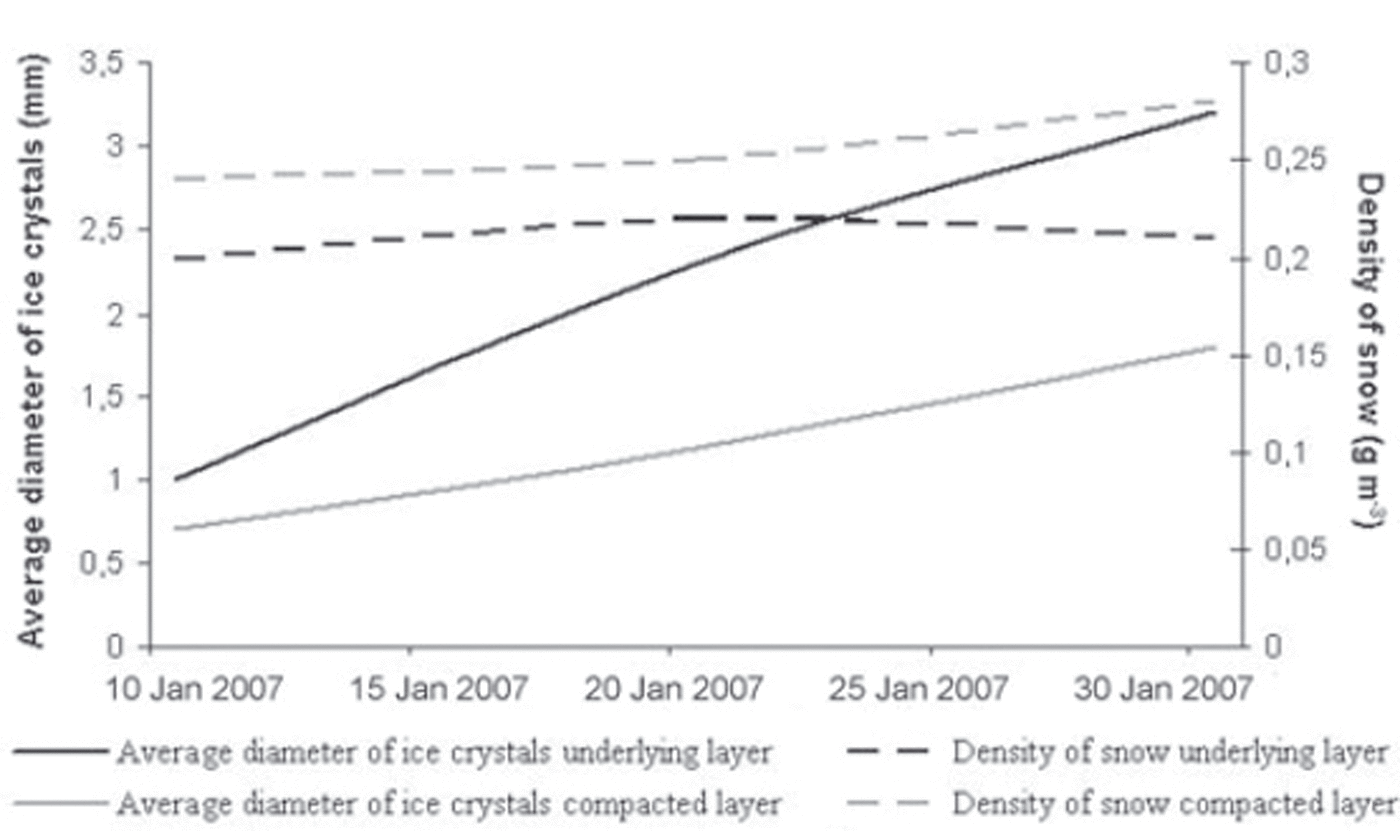
Fig. 2. Same as Figure 1, but for site 2.
As a result of this observation, it was established that:
1. in the denser layers of snow, the ice-crystal growth rate slows down;
2. in a snow layer compacted below, the growth rate of the average diameter of ice crystals increases;
3. in the snow layer below the compacted layer, the snow density decreases.
On the basis of stratigraphic observations, diagrams of the stratification of the snow cover were created (Figs 3 and 4) to determine the rate of evolution of ice crystals in the snow layer from its inception.
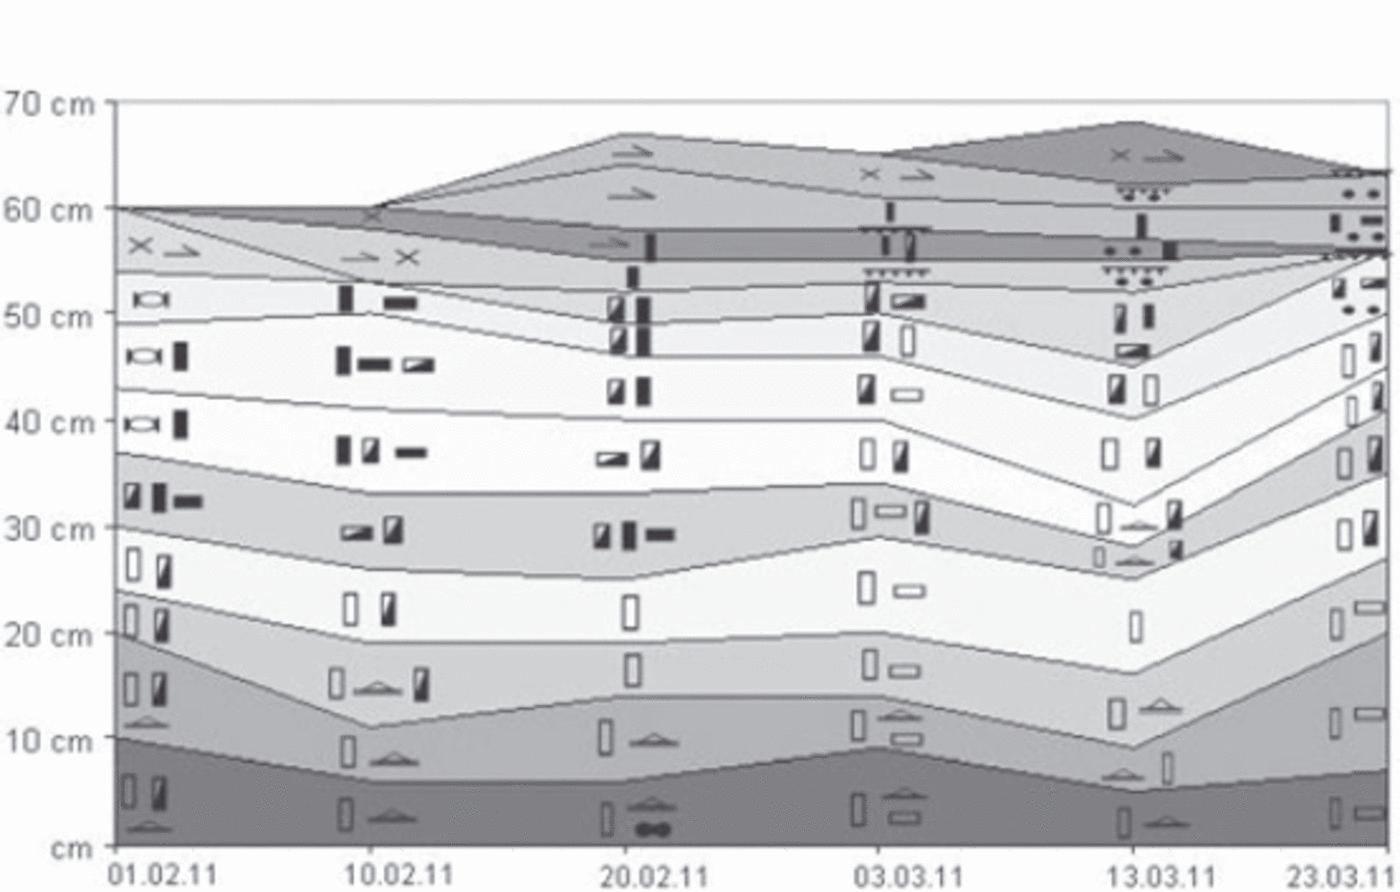
Fig. 3. Temporal incision snow cover at site 1 in winter 2010/11 (Table 1). Date format is day.month.year.
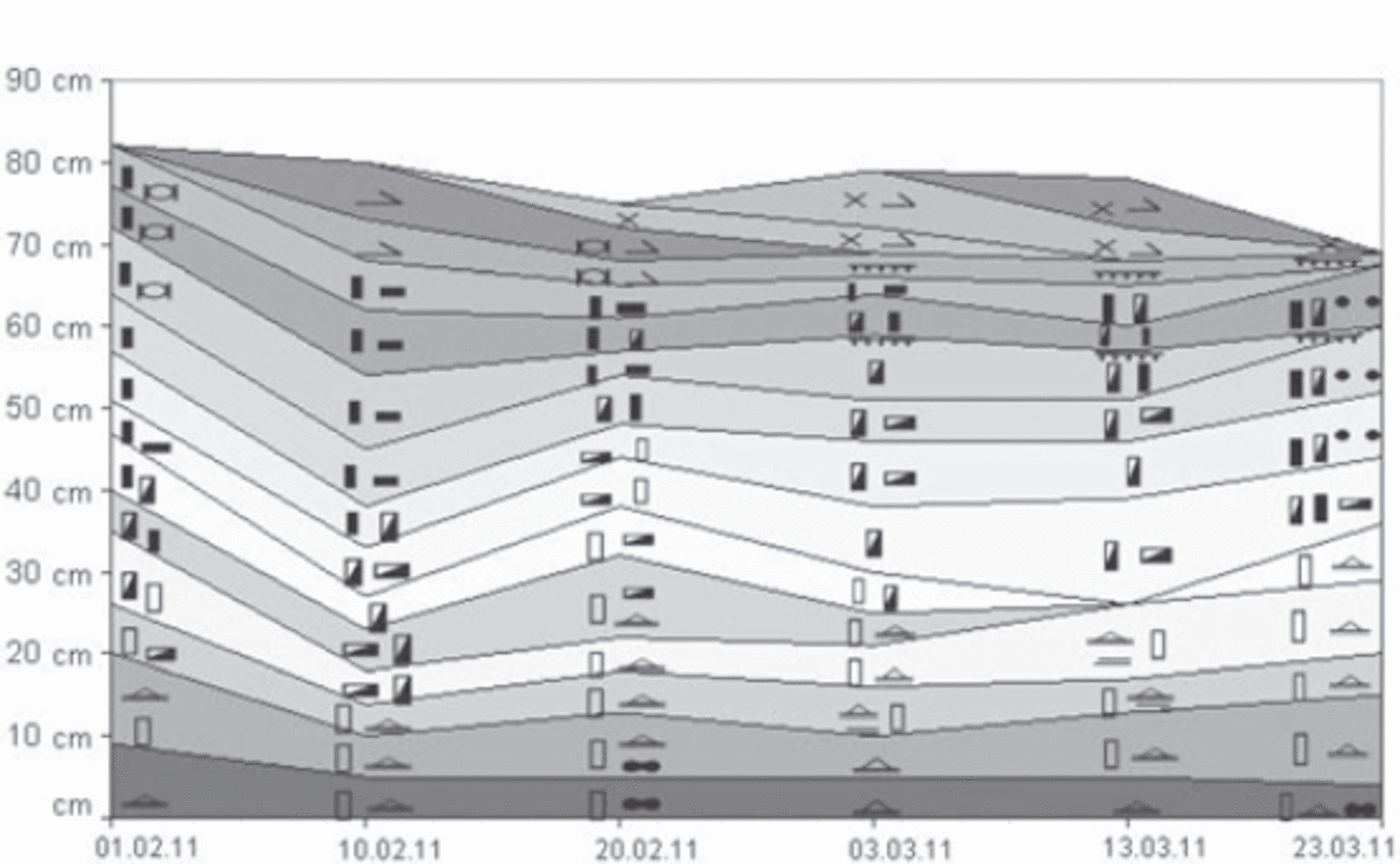
Fig. 4. Same as Figure 3, but for site 2.
In winter 2010/11, eight cyclones with rainfall exceeding 5mm passed over the Yuzhno-Sakhalinsk territory. The most intense cyclone occurred on 14–18 January 2011, when 63mm of rain fell; the formation of this snow layer was traced during the winter season (Reference TroshkinaZemtsova, 1968).
At site 1, the time taken for ice crystals, faceted forms of snowflakes, to form was 10 days, the transition from faceted to half-skeletal crystals took 20 days, and from skeletal to half-skeletal took 20 days. Even after 20 days (25 March) 50% of crystals regressed to a sectorial and lamellar phase (Fig. 3). At site 2, half-skeletal and skeletal crystals formed 5 days earlier than at site 1 (Fig. 4).
The data obtained about the speed of transition of ice crystals from one class of forms to another for winter 2010/11 coincide with the average speed of change of the structure obtained during previous winters (Reference LitenkoMikhalev and Lobkina, 2008).
The minimum growth rate of ice crystals during the study period was 0.3mm in 10 days, observed in the compacted layer. The maximum was 1.5mm in 10 days, observed under crusts of different origin.
Studies have shown the following results:
1. The coefficient of secondary stratification at site 2 for January–March exceeds the value of the coefficient at site 1 for all observation seasons (Fig. 5). This can be attributed to high soil temperatures near the soil snow layers at site 2 and the high content of water vapor in the lower layers of snow at that site.
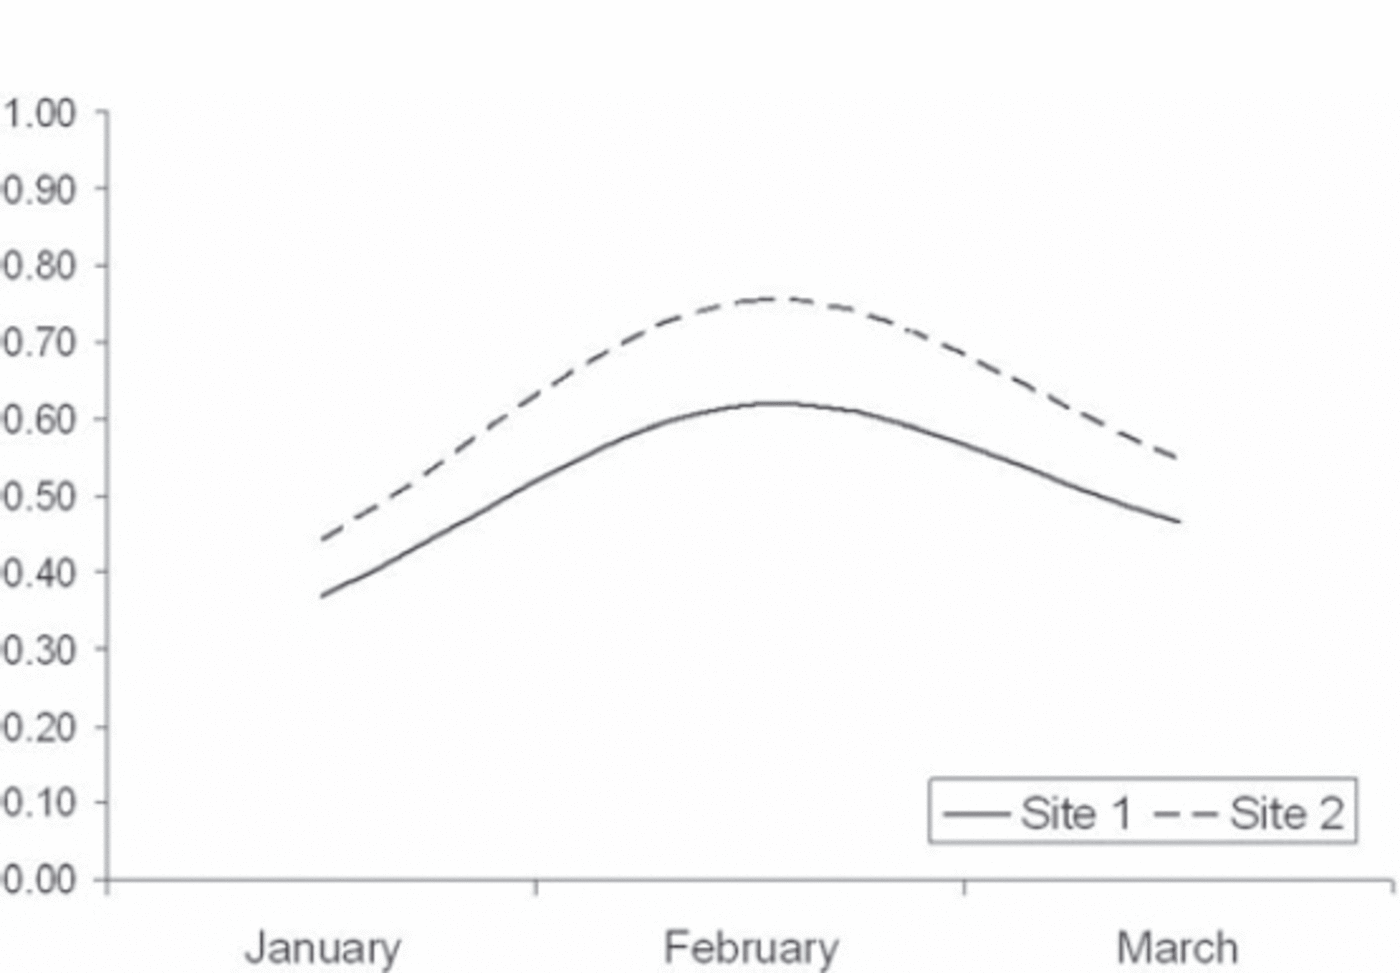
Fig. 5. Mean annual values of the coefficient secondary stratification at both sites.
2. By mid-March the rate of secondary stratification is aligned at both sites, due to the transition of some layers of snow cover at site 2 in the regressive stage of metamorphism.
3. The coefficient of recrystallization has similar values of 0.7–1 at both sites, due to the proximity of the site locations, a single period of rainfall and a similar ratio of new to old snow (Fig. 6).
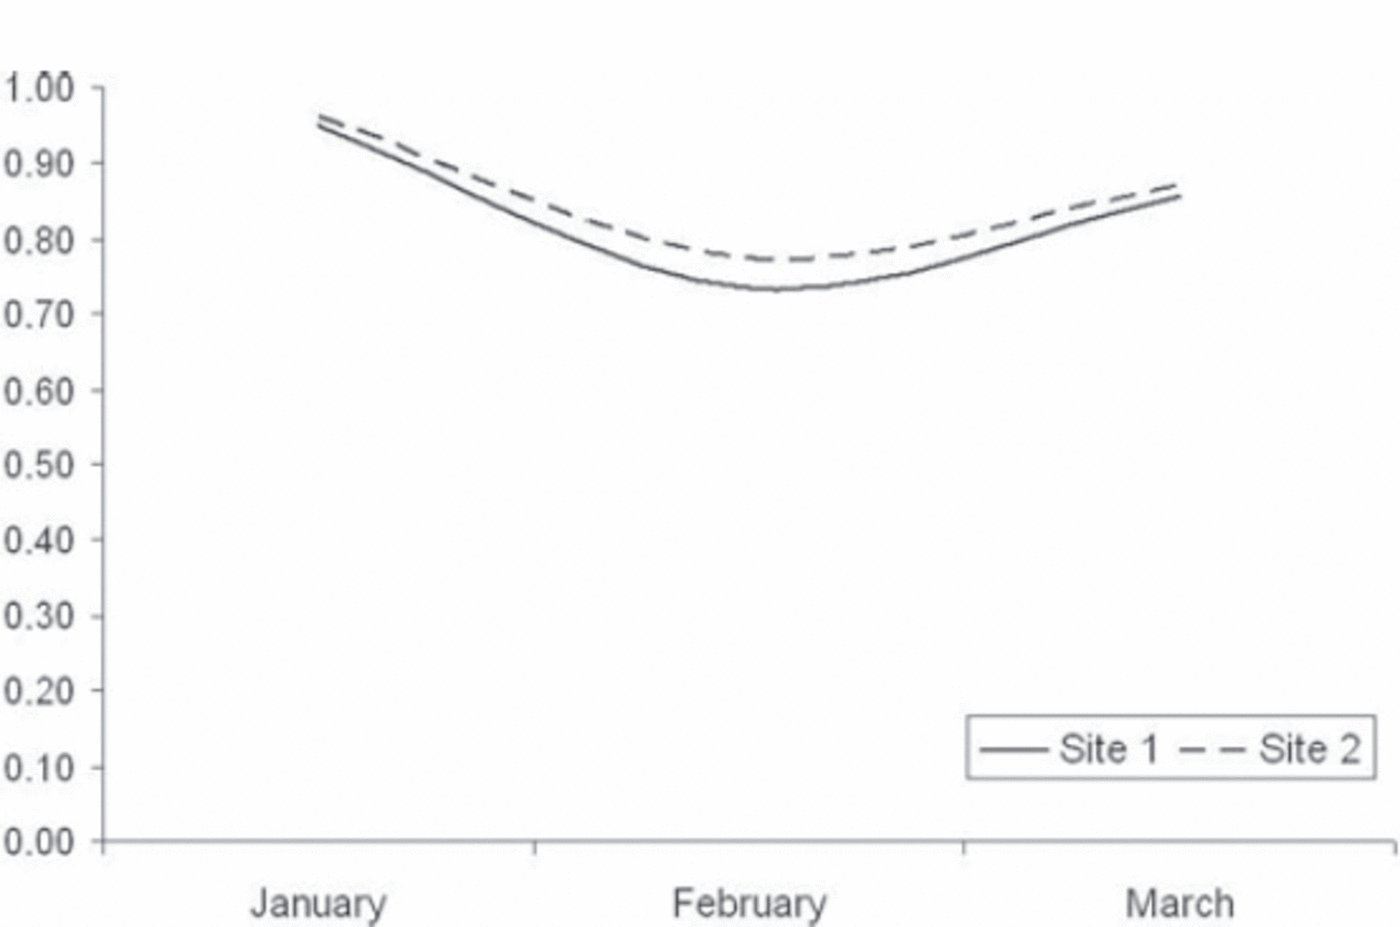
Fig. 6. Mean annual values of the coefficient of recrystallization at both sites.
4. The rate of crystal growth in a single layer is higher at site 2 than at site 1, because of more intensive mass transfer.
5. The sharp decrease in the rate of sublimation of metamorphism in the denser layers of the snow cover suggests that because of the high altitude of the snow cover, microdiffusion water vapor was more common, as in the smoothed intercrystalline space temperature variation (Vojtkovskij, 1977).
Conclusions
The crystal growth rate is twice as high in a single layer at site 2 as at site 1, indicating a more intensive mass transfer.
With a significant seal of a layer of snow relative to adjacent layers, the growth rate of ice crystals in the layer slows down (Reference VoytkovskijZhidkov and others, 1992). At the same time in the underlying layer, the growth rate of ice crystals increases.
The observations of the state of snow cover in the facies of south Sakhalin, with different degrees of humidity, yielded the following conclusions:
1. The extent of hydromorphic facies has a maximum influence on the rate of sublimation of metamorphism snow cover from December to February.
2. In the denser layers of snow cover, the rate of sublimation of metamorphism in both facies slows down.
3. The size of ice crystals reaches its maximum at the strongly hydromorphic site in mid-March, due to the maximum stage in the development of constructive metamorphism, and a sufficient amount of water vapor.


