Introduction
A broad region of brine-soaked firn extends along the ice front of McMurdo Ice Shelf, Antarctica. This brine zone and its infiltration characteristics have been studied by Reference Stuart and BullStuart and Bull (1963), Reference Risk and HochsteinRisk and Hochstein (1967), Reference HeineHeine (1968), Reference Kovacs and GowKovacs and Gow (1975) and Reference Kovacs, Gow and CraginKovacs and others (1982a) Reference Kovacs, Gow, Cragin and MoreyKovacs and others (1982b). Isotopic fractionation in the brine was reported by Reference StewartStewart (1975) and chemical fractionation was reported by Reference Cragin, Gow and KovacsCragin and others (1983). Radio-echo sounding (RES) was used to map the inland limit of brine infiltration in 1967 (Reference CloughClough, 1973) and again in 1977 (Reference Kovacs, Gow and CraginKovacs and others 1982a Reference Kovacs, Gow, Cragin and MoreyKovacs and others 1982b)
At the ice front, the firn-ice transition is below sea level. Sea water percolates in through the exposed porous firn and forms a wedge-shaped brine-soaked layer. The layer's lower surface is the firn ice transition. Its free upper surface slopes downward, from sea level at the ice front, eventually intersecting the firn-ice transition. Away from marginal effects of Hut Point Peninsula and White Island, the inland limit occurs approximately 10km from the ice front at about 40-50 m depth, 20 m below sea level
The brine layer occurs in firn with an ambient temperature of about -15°C, well below the eutectic freezing point of sea water. As the brine percolates inland, freeze concentration occurs. Near the ice front, interstitial deposition forms a low-porosity barrier which impedes further sea-water infiltration. However, brine interior to this barrier can continue to advance. At the inland limit, the brine concentration reaches about seven times that of sea water (Reference Cragin, Gow and KovacsCragin and others, 1983)
In a RES profile collected in January 1977, Reference Kovacs, Gow and CraginKovacs and others (1982a) Reference Kovacs, Gow, Cragin and MoreyKovacs and others (1982b) detected a "step" on the brine-layer surface which, by 1981, had propagated 1230m inland. They determined that such steps form at the newly exposed ice front after extensive ice-shelf break-outs. As the steps flow inland, they over-ride the pre-existing brine-layer surface. Increasing firn density encountered with depth in the interior slows the step-advancement rate. Analysis of this step led Reference Kovacs, Gow and CraginKovacs and others (1982a) Reference Kovacs, Gow, Cragin and MoreyKovacs and others (1982b) and Reference Cragin, Gow and KovacsCragin and others (1983) to conclude that sea-water infiltration in McMurdo Ice Shelf occurred largely by recurrent influxes of similar steps.
We resurveyed the brine-zone boundary during the 1992-93 austral summer. Brine-limit motion, indicated by comparison with previous surveys, allows us to examine the proposed advancement mechanism
Radio-Echo Sounding Survey
Reference Smith and EvansSmith and Evans (1972) discussed radio-wave reflections from brine-soaked firn. They showed that the high electric conductivity of brine causes both strong radio-wave reflections from the dry-firn/brine-soaked-firn interface and strong; attenuation within the brine layer. Thus, detection of features below the brine layer, such as the ice-shelf bottom, is precluded. Reference CloughClough (1973) described radio-echo sounding of the brine layer within McMurdo Ice Shelf. He observed that the brine-limit location can be easily identified in RES profiles by a discrete jump in bottom-echo return time.
For our survey, we used a surface-based impulse ice-radar system similar to that described by Reference Watts and WrightWatts and Wright (1981). Antenna-loading characteristics determine the center frequency of the transmitted broad-band pulse. Our system was operated at either 5 or 20 MHz, allowing in-ice resolution of 17 and 4m, respectively. We located the brine limit between Hut Point Peninsula and White Island by traveling on a zig-zag course. Wave forms were continuously monitored and stored digitally at 50 m intervals. Positions of successive brine-limit crossings were measured with a Trimble Pathfinder GPS receiver.
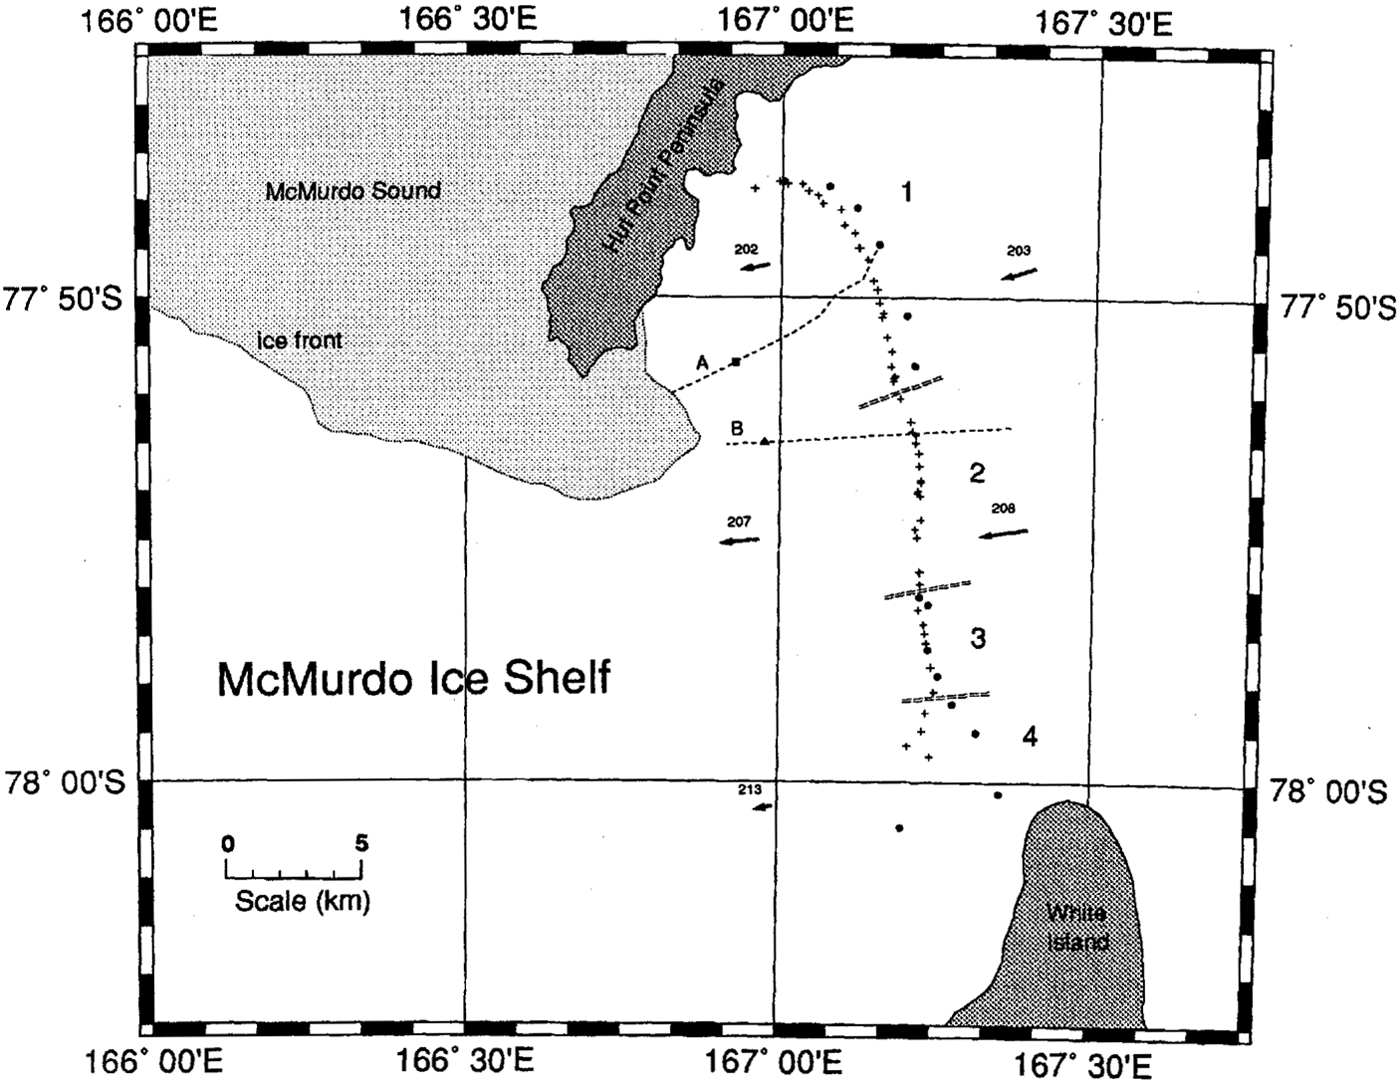
Figure 1 shows 54 brine-limit crossings from our traverse. Since these positions were determined by an autonomous GPS receiver, i.e. we made no differential position corrections, we estimate that our uncertainty in position was 100 m. Brine-limit positions from the 1977 survey (Reference Kovacs, Gow and CraginKovacs and others 1982a Reference Kovacs, Gow, Cragin and MoreyKovacs and others 1982b) are shown on Figure 1 as dots. These positions were determined by triangulation of observations to local landmarks; their largest positioning error was approximately 30 m (personal communication from A.J. Gow, 1993). The arrows on Figure 1indicate paths of surface markers observed over the 16 year interval by members of the New Zealand Antarctic Program (personal communication from G. Rowe, 1993).

Fig.1 Inland limit of McMurdo lee Shelf brine zone. Dots indicate brine-limit positions from the 1977 survey, crosses are from the 1992-93 survey. Double-dashed lines demarcate sections" 1" through "4" discussed in the text. Arrows indicate 16 year displacements of surface markers. "A" is the path of the 1977 RES profile and "B" is the path of the 1993 RES profile shown in Figure 2. Coastlines and ice front were taken from USGS. map # 76190- W1-RR-250.

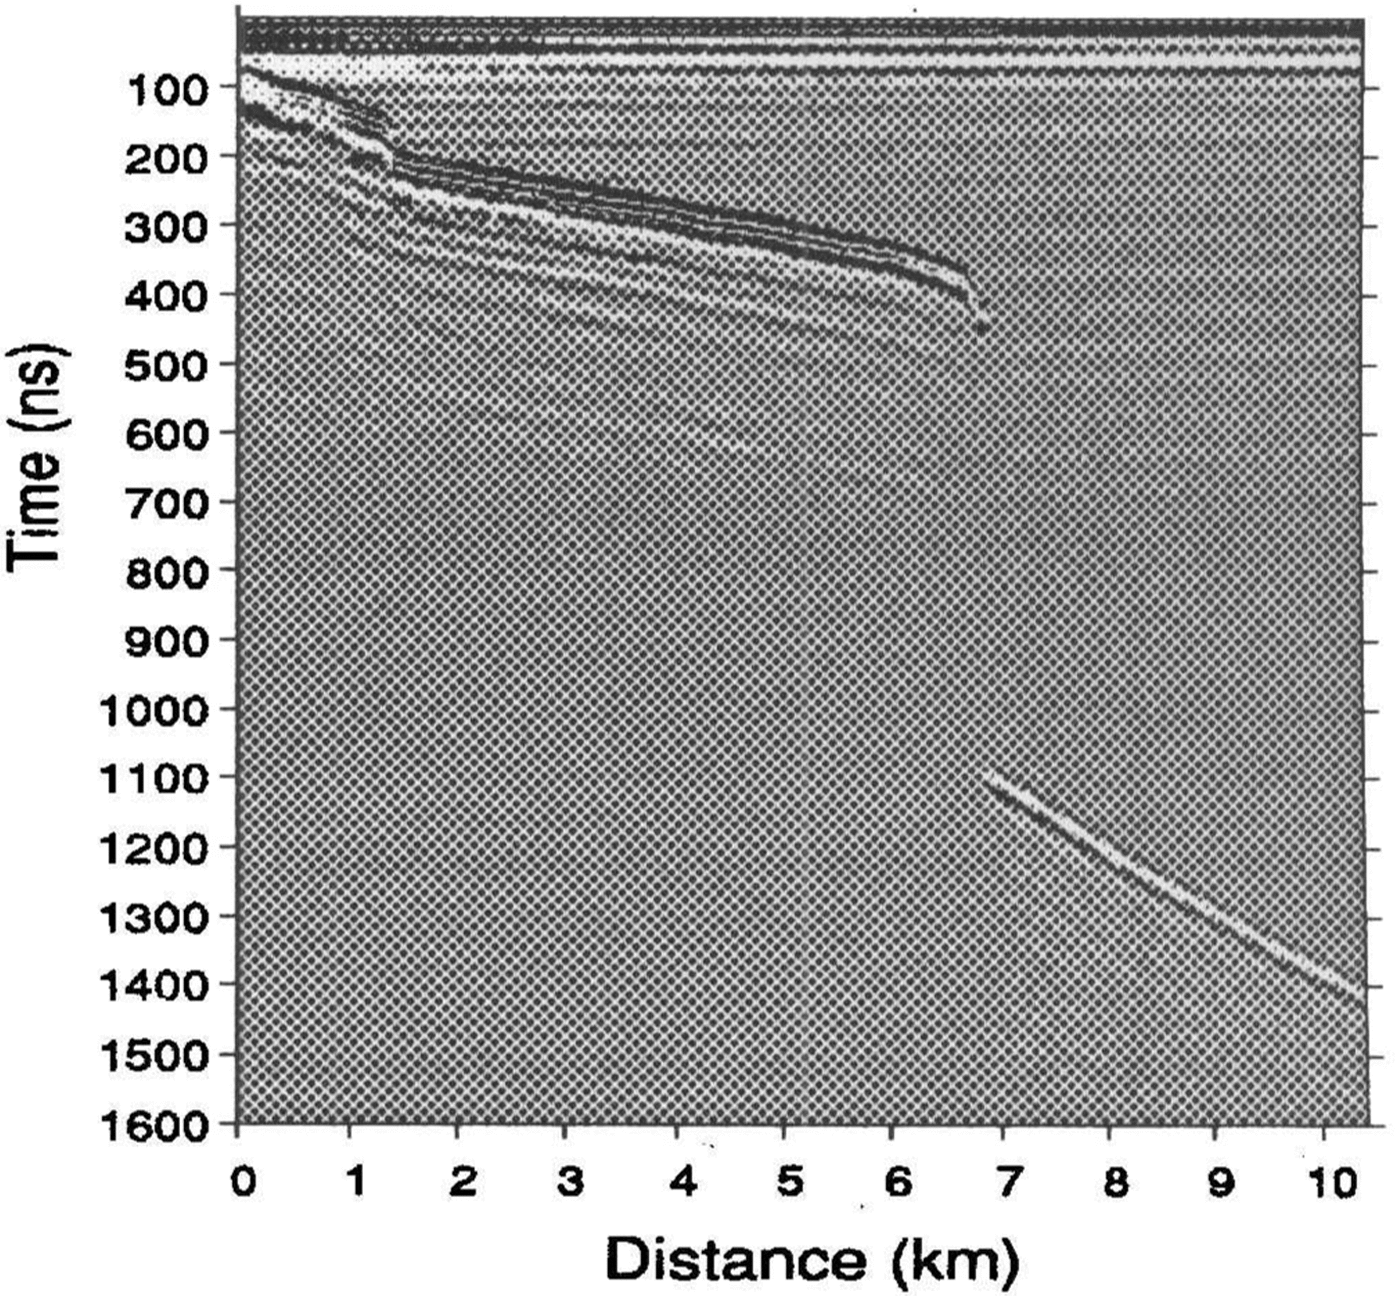
Fig.2 20 MHz: radio-echo-sounding profile collected on 1 February 1993. Return-signal amplitude (represented by gray scale) is plotted against echo-return time in ns. Trace separation is 50 m. Distances are measured from the western end of the profile. A ~ 4 m high brine" step" is apparent at 1.5 km. The brine limit is crossed at 7km, beyond which the ice-shell bottom can be seen.
Brine Limit Motion
For convenience in the following discussion, we divide the brine limit into the four numbered sections shown in Figure 1. The 1977 survey did not include positions within section 2 (77°52'-77°56' S). Although an interpolation between their points coincides with our section 2 positions, this is not sufficient to argue that this section of the boundary has been stationary since 1977. Not shown in Figure 1 are brine-limit positions from the 1967 survey (Reference CloughClough, 1973). That survey did contain points within region 2 and brine-limit retreat since 1967 might be indicated, but uncertainty in the 1967 positions makes this hypothesis untestable.
Section 4 (south of 77°58' S) appears to show significant brine-limit motion since 1977. However, the ice shelf is thin in this area. Indeed, large crevasses, open to the sea, are seen adjacent to the shore of White Island. (Reference Kovacs, Gow and CraginKovacs and others 1982a Reference Kovacs, Gow, Cragin and MoreyKovacs and others 1982b). In this region, it is likely that the brine has percolated laterally from the nearby crevasses or vertically from below. Because of these additional brine sources, we cannot reliably monitor brine advancement in this region without much greater spatial and temporal sampling resolution.
We will focus on brine-limit motion in section 1 (north of 77°52' S) and section 3 (77°56'-77°58' S). The section 3 brine-limit position appears to be unchanged since 1977. We use the surface-marker displacements shown in Figure 1 to estimate ice-shelf motion in the vicinity of the brine limit. Section 3 is nearly midway between markers 213 and 208; the mean of their 16 year displacements is 1250 m. We take this as an estimate of the section 3 ice-shelf displacement. Since, in section 3, the brine-limit position appears to have been stationary, the brine's mean infiltration rate must have equalled the ice-shelf’s seaward flow rate of 78 m a-1. This is perhaps a conservative estimate, since section 3 is closer to marker 208 than 213, and the ice-shelf flow at 213 is likely affected by White Island.
Within section 1, comparison of the 1977 and 1993 surveys indicates that the brine limit has moved seaward by about 800 m. This section is midway between markers 202 and 203; the mean of their 16 year displacements is also about 1250 m. If we take this as the ice-shelf displacement, then in section 1 the brine limit must have advanced 450 m through the firn, a mean rate of 28 m a-1, to have attained its 1993 position.
During their 1977-81 survey, Reference Kovacs, Gow and CraginKovacs and others (1982a) Reference Kovacs, Gow, Cragin and MoreyKovacs and others (1982b) measured a brine-limit diffusion rate of 3.6 m a-1. Clearly, the brine-limit advancement which has occurred in sections 1 and 3 since 1977 is the result of a more active process
Brine-Layer Steps
In a RES profile collected along the path "A" in Figure 1, Reference Kovacs, Gow and CraginKovacs and others (1982a) Reference Kovacs, Gow, Cragin and MoreyKovacs and others (1982b) identified a 4.4 m high inland-propagating brine step. The square shows the step's January 1977 position. They observed that, by 1981, this feature had moved 1230 m inland, giving a mean speed of 308 m a-1. Following the treatment of Reference ThomasThomas (1975), they showed that the advancement rate of this brine pulse could be predicted by Darcy's law of fluid flow through porous media:

where η is brine viscosity and δP / δx is the pressure gradient. For firn permeability, B0 , they used a modified form of Reference ShimizuShimizu's (1970) relation for snow:
where d is the grain diameter in m and ρfirn is the firn density in Mgm3. By these relations, they calculated a transport rate of about 310 m a-1 for the pulse at its November 1978 position.
It would be tempting to conclude that the arrival of this step is responsible for the section 1 brine-limit advancement since 1977. If so, it must have traveled about 7250 m through the ice, a mean speed of about 450ma-1. It is unlikely that this step would have advanced this far, since the required speed is considerably faster than its 1977-81 mean speed and the propagation is expected to slow as it advances.
However, the possibility remains that arrival of brine pulses has controled the section 1 brine infiltration. If so, the likely cause of advancement was a second step seen in the 1977 profile. This step was then 0.6 m high and 3.8 km from the brine limit. For it to have reached the 1993 brine-limit position, it needed to travel only 4.2 km through the ice, a mean speed of 260 m a-1. This value is consistent with the observed and calculated brine-step propagation rate (Reference Kovacs, Gow and CraginKovacs and others 1982a Reference Kovacs, Gow, Cragin and MoreyKovacs and others 1982b).
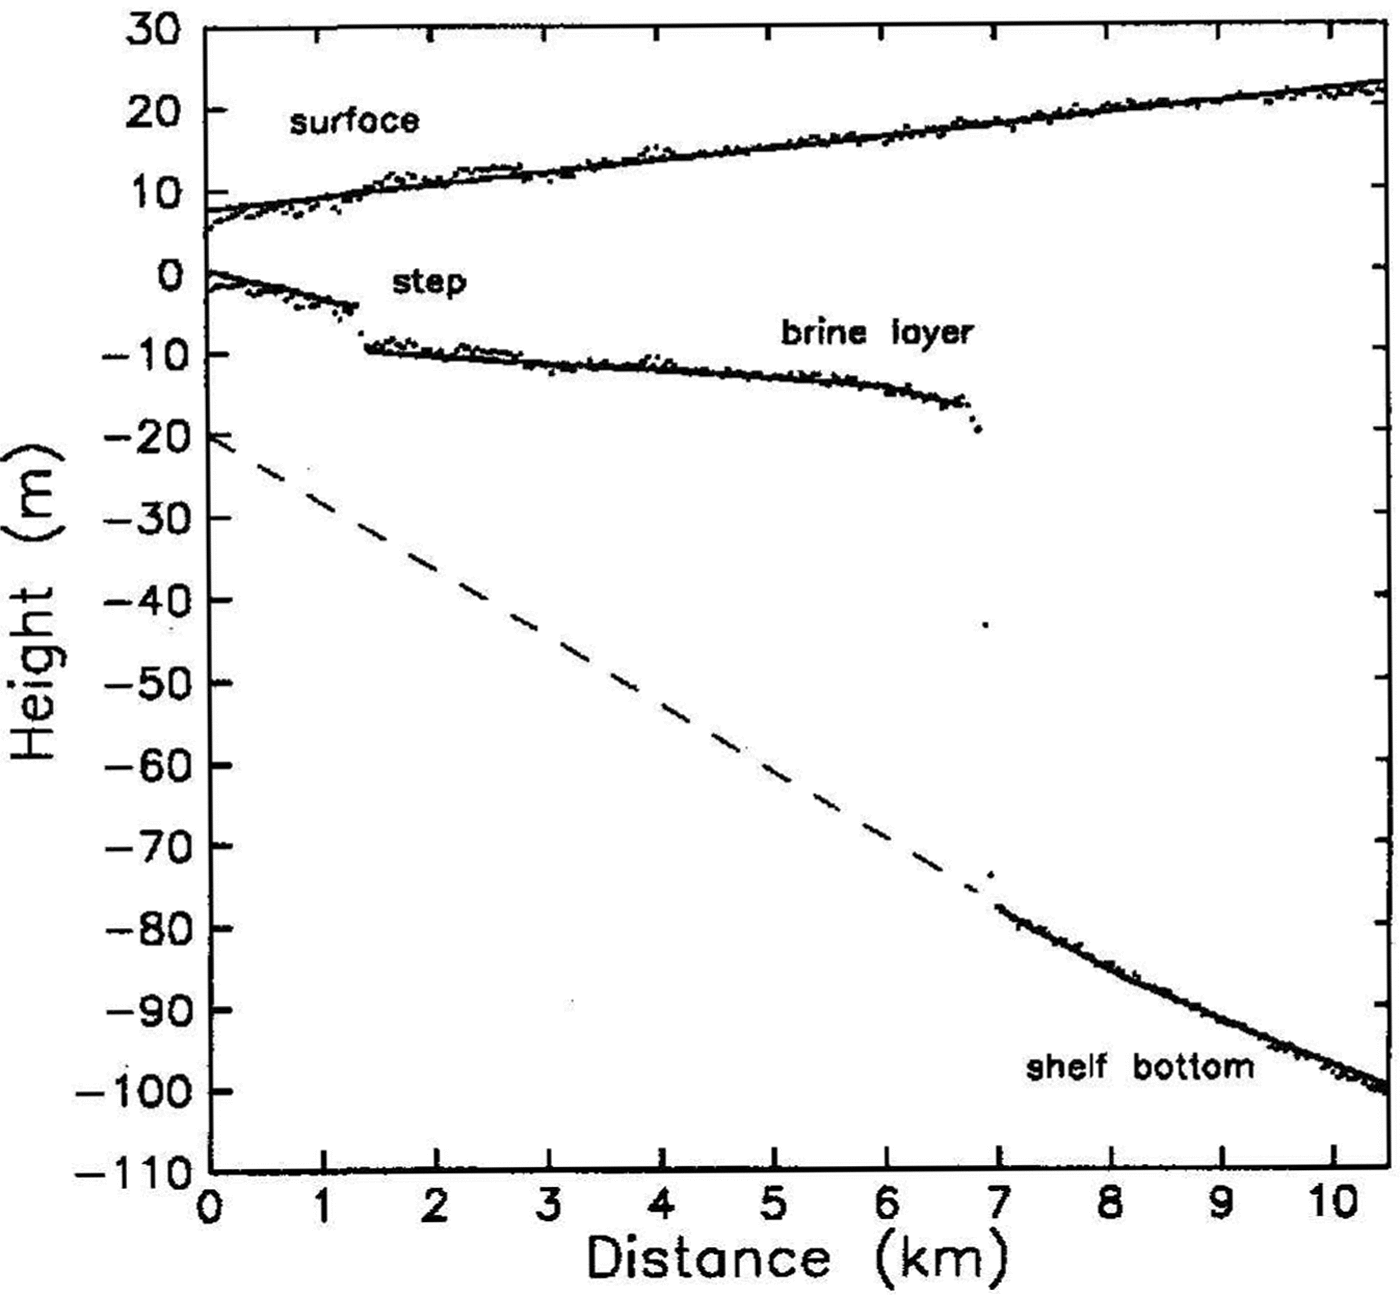
During our survey, we also observed a brine step. Figure 2shows a RES profile, collected on 1 February 1993, along the dashed path "B" of Figure 1; Figure 3shows bottom-reflector depths and surface elevations interpreted from this profile. An approximately 4 m high step is evident near 1.5 km. Its 1993 position is shown on Figure 1 by the triangle. We did not measure the distance of this step from the 1992-93 ice front and we do not have a record of break-outs since 1981; however, it is likely that this step is the result of the major break-out of February and March 1980 (Reference Kovacs, Gow and CraginKovacs and others 1982a Reference Kovacs, Gow, Cragin and MoreyKovacs and others 1982b).

Fig.3 Surface elevations and bottom-reflector depths from profile "B". A least-squares line is drawn through the elevation data, radar-derived thickness values subtracted from this line yield the line drawn through the bottom echo-depth data. The dashed line below the brine layer schematically represents the ice-shelf bottom
Discussion
The section 1 and 3 mean advancement rates since 1977 differed by a factor of 3 or more. In section 1, the advancement is consistent with the arrival of a previously identified pulse. The apparent lack of motion of the section 3 limit might lead one to conclude that a steady-state infiltration process controls the limit position. However, this is unlikely since pulses are a consequence of the periodic driving function (ice-front break-outs) and freeze concentration. Unless the section 3 limit is responding to a brine source other than the ice front, we must conclude that, as in section 1, brine-pulse arrival is responsible for the limit advancement. Thus, the limit position must have advanced and retreated (or retreated then advanced) such that it returned to its 1977 position during the 1992-93 austral summer. Direct comparison of the mean advancement rates for the two sections are confounded by the effects of aliasing: either the two sections are responding out of phase to the same break-out event or they are responding to different break-out events. More frequent surveys are required to distinguish these
The observation of a brine step in 1993 confirms that brine pulses arc recurrent features. And, brine-limit advancement since the 1977 survey is consistent with the brine-step description of Reference Kovacs, Gow and CraginKovacs and others (1982a) Reference Kovacs, Gow, Cragin and MoreyKovacs and others (1982b) and Reference Cragin, Gow and KovacsCragin and others (1983). Thus, in McMurdo Ice Shelf: brine infiltration appears to be episodic. As such, the brine-limit position will advance and retreat about some mean position in response to the ice-front break-out history. We can estimate this mean position by the location at which the brine-infiltration rate; calculated by the Darcian flow given above, equals the ice-shelf flow rate. Approximate the pressure gradient, δP/δx, by ρwatergh/x, where h is the depth below sea level and x is the distance inland. We use values given by Reference Kovacs, Gow and CraginKovacs and others (1982a): η ~ 5.3 x 10⁻³ (Pas) at -16°C; h = 18 m, d = 2 mm, and ρfirn = 0.78 Mg m 3. Using the section 1 ice-shelf flow rate of 78 mal and solving for x results in a distance of 9.4 km. In section 3, the direction of brine percolation makes almost a 45° angle with the ice-shelf flow direction; if we reduce the ice-shelf flow rate by cos(45°), this distance becomes 13km. These values are in good agreement with the positions shown on Figure 1. Unusually large perturbations from this "characteristic" brine-limit position may give us an indication of temporal changes in the ice shelf. The brine-limit position is sensitive to the firn-ice transition depth and to ice-shelf velocity. These parameters can be measured to high precision, by coring and optical surveys, respectively, but only at discrete locations. However, a regional evaluation of the interplay between firn ice transition depth and ice-shelf movement can be made by radio-echo sounding of the brine limit
Acknowledgements
We thank C. R. Bentley for suggesting this study, and A. Kovacs and A.J. Gow for generously providing us with their data. Also, thanks arc due to G. Rowe, of the New Zealand Department of Survey and Land Information, for providing surveyor's reports from the "McMurdo Ice Shelf Monitoring Project", and to H. Conway for helpful discussions. This work was supported by U.S. National Science Foundation grant DPP-8915924.


