Introduction
Ice Ih is ordinary ice, and the oxygen nuclei in ice Ih have a hexagonal arrangement. The orientations of water molecules are disordered at temperatures from 0 K to the melting point, and therefore the positions of the protons are disordered following the ice rules (Reference PaulingPauling, 1935): (1) there is only one proton on each bond, and (2) there are only two protons close to each oxygen nucleus. Thus, protons in ice Ih are equally distributed between the two possible sites on each O-O bond.
The vibrational spectra of ice, which are associated with the arrangement of protons and oxygen nuclei, have been mainly investigated using incoherent inelastic neutron scattering (HNS) (Reference Li, Ross, Maeno and HondohLi and Ross, 1992) and Raman scattering (Reference Wong and WhalleyWong and Whalley, 1975,Reference Wong and Whalley1976). Reference Fukazawa, Mae, Ikeda and WatanabeFukazawa and others (1998b) measured the IINS spectra of Dome Fuji (DF) Antarctic ice, which has remained at a constant temperature for a long period (102 to 105 years), and they hypothesized that a very slow change in the proton arrangement occurs in ice. DF ice was retrieved by the Japanese Antarctic Research Expedition (JARE) at the DF station located on the top of a mountain in Antarctica (77°22’S, 39°37’E; 3807 ma.s.l.) in 1995 and 1996 (Reference WatanabeWatanabe and others, 1997). They found that the IINS spectrum of the librational vibrations of DF ice at 350 m depth is different from that of ice Ih, but that it is similar to that of ice XL These results imply that DF ice at 350 m depth has the same proton-ordered arrangement as does ice XL Ice XI is a proton-ordered phase that was found by Reference Tajima, Matsuo and SugaTajima and others (1982) in 0.001–0.1 mol KOH-doped ice at temperatures of ≤ 72 K. The protons in ice XI are fixed at one site on each O-O bond (Reference Leadbetter, Ward, Clark, Tucker, Matsuo and SugaLeadbetter and others, 1985). Reference Howe and WhitworthHowe and Whitworth (1989) and Reference Line and WhitworthLine and Whitworth (1996) measured the neutron diffraction of powdered KOH-doped ice and obtained the polar structure of the space group Cmc2,. Reference Jackson, Meld, Whitworth, Oguro and WilsonJackson and others (1997) obtained the same result in a neutron-diffraction study of a single crystal of KOH-doped ice.
Reference Fukazawa, Ikeda, Hondoh, Lipenkov and MaeFukazawa and others (1996, Reference Fukazawa, Suzuki, Ikeda, Mae and Hondoh1997, Reference Fukazawa, Mae, Ikeda and Watanabe1998b) investigated the Raman scattering of translational lattice vibrations in Antarctic ice and found that the ratio of peak intensities at 300 and 220 cm–1, IR, depended on the ice temperature, Ti, in the ice sheet. An incident laser beam with a diameter of 1 μm was focused on an appropriate crystal grain. The crystal grain was pure ice because impurities in ice are concentrated at the grain boundaries (Reference Fukazawa, Sugiyama, Mae, Narita and HondohFukazawa and others, 1998a). From the Raman spectra, they calculated the Ti, dependence of the order parameter (the ratio of ordered protons in ice), η, which was consistent with the theory of the second-disorder phase transition from the proton-disordered arrangement in ice Ih to the proton-ordered arrangement in ice XI at Ti, = 237 K.
Since the phase transition in Antarctic ice is caused by a change in intermolecular potential, this change is expected to occur in ice Ih when the measurement temperature is reduced to ≤ 237K. In order to observe the change in molecular polarizability due to the change in inter molecular potential, we measured the Raman spectra of ice Ih in the temperature range 198–270 K. We then compared the Raman spectra of ice Ih and DF ice in order to clarify the phase transition of ice according to the change in Ti. We also examined the possible effects of the phase transition on properties of ice that may have geophysical significance, such as mechanical and electrical properties.
Neutron-diffraction measurements provide a direct method for determining the proton ordering in ice. We have been working on neutron-diffraction measurements on DF Antarctic ice. In this paper, we report preliminary results of neutron powder diffraction of DF ice at Ti = 214 K, and discuss arrangements of protons in DF ice.
Experimental Methods
Neutron-diffraction data for the sample were measured in the lattice-plane spacing (d) range of 1.8–2.2 A on the time-of-flight powder diffractometer (Vega). The Vega is installed at the High Energy Accelerator Research Organization (KEK), Japan. DF ice at 350 m depth (Ti = 214 K) was finely ground, and the representative particle size is about 10 Mm. The temperature of the sample was held at 75 K during the measurements.
The Raman spectra of ice Ih in the range 50–4000 cm–1 were measured using a JOBIN YVON RAMANOR T64000. The excitation energy for Raman scattering was produced by an Ar-ion laser of 5145.5 nm with an output of 300 mW. We measured the spectra of the polarization plane of the incident beam parallel and perpendicular to the c axis of ice Ih. The scattered light was collected at 180° to the direction of the laser beam.
A single crystal of ice Ih was made from water using the modified Bridgman method. The Raman spectra were measured at temperatures of 198–270 K. Fluctuation in the measurement temperature was within 0.1 K.
Results
Neutron powder diffraction
Figure 1a shows the preliminary result of the neutron-diffraction profile of DF ice (at 350 m depth) in the d range 1.8–2.2 A at a measurement temperature of 75 K. The profile has large peaks at 1.91 and 2.07 A, and small peaks at 1.83, 1.89, 1.95, 2.02 and 2.13 A. The peaks at 1.83, 1.89, 1.91, 1.95 and 2.07 A are observed in the profile of ice Ih with proton-disordered arrangement.
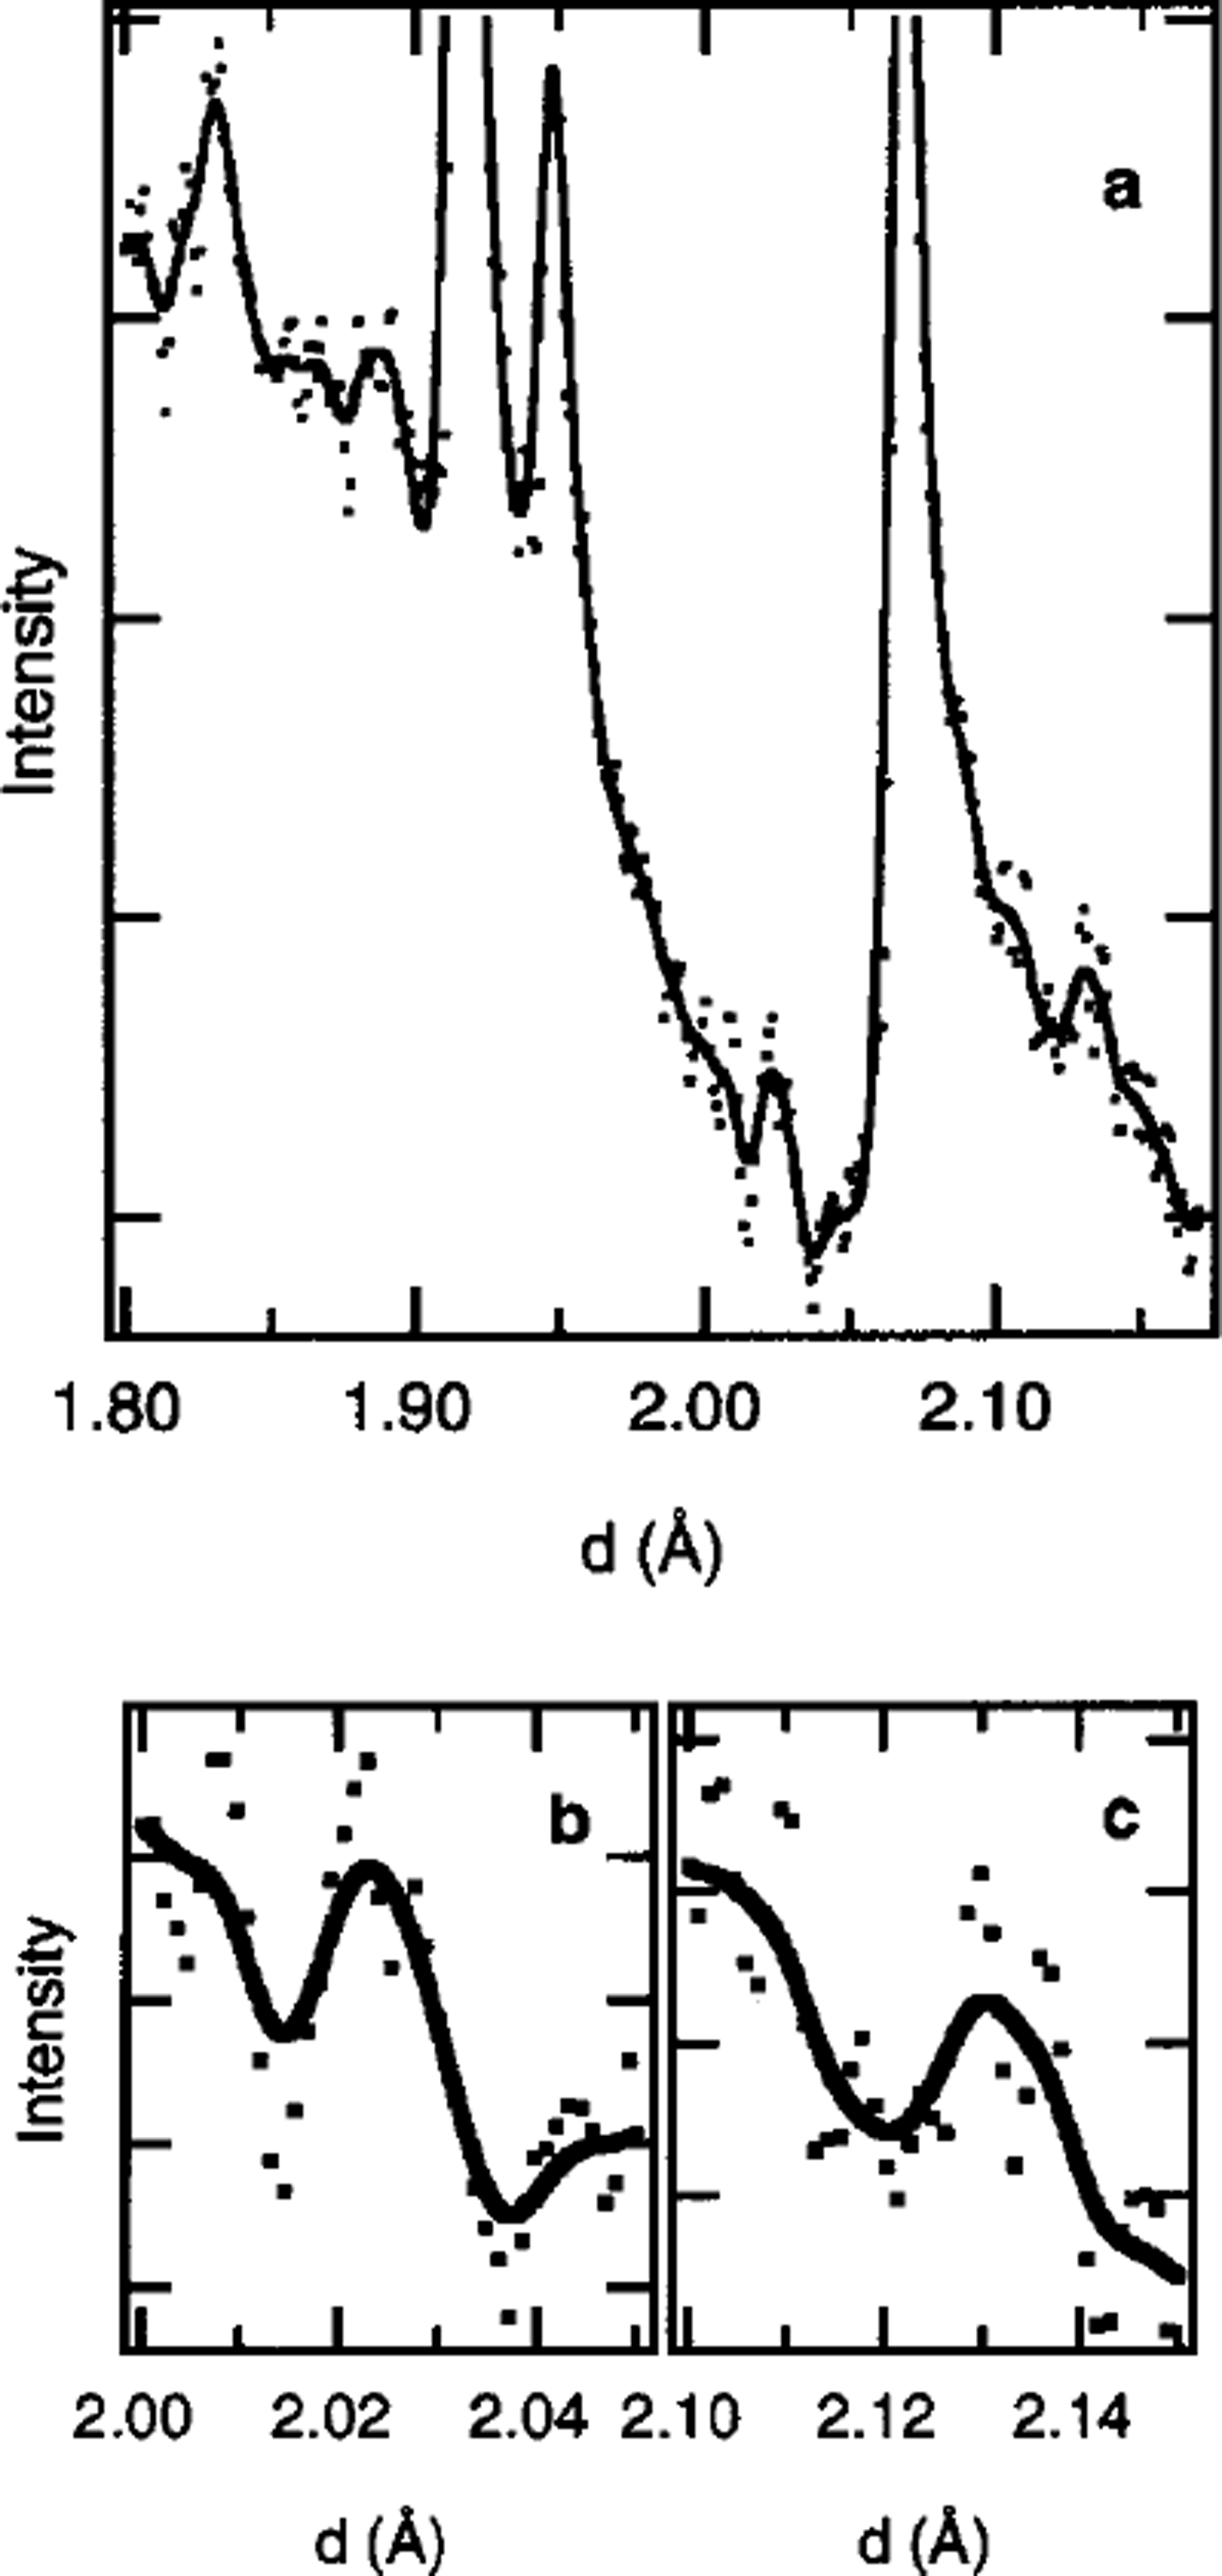
Fig. 1. Neutron-diffraction profiles of DF ice at 350 m depth and a measurement temperature of75K.
Figure lb and c show the neutron-diffraction profiles of DF ice in the d ranges 2.00–2.05 and 2.10–2.15 A, respectively. The peaks at 2.02 and 2.13 A are clearly observed. These peaks are not seen in the profile of ice Ih.
The translational lattice vibrations
The Raman spectrum of ice Ih has a peak at about 220 cm–1, which is assigned to translational lattice vibrations (Reference Wong and WhalleyWong and Whalley, 1976), and a peak at about 3140 cm–1, which is assigned to the O-H stretching vibrations (Reference Wong and WhalleyWong and Whalley, 1975) Figure 2 shows typical spectra of ice Ih at measurement temperatures of 220, 238 and 253 K in the region of translational lattice vibrations (150–350 cm–1). The Raman spectra at 220 K have a large peak at 221.61 cm"1 and a small peak at about 300 cm–1. The large peaks in the spectra at 238 and 253 K are at 220.52 and 218.07 cm–1, respectively. Our analysis of the temperature dependence of translational lattice vibrations is restricted to the frequency of the large peak at about 220 cm–1, vT, because the peak at about 300 cm"1 is too small and broad.
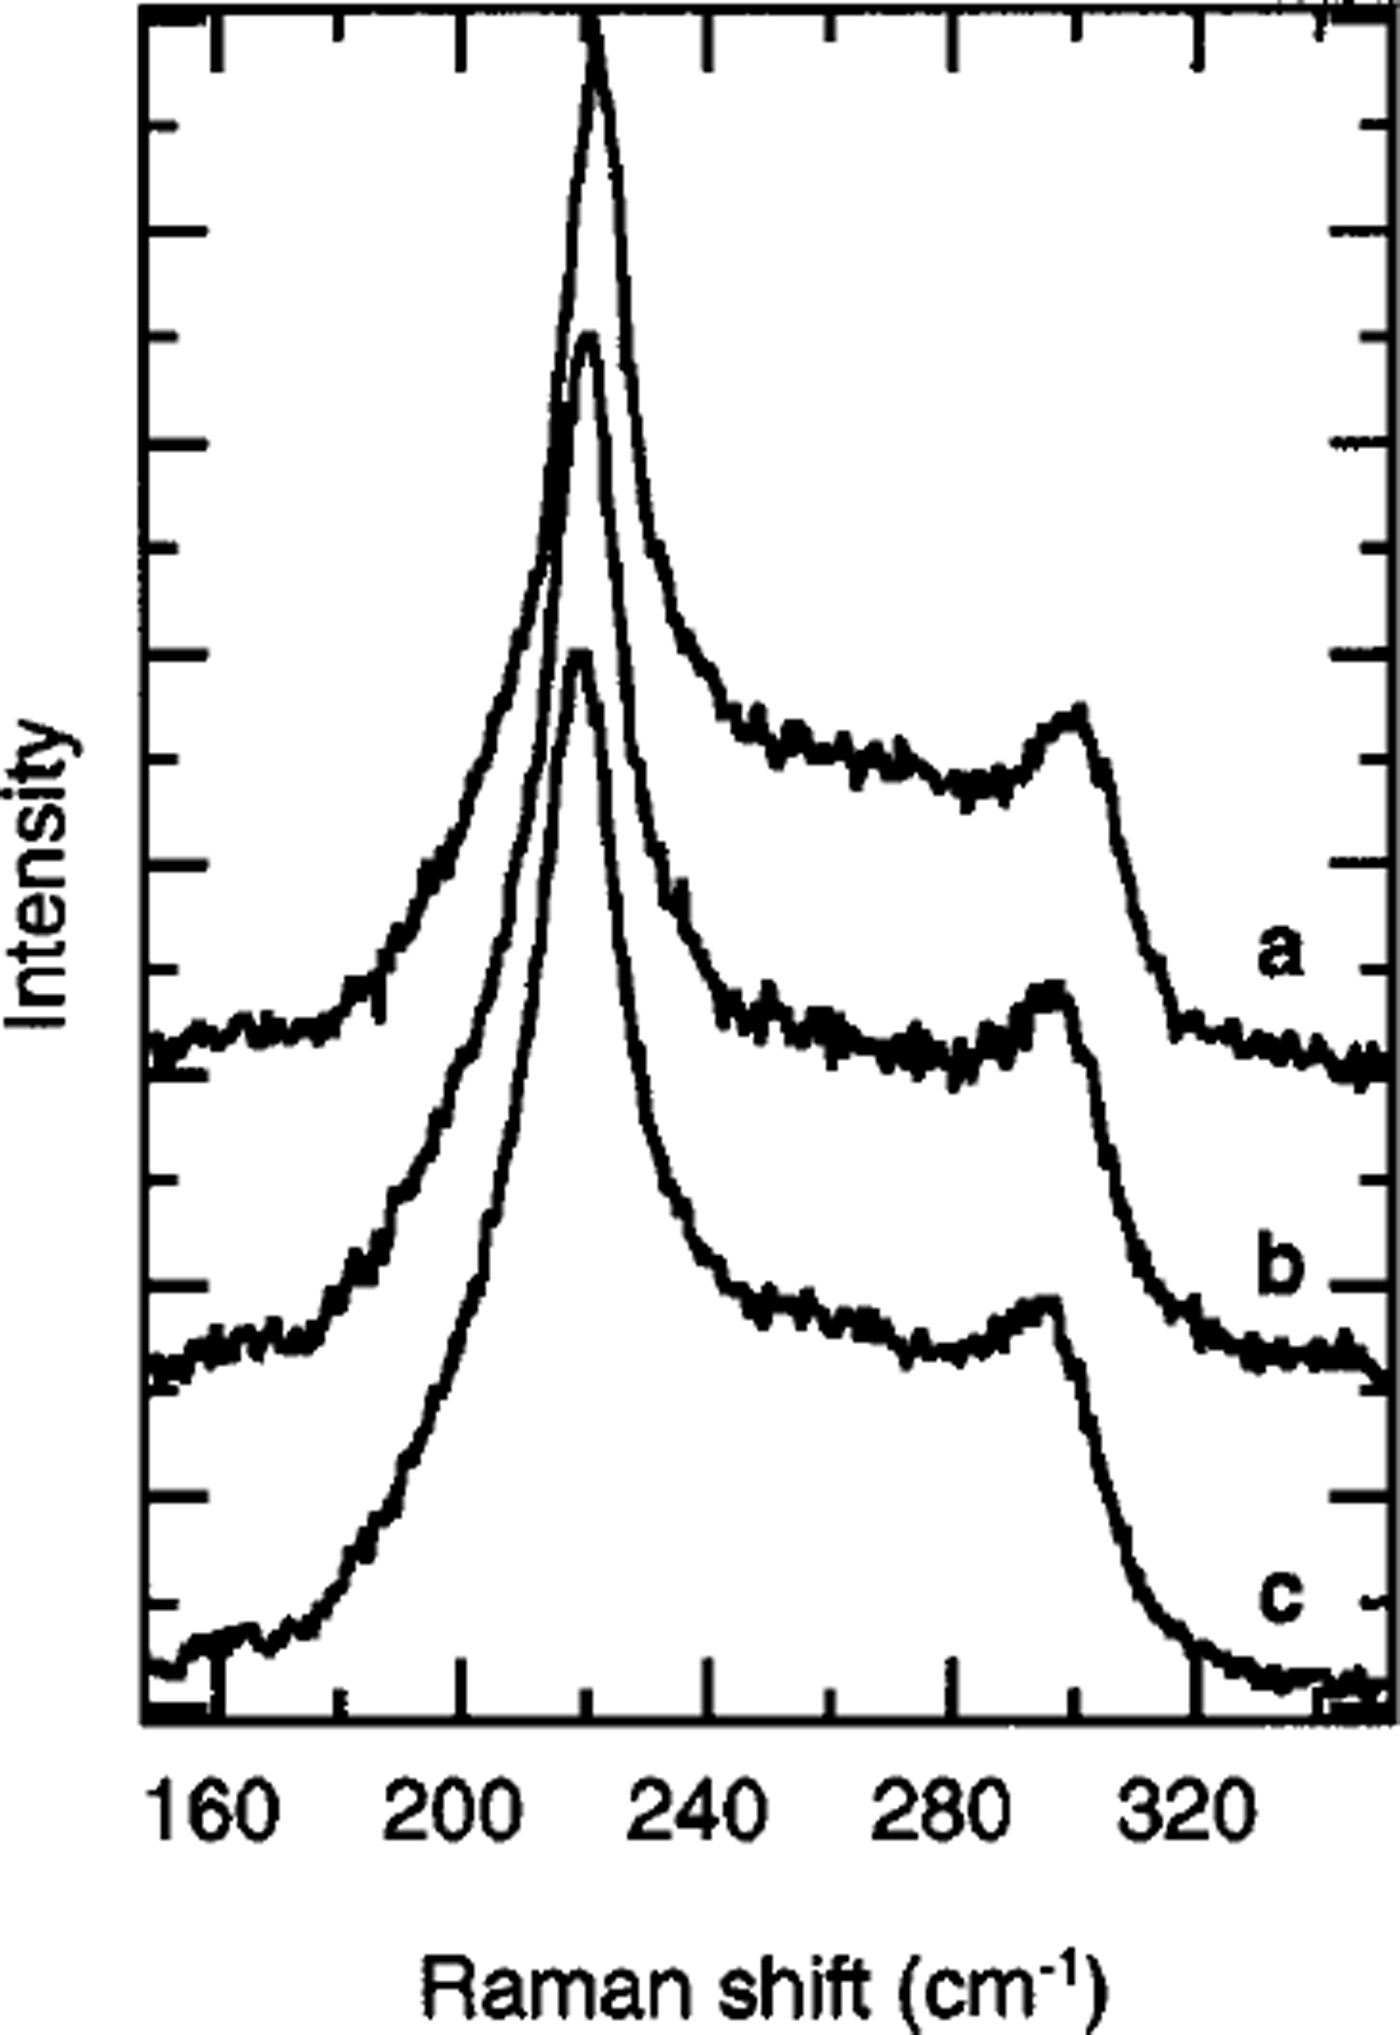
Fig. 2. Raman spectra of ice Ih in the region of translation^ lattice vibrations (150–350 cm–1). Measurement temperatures: (a) 220 K, (b) 238Kand (c) 253 K. The polarization plane of the incident beam was parallel to the c axis of the sample.
Figure 3 shows the temperature (T) dependence of vT∥c and vT⊥c, where v T∥c and vT⊥c represent the values of vT for the polarization planes parallel and perpendicular, respectively, to the c axis of ice Ih. We found that both v T∥c and vT⊥ c decrease with increases in T, and that the rates of decrease in v T∥c and vT⊥ c discontinuously change at a measurement temperature of Tc = 237 K. The following relations (dotted lines in Fig. 3) were obtained:
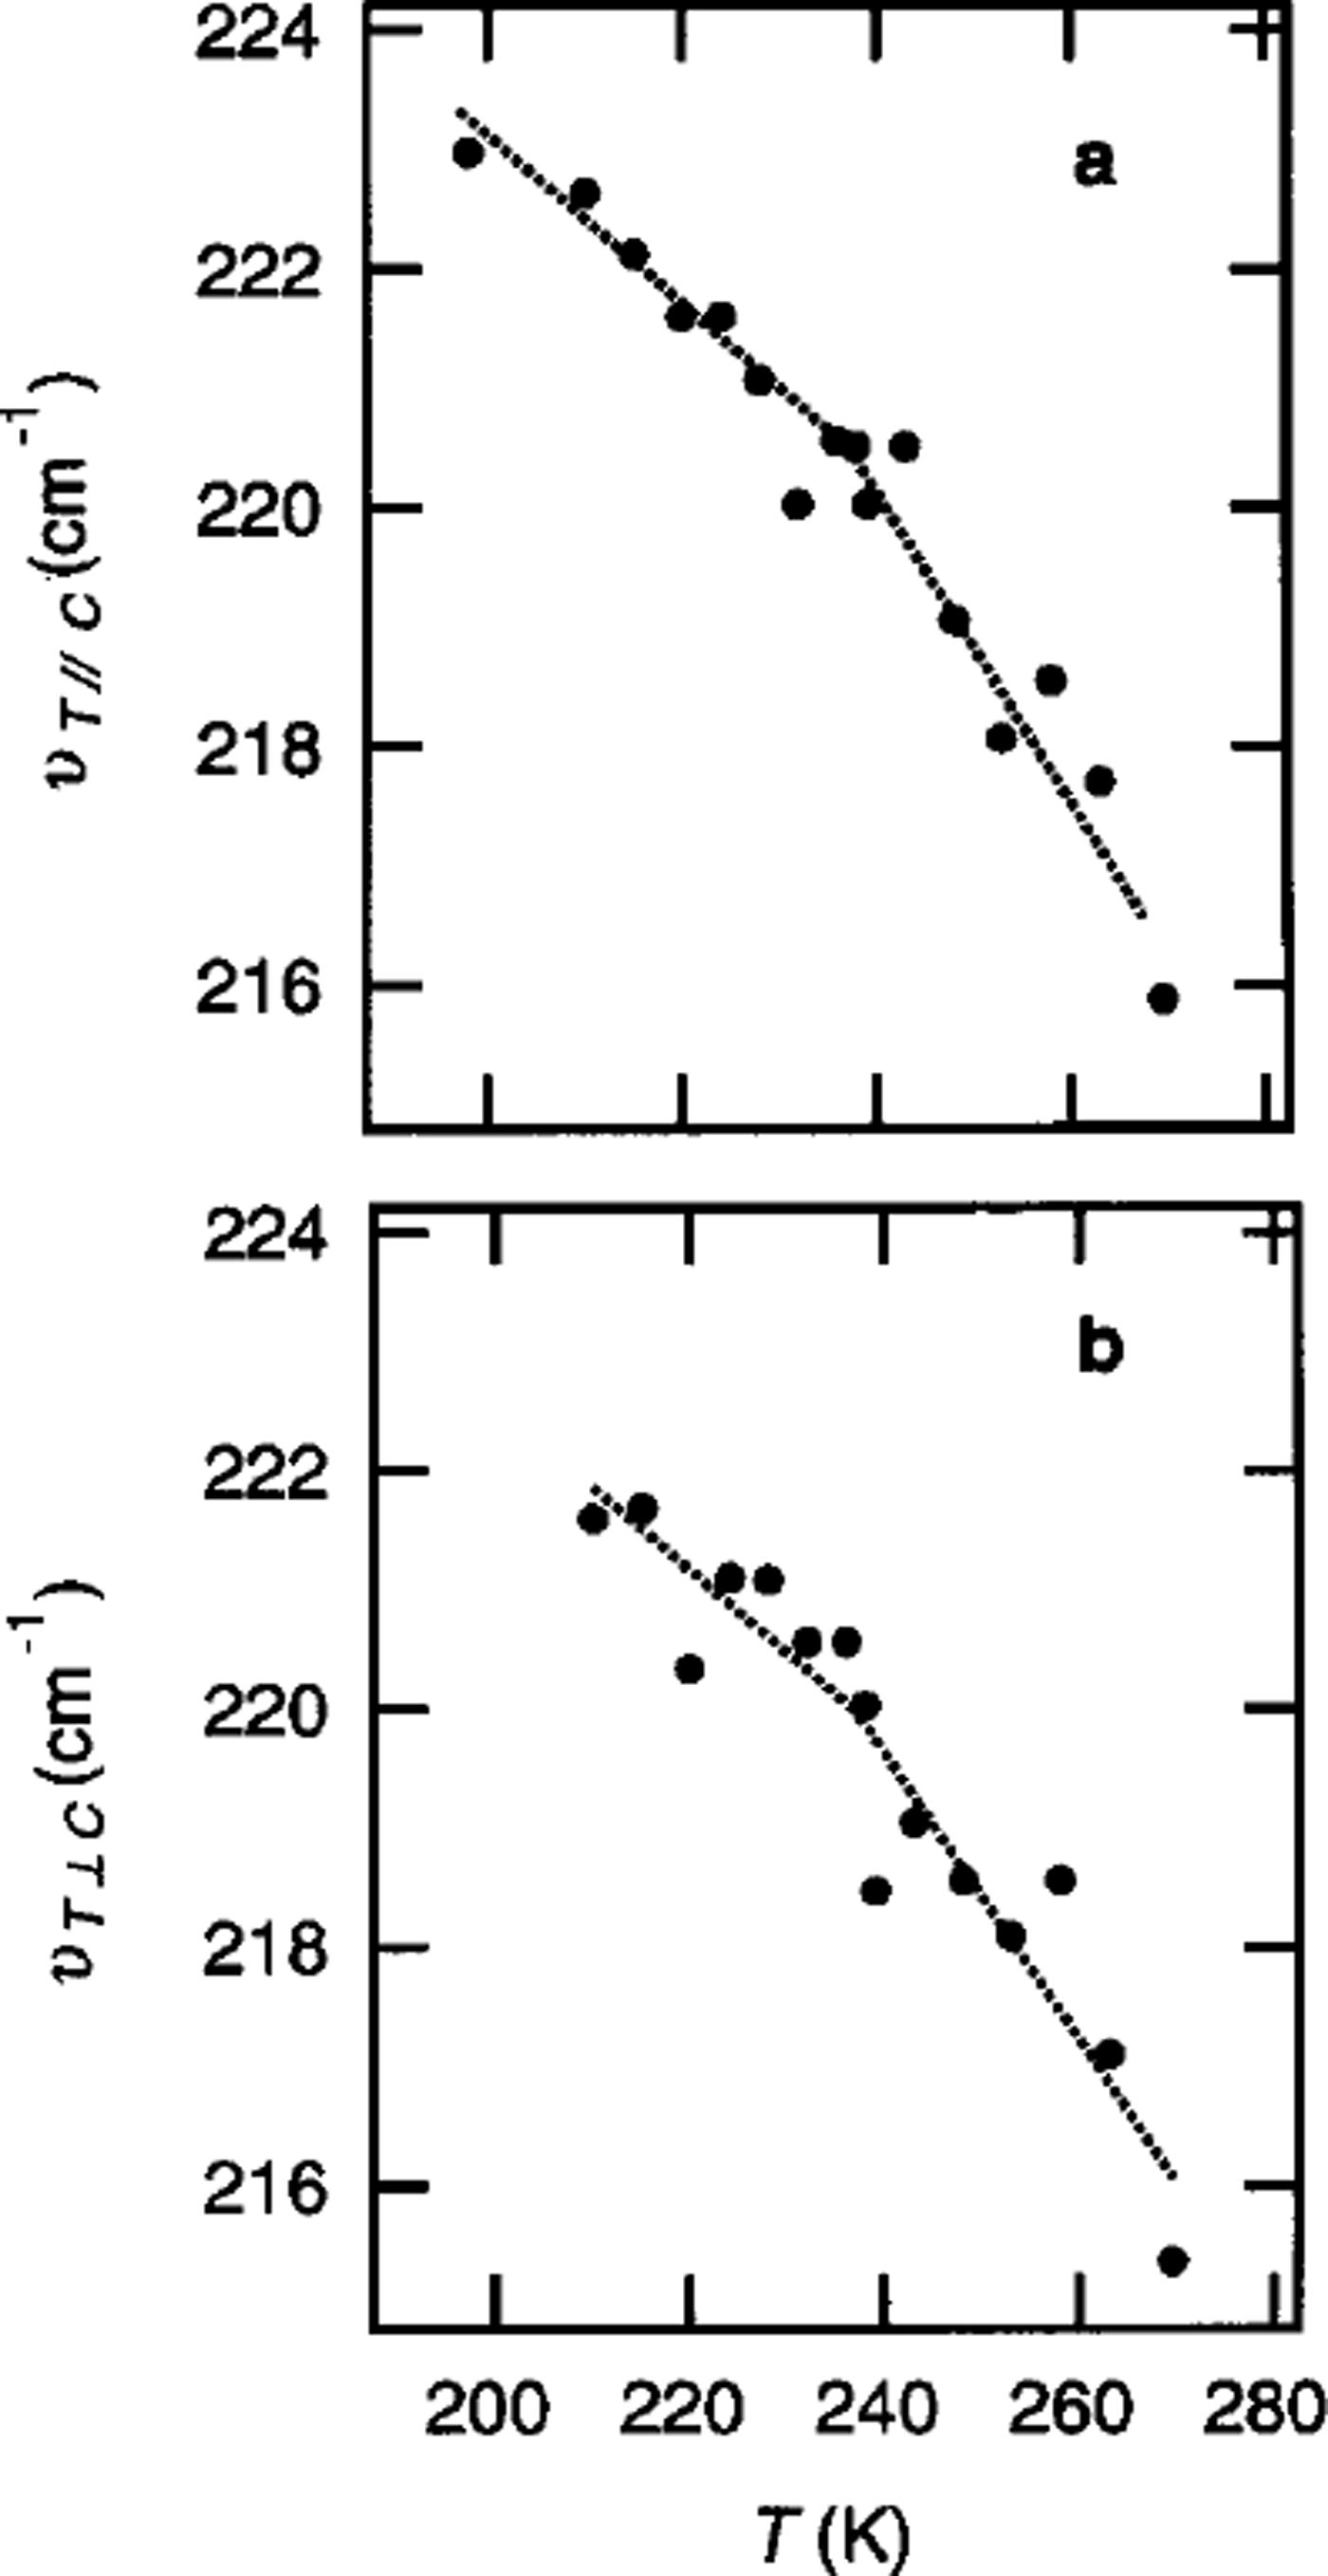
Fig. 3. The measurement-temperature (T) dependence of the frequency of translational lattice vibrations, vT, observed by Raman spectroscopy of the c axis parallel (a) and perpendicular ( b) to the polarization plane of the incident beam.
The intramolecular vibrations
Figure 4 shows typical spectra of ice Ih at measurement temperatures of 220, 239 and 253 K in the region of the O-H stretching vibrations (2800–3700 cm–1). The Raman spectra at 220 K have a large peak at 3125.05 cm–1. The peaks at 239 and 253 K are at 3131.70 and 3137.00 cm–1, respectively. Figure 5 shows the T dependence of voH∥c and vOH⊥c where v0wk and VOH⊥C represent the frequency of the peak of the O-H stretching vibrations, vOH, for the polarization planes parallel and perpendicular, respectively, to the c axis of ice Ih. Both vOH||C and VOH⊥c linearly increase with increases in T. The following relations (dotted lines in Fig. 5) were obtained:
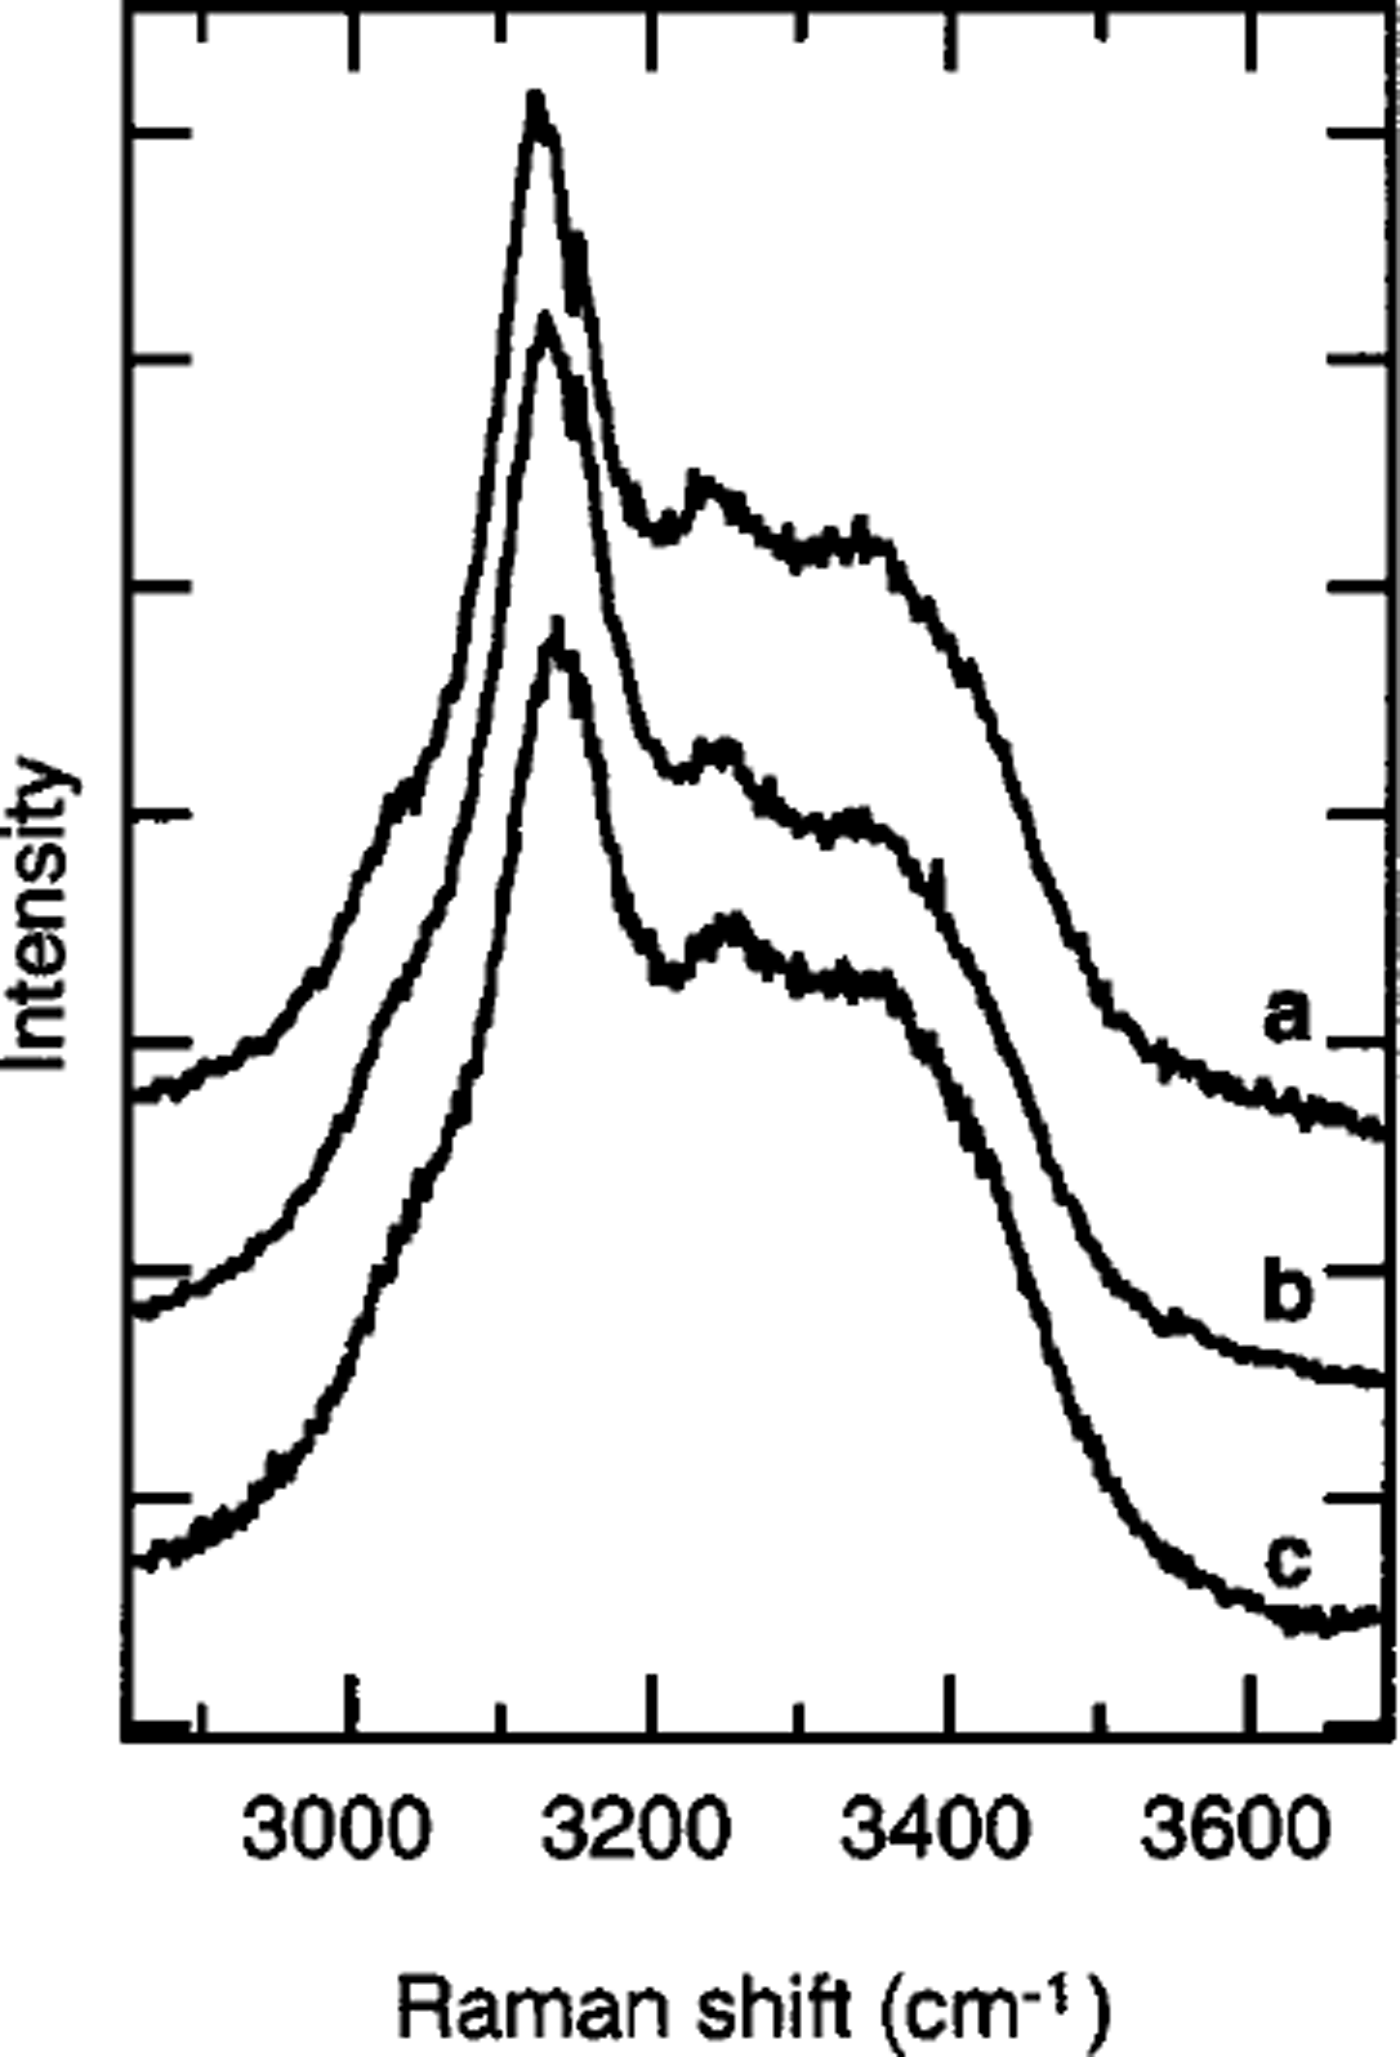
Fig. 4. Raman spectra of ice Ih in the region of O-H stretching vibrations (2800–3700 cm–1 ). Measurement temperatures: (a) 220 K, (b) 239 K and (c) 253K. The polarization plane of the incident beam was parallel to the c axis of the sample.
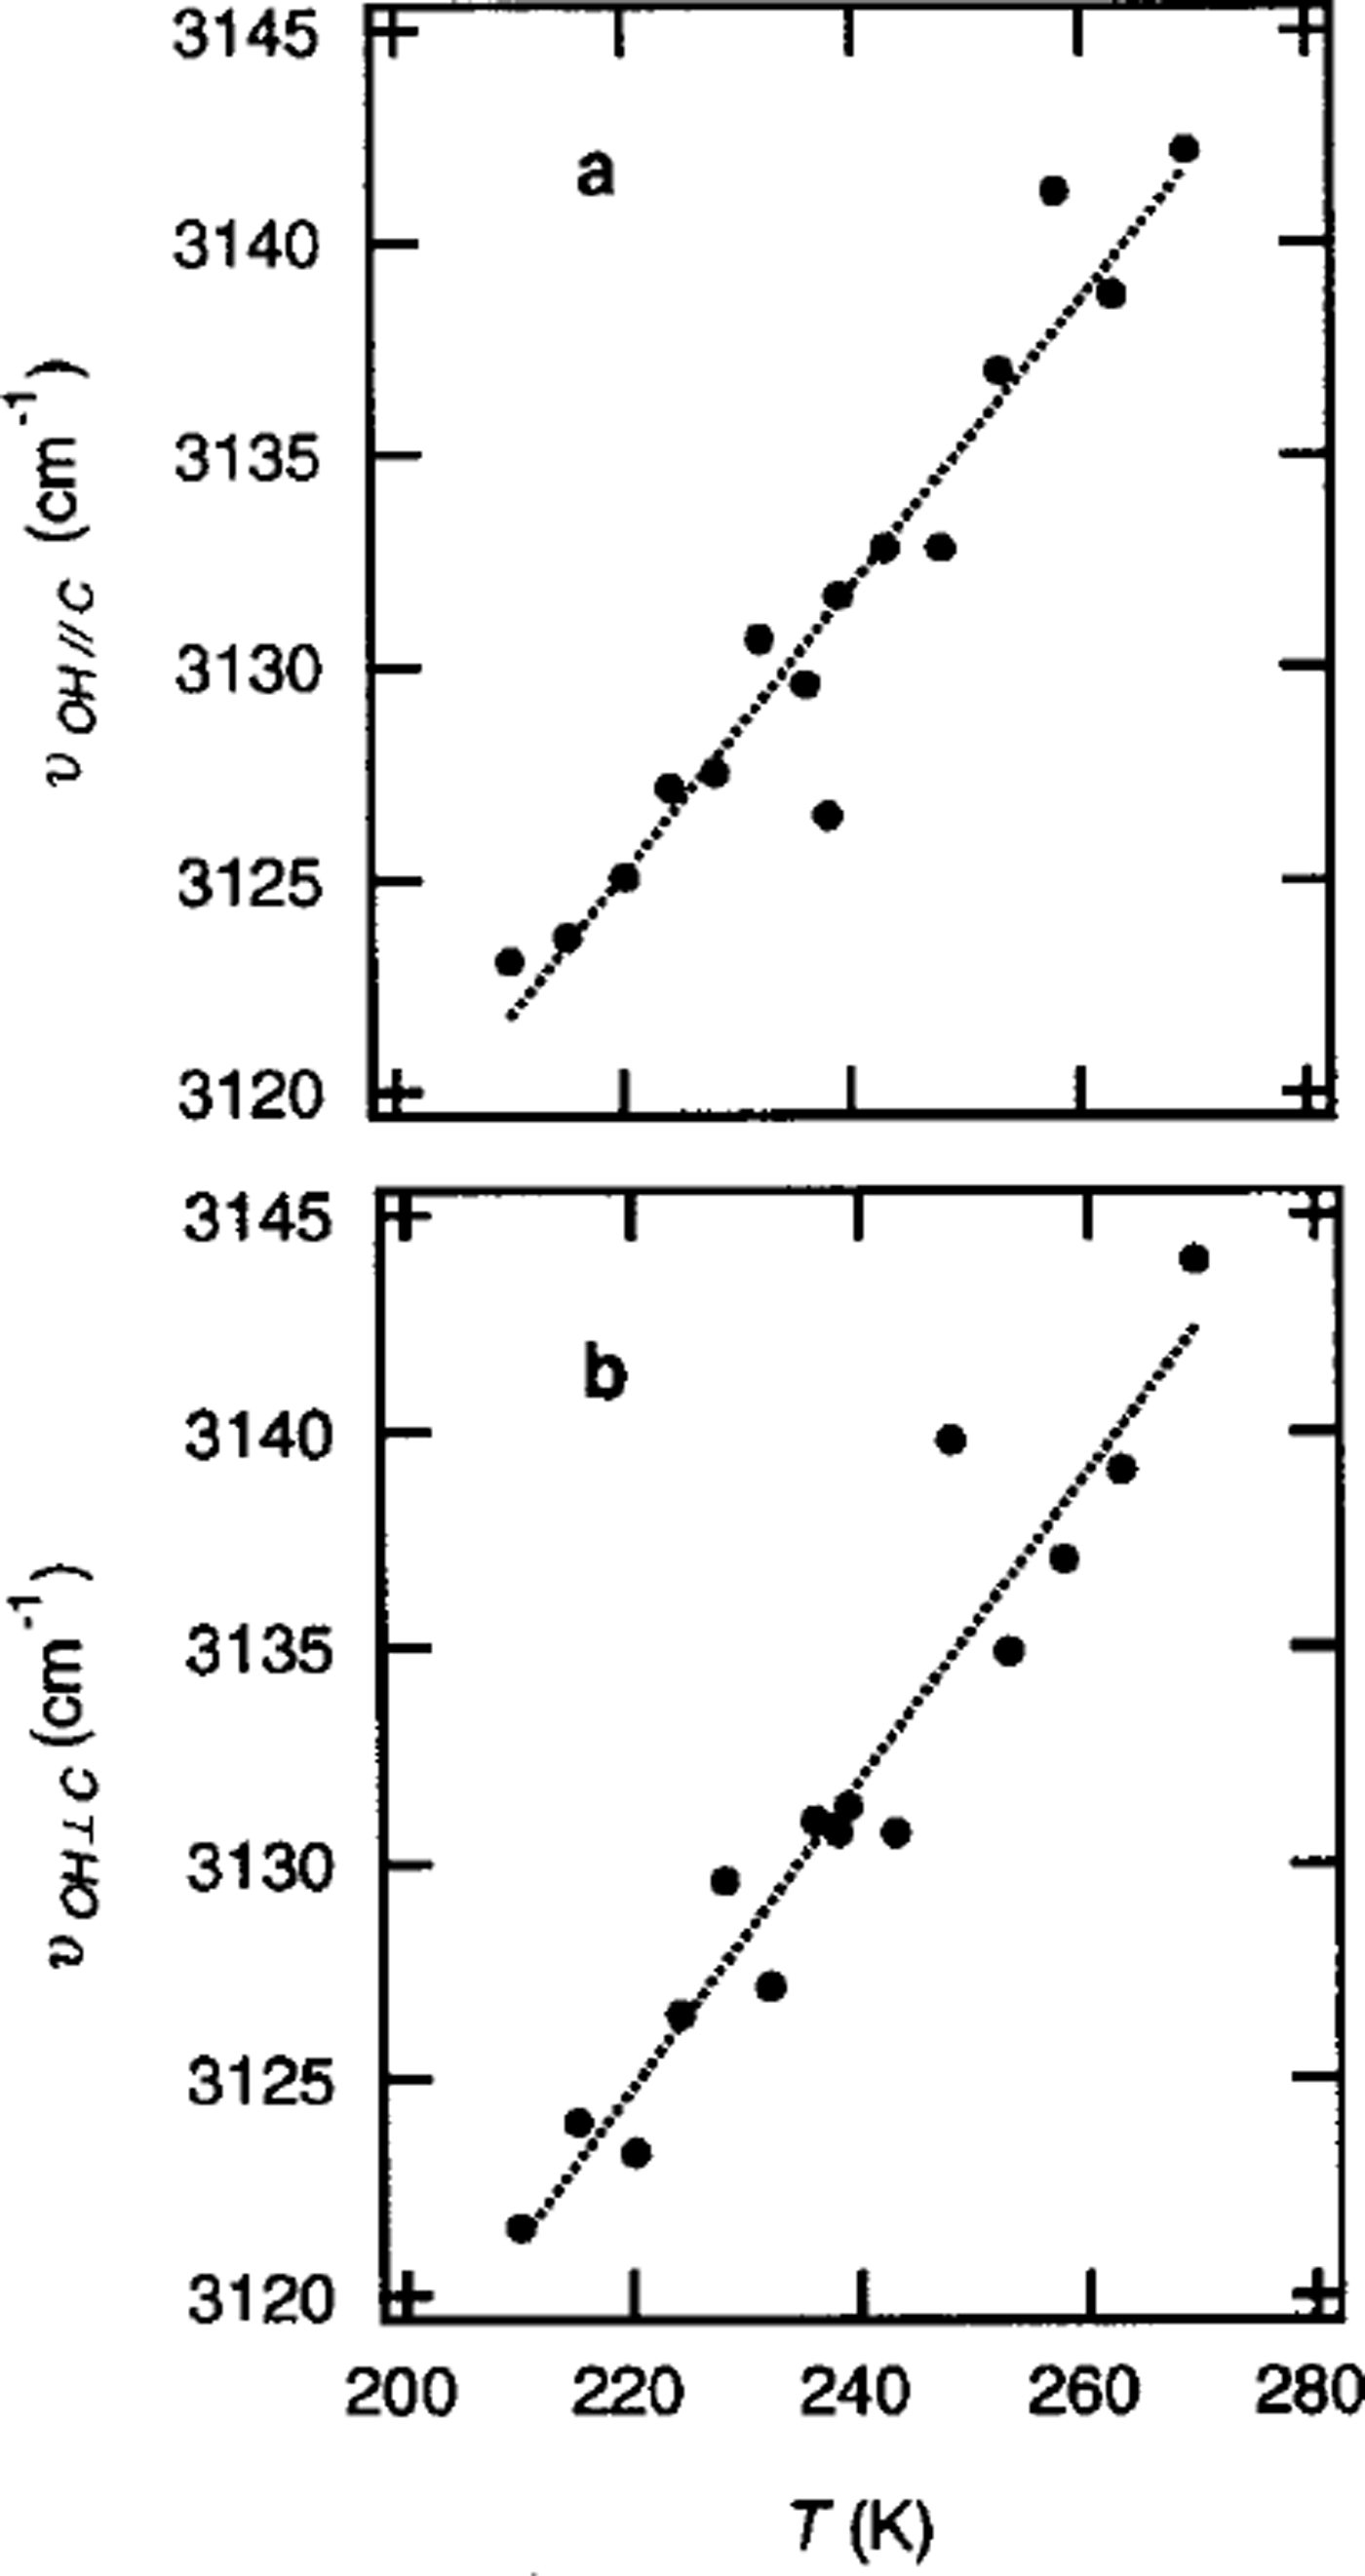
Fig. 5. The T dependence of the frequency of the peak of the 0–H stretching vibrations, vOH, observed by Raman spectroscopy of thee axis parallel (a) and perpendicular ( b) to the polarization plane of the incident beam.
The linear increase in vos is the same as the T dependence of V0H reported in Reference Wong and WhalleyWong and Whalley (1975).
Discussion
The neutron-diffraction profile of DF ice has the peak at 2.13 A (Fig. lc), which is not seen in the profile of ice Ih. This result shows that the structure of DF ice is clearly different from that of ice Ih with proton-disordered arrangement. Reference Line and WhitworthLine and Whitworth (1996) and Reference Jackson, Meld, Whitworth, Oguro and WilsonJackson and others (1997) reported that the profile of ice XI with proton-ordered arrangement has the peak at 2.13 A, and it is assigned to the 131 diffraction peak. Thus, it is considered that DF ice has the proton-ordered arrangement in ice XL The result is consistent with the proton ordering in Antarctic ice of Ti ≤ 237 K that is proposed in our previous papers (Reference Fukazawa, Mae, Ikeda and WatanabeFukazawa and others, 1998b, Reference Fukazawa, Mae, Ikeda and Lipenkov1999, in press). The neutron-diffraction profile of DF ice has the peak at 2.02 A (Fig. lb), which is not seen in the profile of ice Ih or ice XL This result implies that DF ice includes a proton arrangement which is different from that in ice Ih and ice XL In order to analyze the arrangement, we plan to measure the diffraction precisely.
The frequency of translational lattice vibrations in Raman spectrum is associated with the force constant between adjacent water molecules. Any change in frequency affects the dielectric properties of ice, which must be known in order to interpret radar remote-sensing data, as follows.
The discontinuous changes in v T∥c and vT⊥c at Tc are caused by a temperature effect at a constant volume, ∂vr/∂T)v , namely, non-linear effects in the displacement. The value of (∂vT /∂T)v is divided into the effect of T on vT at constant pressure, (∂vT /∂T)ρ, and the constant-temperature volume effect, (∂vT/∂P)T .Thus,
where a is the volume expansivity and /3 is the compressibility. The values of a and /3 in ice Ih are 155 M K–1 (Reference LaPlaca and PostLaPlaca and Post, 1960) and 12 Mbar–1 (Reference Gow and WilliamsonGow and Williamson, 1972), respectively, at about 255 K. Reference Johari, Chew and SivakumarJohari and others (1984) reported that (∂v T/∂P)T = 4.77 cm–1kbar–1. From Equations (1–4), we obtained values of (∂v T∥c /∂T)P = –0.13cm–1 K–1 6 1 and (∂v T⊥c /∂T)P = –0.12cm–1 K–1 for ≥Tc and (∂v T∥c /∂T)P = –0.07 cm–1K–1 and (∂v T⊥c /∂T)P = –0.12 cm–1K–1 for ≥Tc , where (∂v T∥c /∂T)P and (∂v T⊥c /∂T)P are the values of (∂v T/∂T)P for the polarization planes parallel and perpendicular, respectively, to the c axis of ice Ih. Substituting these values into Equation (7), we obtain:
where (∂v T∥c /∂T)V and (∂v T⊥c /∂T)V are values of (∂v T/∂T)V for the polarization planes parallel and perpendicular, respectively, to the c axis. The rates, (∂v T∥c /∂T V and (∂v T⊥c /∂T)V below 237 K are about 80% less than that above 237 K. The decrease at 237 K implies a decrease in the anharmonicity of the lattice vibrations, because (∂v T/∂T)V is due to the anharmonic term in the intermolecular potential Reference JohariJohari, 1981). Reference Sivakumar, Chew and JohariSivakumar and others (1978) estimated that the anharmonicity is mainly caused by the bending of O–H…O angles.
The decrease in anharmonicity of the lattice vibrations below 237 K is able to drive phase transitions. Thus, the temperature dependence of vT in ice Ih is consistent with the phase transition from a proton-disordered arrangement to a proton-ordered arrangement at Ti = 237 K in polar ice sheets, as proposed by Reference Fukazawa, Mae, Ikeda and WatanabeFukazawa and others (1998b). However, since the co-operative process of proton rearrangement at a low temperature is very slow (Reference Eisenberg and KauzmannEisenberg and Kauzmann, 1969), proton ordering requires a very long period. On the basis of results of extrapolation of the relaxational heat capacity of ice annealed for 624 hours, Reference SugaSuga (1985) roughly estimated that proton-ordering in ice Ih requires about 106 years. Therefore, the proton-ordered arrangement is not found in ice Ih, but polar ice which has been kept for a long period at a constant temperature of < 237 K contains the proton-ordered arrangement.
Reference Matsuoka, Mae, Fukazawa, Fujita and WatanabeMatsuoka and others (1998) precisely measured Raman spectra of translational lattice vibrations and the dielectric constant of DF ice (at 350 m depth) in the temperature range 210–260 K. They found that the temperature dependence of translational lattice vibrations discontinuously changes at about 237 K, and the dependence is approximately the same as that of ice Ih: for T ≥ 238 K, (∂v/∂T)p = –0.136 cm"1 K–1, and for T 238 K, (∂v/∂T) –0.082 cm"1 K–1. Furthermore, the temperature dependence of the dielectric constant discontinuously changes at about 237 K. Analysis of the temperature dependence using the Kramers-Kronig relation showed that this change is caused by a change in temperature dependence of vT in DF ice. This finding suggests that one of the two potential minima of protons is lowered at temperatures below Tc. Thus the discontinuous change in vT at Tc affects the dielectric properties of polar ice at microwave frequencies.
The intensity of the peak in translational lattice vibrations in Raman spectrum is due to the arrangements of oxygen nuclei and protons (Reference Fukazawa, Mae, Ikeda and WatanabeFukazawa and others, 1998b). As shown in Figure 2, the ratio of peak intensities at 300 and 220 cm–1, IR, in ice Ih remains constant at about 0.36 and is independent of the measurement temperatures. Since the value of 7R depends on the ratio of the proton-ordered arrangement to the disordered arrangement in ice, the constant values show that the protons in ice Ih are disordered regardless of the measurement temperature. For polar ice, 7R depends on 7] in the ice sheet, as shown in Figure 6a (Reference Fukazawa, Mae, Ikeda and WatanabeFukazawa and others, 1998b). The values of the ratio of ordered protons in polar ice,
η, calculated from the 7R in the polar ice (Fig. 6b), are in good agreement with the relation between temperature and η obtained from the Landau theory of the second-order phase transition (Reference Landau and LifshitzLandau and Lifshitz, 1959):
![]() for Ti
≥ Tc
and η = 0 for 7] ≥ Tc, where Tc
= 237 K, while the value of η in ice Ih is 0. These results are consistent with the hypothesis that proton ordering in ice requires a very long period of time to be realized.
for Ti
≥ Tc
and η = 0 for 7] ≥ Tc, where Tc
= 237 K, while the value of η in ice Ih is 0. These results are consistent with the hypothesis that proton ordering in ice requires a very long period of time to be realized.
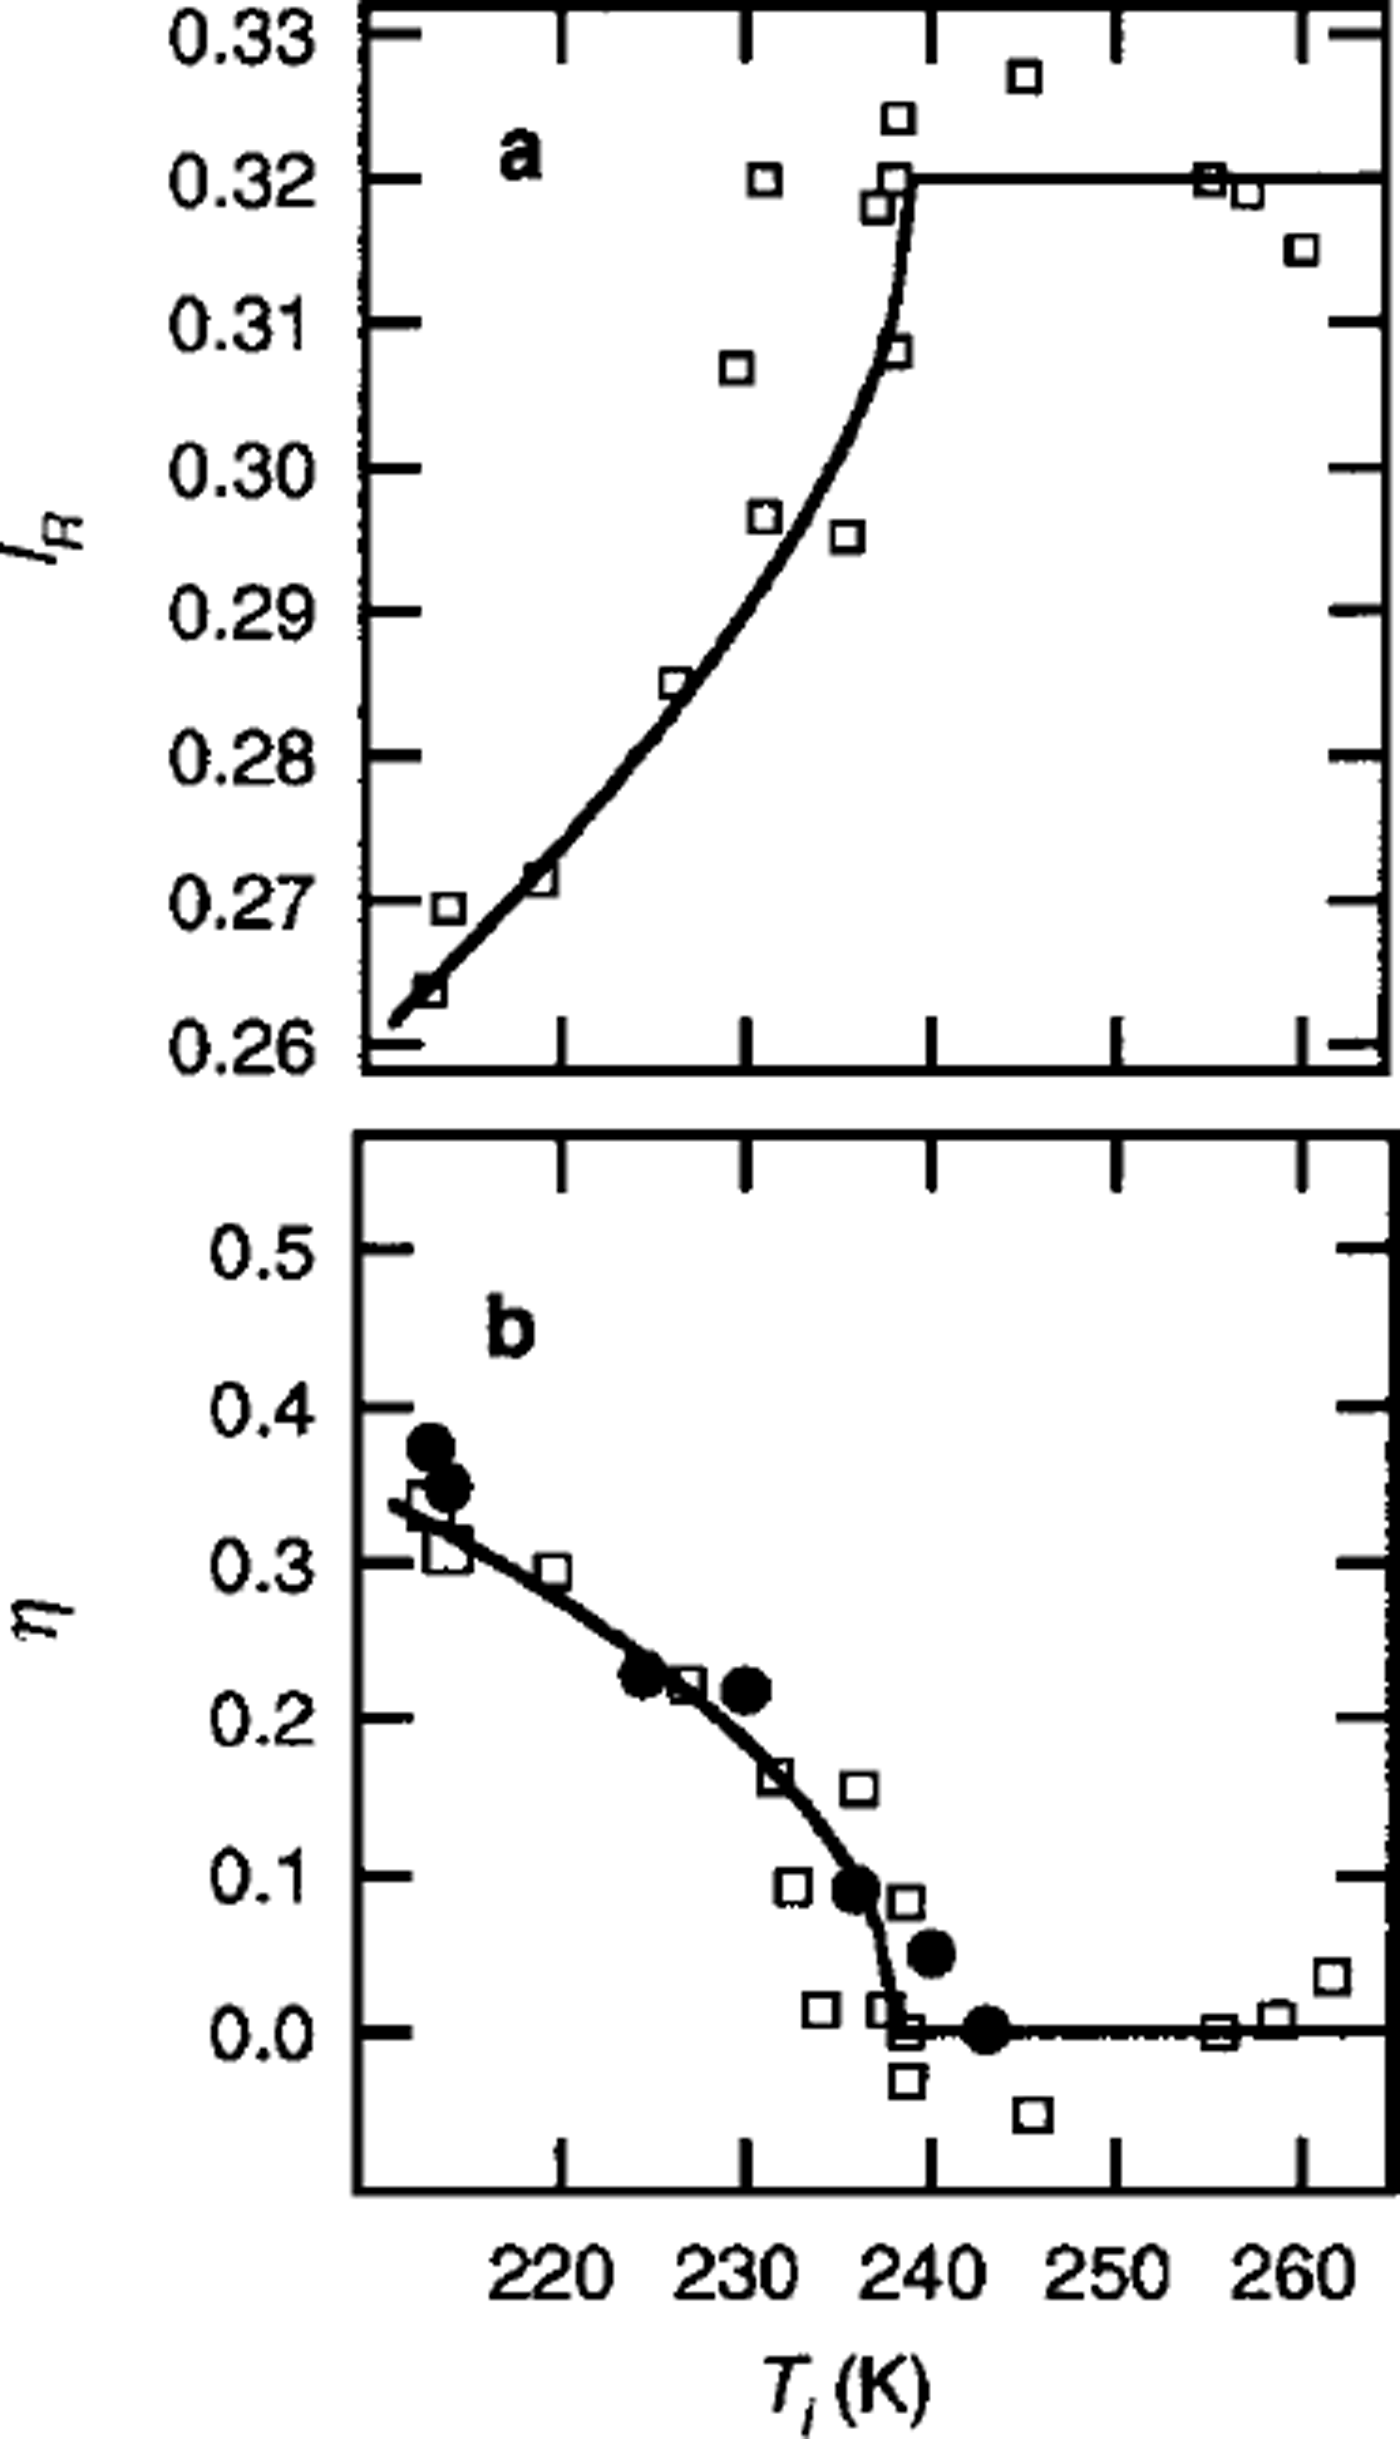
Fig. 6. (a) The 7] dependence of IR6 in Antarctic and Greenland ice (Reference Fukazawa, Mae, Ikeda and WatanabeFukazawa and others, 1998b). (b) The Ti dependence of η in DF ice (filled circles), determined by IIJVS measurements (Fukazawa and others, in press). The open squares represent values of η in Antarctic and Greenland ice, which were obtained by analyses of Raman spectra (Reference Fukazawa, Mae, Ikeda and WatanabeFukazawa and others, 1998b). The solid line shows
![]() Ti ≤ Tc and η=0 for Ti ≥ Tc where Tc = 237 K.
Ti ≤ Tc and η=0 for Ti ≥ Tc where Tc = 237 K.
Polar ice in an area where 71 ≤ 237 K contains the proton-ordered arrangement. At DF station in inland Antarctica, there is a large proton-ordered ice mass from the surface to about 2000 m depth, where 7] ≤ 237 K. The thickness of this layer is more than half that of the total ice thickness, which was calculated by radio-echo sounding to be about 3060 m. Reference Goodman, Frost and AshbyGoodman and others (1981) reported that proton rearrangement controls the glide of ice. Since the proton rearrangement in proton-ordered ice is extremely slow, it is thought that flow abihty of ice discontinuously changes at about 2000 m depth. Mizuho station is located at the boundary between the proton-ordered and –disordered ice areas. Ice between Mizuho station and the coast has the proton-disordered arrangement because 7] ≥ 237 K. In Greenland, 7] ≥ 237 K in most of the ice sheet.
Based on the results of proton ordering in Antarctic ice, Reference Fukazawa, Mae, Ikeda and WatanabeFukazawa and others (1998b) estimated that ice slowly grown from vapor at temperatures of ≤ 237K has the proton-ordered arrangement because the ice is in thermodynamic equilibrium. Reference Su, Lianos, Shen and SomorjaiSu and others (1998) measured the sum-frequency vibrational spectra of ice grown from vapor at about 140 K and found proton ordering in thin layers of the ice. Reference IedemaIedema and others (1998) also found the proton ordering in ice grown from vapor at temperatures of 40–150 K. The results of these recent works imply that ice grown from vapor in the Earth’s ozone layer and atmospheric aerosol over Antarctica have the proton-ordered arrangement.
These temperatures at which the proton-ordered arrangement in ice was found are higher than the transition temperatures of 72 K in KOH-doped ice. The analyses, which explain the phase transition and the high transition temperatures, are very important for understanding the hydrogen bond of ice, but the complete picture is not clear at present. In order to obtain direct evidence for the proton ordering in ice, the determination of proton arrangements in ice, by single-crystal neutron-diffraction, is important.
Acknowledgements
We are grateful to T. Kamiyama and K. Mori for their assistance with the instrument at the KEK. One of the authors, H.F., has been supported by a Research Fellowship of the Japan Society for the Promotion of Science for Young Scientists.


