INTRODUCTION
Snow containing gaseous and particulate aerosols from various sources is deposited on the ice-sheet surface to form layers within the ice sheet. As a consequence, cores drilled through the ice sheet contain an archive of palaeoclimatic and palaeoenvironmental information. This information is detected as both physical and chemical signals. Since the high inland plateau of the Antarctic ice sheet is isolated by distance from local aerosol sources, chemical signals detected in the ice cores are considered to be indicative of the global environment. On the other hand, the physical signals are affected by local environment, including temperature and snow-accumulation rate.
Dome Fuji station (77°19′01″S, 39° 42′12″ E; 3810 m a.s.l.) is located about 1000 km from the coast at the highest point on the high plateau of east Dronning Maud Land, East Antarctica. In 1993, a shallow ice core of 112.59 m depth was drilled at the station using a dry-hole electromechanical drill. This pilot hole was cased to 80 m depth. In 1995 and 1996, two overwintering parties then drilled to 2503.52 m depth using an electromechanical drilling system in a liquid-filled hole. An ice core was collected throughout this depth. Ice-core analyses were carried out, and the preliminary results are presented here together with results of related glaciological and meteorological research.
METEOROLOGICAL AND GLACIOLOGICAL MEASUREMENTS AT DOME FUJI STATION
On 11 February 1995, the 36th Japanese Antarctic Research Expedition (JARE-36) commenced overwintering meteorological and glaciological observations at Dome Fuji station. Data on atmospheric pressure, air temperature, wind direction, wind speed and global solar radiation were automatically recorded (Japan Meteorological Agency, 1997; Yoshimi and others, 1997). From March 1995 to February 1996, an annual mean air temperature of −53.9°C at 1.5 m height was recorded. The lowest temperature for this period, −79.7°C, occurred on 14 May 1996. Annual mean atmospheric pressure was 598.2 h Pa, and annual mean wind speed at 10 m height was 5.8 m s−1. The wind direction sometimes rotated counter-clockwise, and no prevailing wind direction was observed. The most frequent wind direction was northeasterly (in a 16-direction system), but this accounts for only 15% of the total. Annual mean cloud cover was about 40%. Ice prisms (diamond dust) were observed nearly every day.
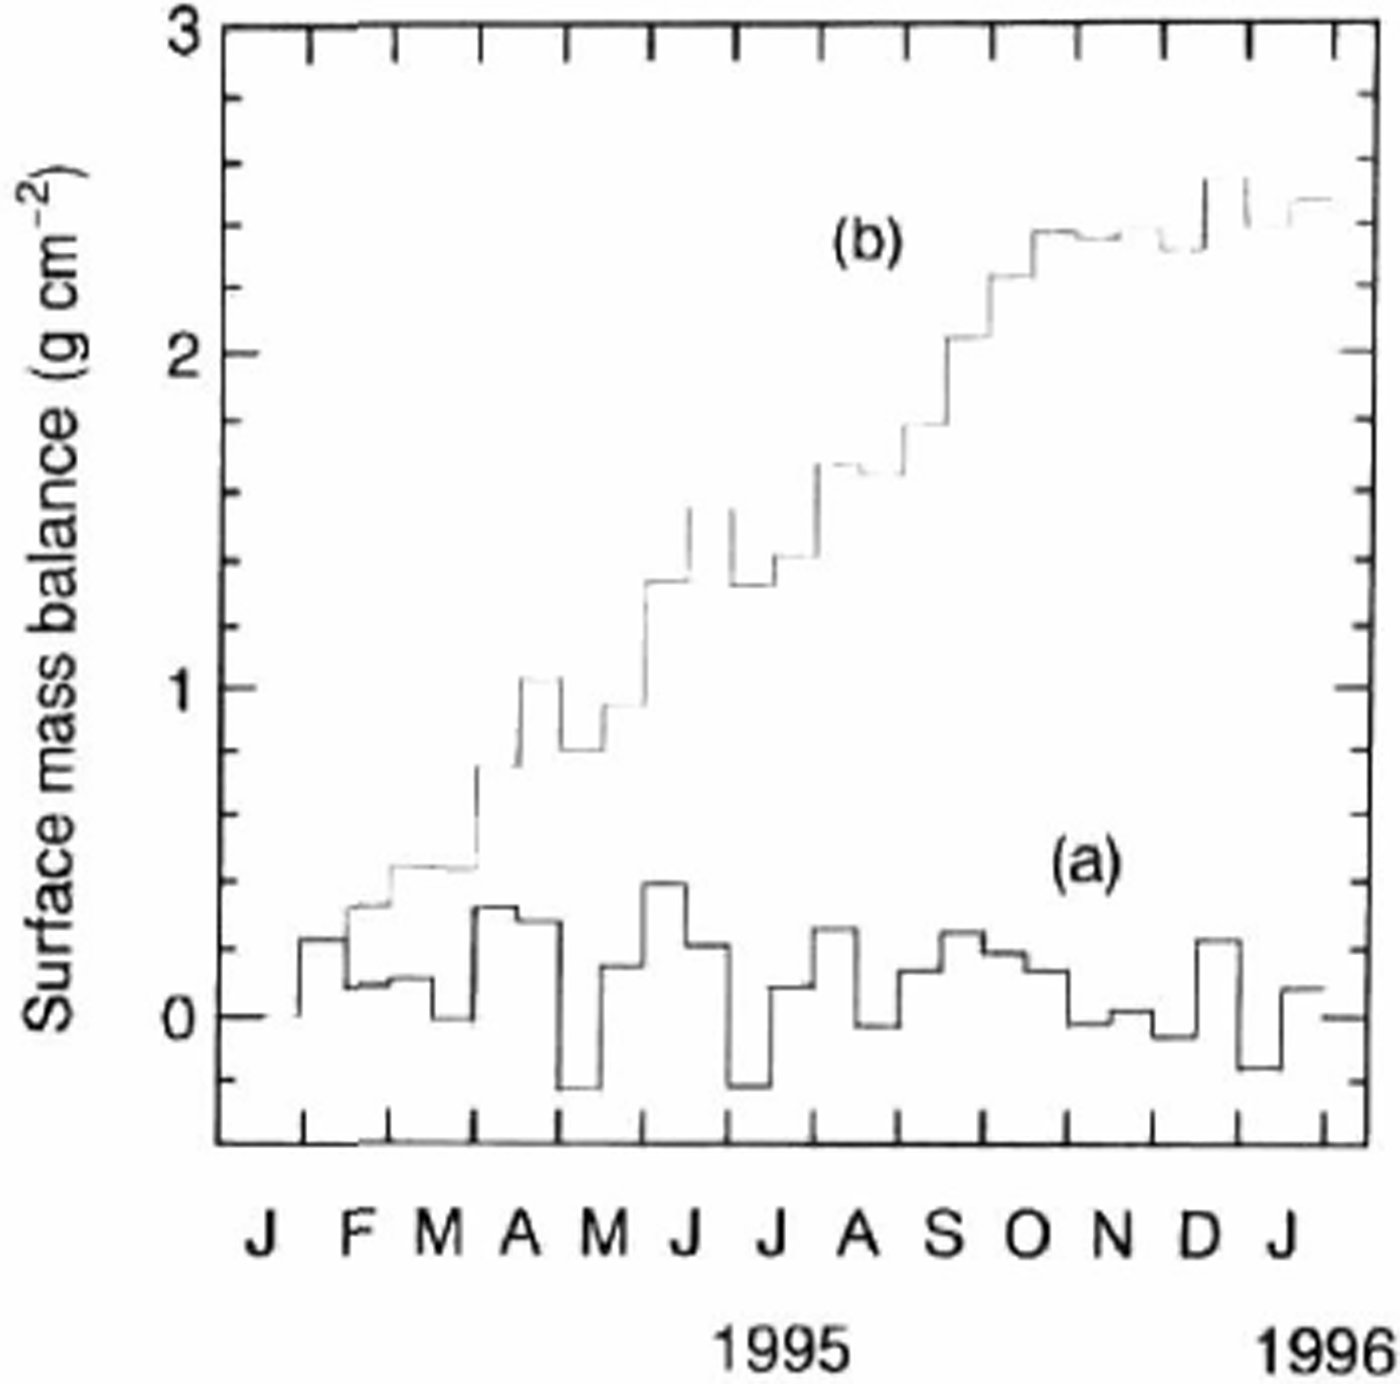
Fig. 1. Observations of surface mass balance (utilising a farm of 36 snow stakes) at Dome Fuji station from 25 January 1995 to 31 January 1996. The thick histogram (a) shows average surface mass balance for each 15–16 day period, and the thin histogram (b) shows cumulative surface mass balance, obtained by integration of histogram (a).
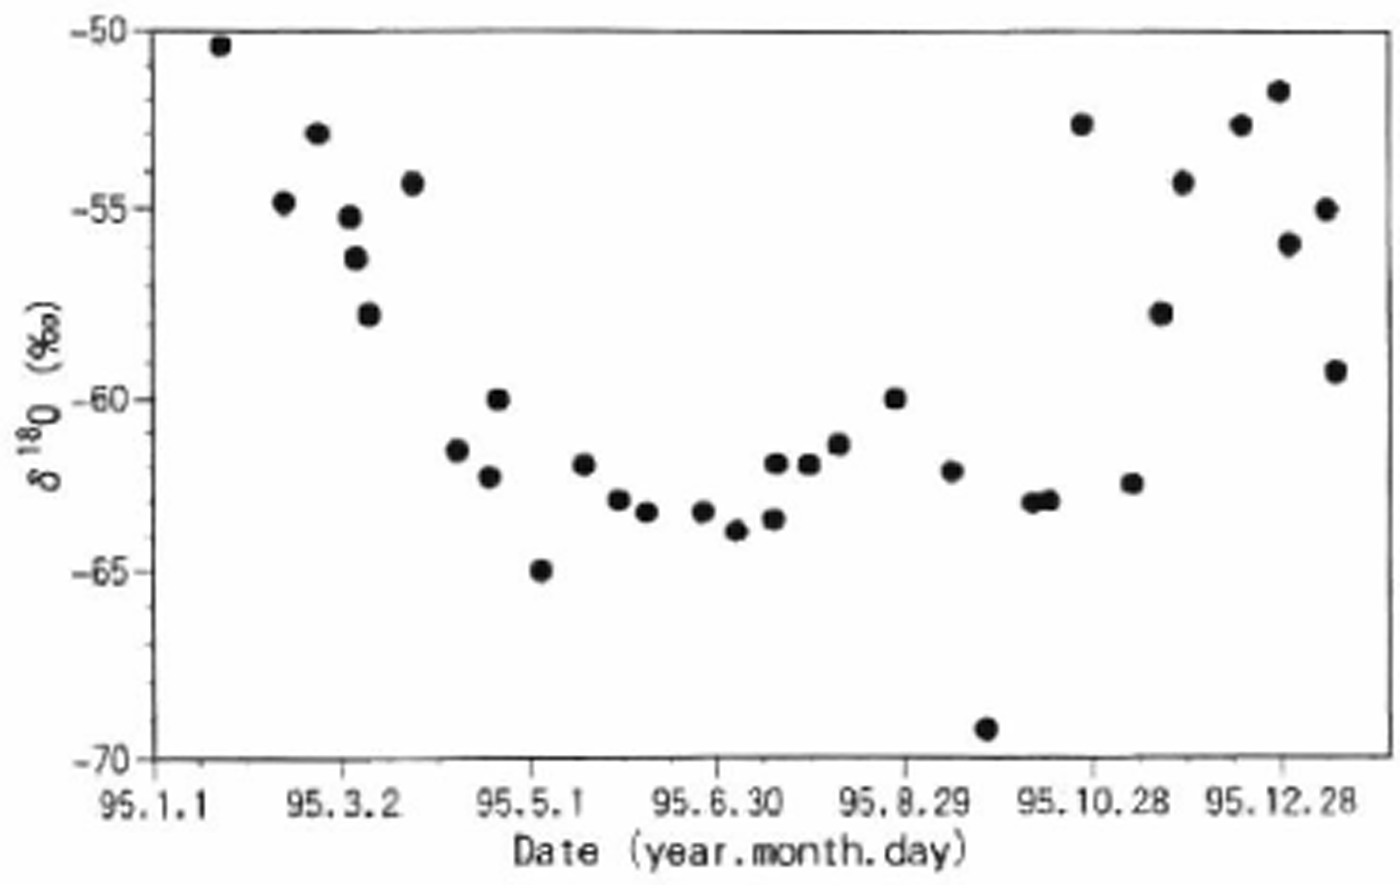
Fig. 2. Seasonal distribution of δ 18 O at Dome Fuji station in 1995.
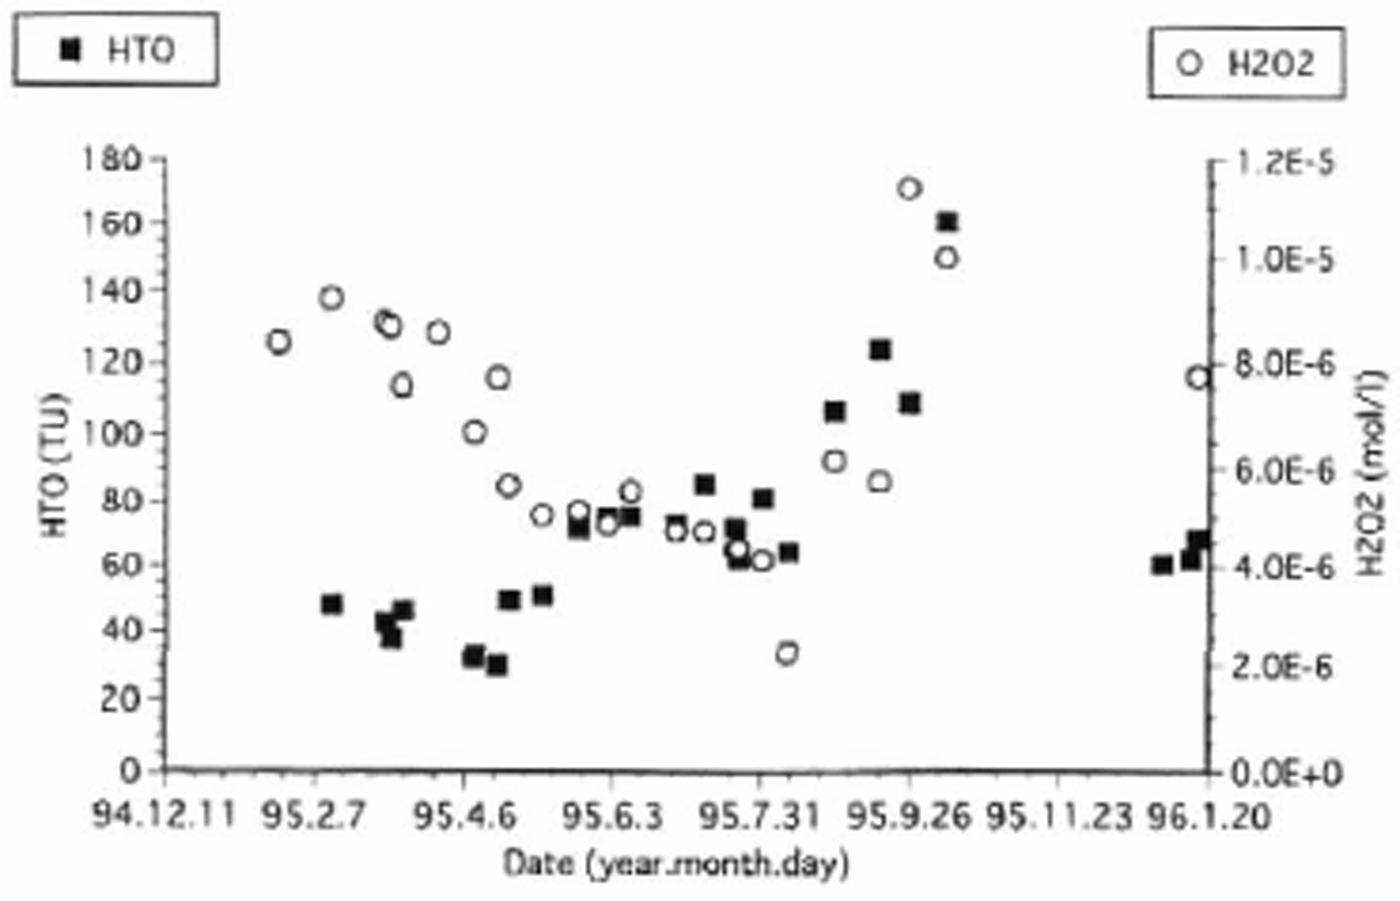
Fig. 3. Seasonal distribution of H 2 O 2 and HTO at Dome Fuji station in 1995.
Glaciological observations of surface mass balance (utilising a farm of 36 snow stakes), sublimation at the snow surface, and snow temperatures from the surface to 10 m depth were carried out (Reference Kameda, Azuma, Furukawa, Ageta and TakahashiKameda and others, 1997). The average surface mass balance at Dome Fuji station is shown in Figure 1. The thick histogram (a) shows average surface mass balance for each 15–16 day period, and the thin histogram (b) shows cumulative surface mass balance, obtained by integration of histogram (a). It was found for the measurement period 25 January 1995 to 31 January 1996 that the annual surface mass balance was 2.5 ± 1.0 g cm−2 a−1. More than 95% of the surface mass balance (2.4 g cm−2) was accounted for by the period February—mid-October. The surface mass balance for the rest of the year was reduced (0.1 g cm−2 for the period mid-October. January) due to strong sublimation during the austral summer months. In total during 1995, the sublimation process subtracted ∼6% (0.16 g cm−2 a−1) from the surface mass balance. Measurements of vertical distribution of snow temperature through 1995 revealed an average 10 m temperature of −57.3°C.
DISTRIBUTION OF OXYGEN ISOTOPE RATIO AND CONCENTRATION OF CHEMICAL CONSTITUENTS IN SURFACE SNOW
The seasonal distribution of δ 18O in the surface snow at Dome Fuji is in the range −50‰ to 65‰, increasing in summer and decreasing in winter, as shown in Figure 2. Some of the chemical constituents (tritium (HTO), K, Ca, F, Cl and SO4) increased in concentration in early summer and decreased in early winter. Others (H2O2, methane sulphonic acid (MSA), CH3COO, HCOO, NO3, Mg and NH4) also increased in concentration in early summer and late autumn, but decreased in late summer and winter. Plots of HTO and H2O2 concentration are shown in Figure 3. Atmospheric circulation and chemical reactions in the atmosphere affect the seasonal fluctuations of chemical concentrations in snow. For example, it is considered that HTO is transported only in the stratosphere, while H2O2 is transported in the stratosphere and increasingly in the troposphere during late autumn. Detailed information is needed on the seasonal fluctuations reflected by the transportation and chemical reaction processes in the atmosphere for comparison with data from the Arctic (Reference BeerBeer and others, 1991).

Fig. 4. Concentrations of major chemical impurities in the surface snow layers at Dome Fuji station.

Fig. 5. Preliminary profile of δ 18 O of Dome Fuji deep core. Data plotted at 5 m intervals to a depth of 2000 m.
Stratigraphic observations, density measurements and snow sampling for chemical analyses were conducted in 2–3 m deep snow pits four times during 1995. A distinct structure consisting of stratified layers composed of alternate hard-packed and loose snow is observed in the deposited snow at Dome Fuji Station. The hard layers are composed of a mixture of compacted snow and hard-type depth hoar. The loose layers are skeleton-type depth hoar. Variations in the concentrations of major chemical constituents in the surface layers are shown in Figure 4. These may suggest the occurrence of migration processes in the snowpack.
LABORATORY ANALYSES OF ICE CORES
The whole of the top 112.59 m of the Dome Fuji ice core obtained in 1993 by dry-hole electromechanical drilling is available for laboratory analysis in Japan. Ice core to a depth of 2503.52 m was obtained in 1995 and 1996 using an electromechanical drill in a liquid-filled borehole. This ice core (i.e. the material deeper than 112.59 m) was divided in the field, vertically into 40% and 60% (cross-sectional area) sections. The sections comprising 40% of the core were transported to Japan in 1995 and 1996 for laboratory analysis. The other sections remain at Dome Fuji station.
Oxygen isotope ratio
Stable-isotope ratios of oxygen and hydrogen were determined from 50 cm long samples (so-called bag samples). For some selected core sections, more detailed sampling was carried out. Samples weighing 25–35 g were cut with a band-saw and washed to reduce contamination from drilling fluid (n-butyl acetate).
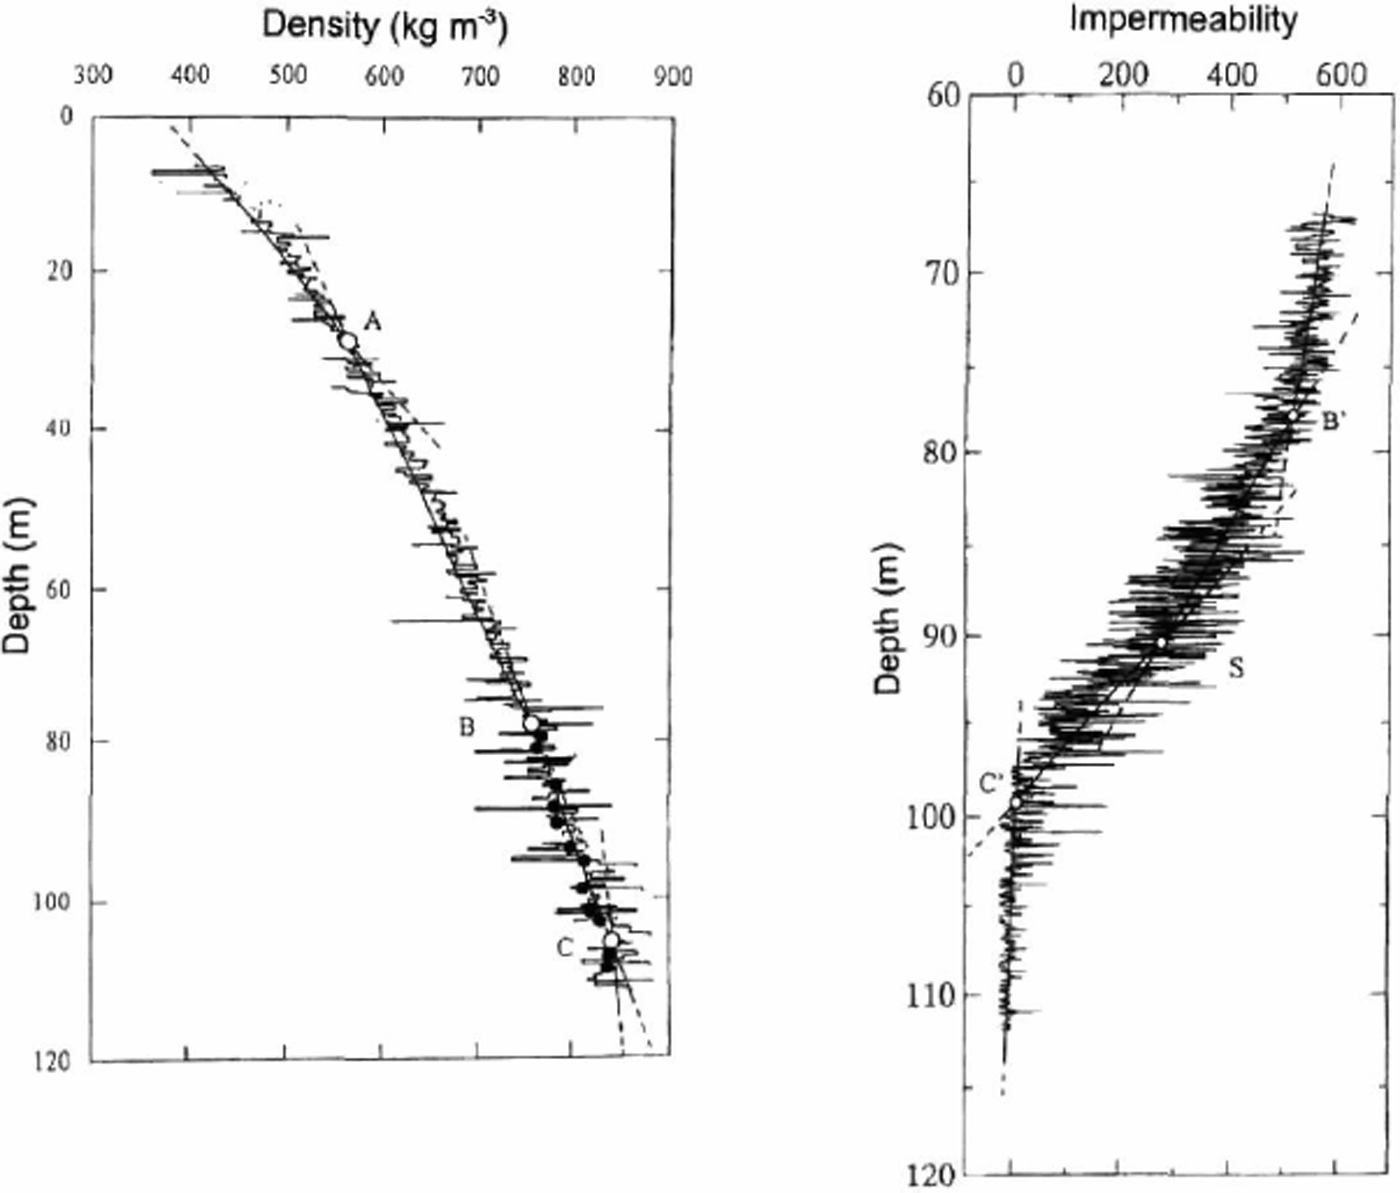
Fig. 6. Vertical profiles of impermeability and bulk density at Dome Fuji station. Bulk density profile is divided at transition depths, A, B and C. The depths and bulk densities are A (28 m, 560 kg m −3 ), B (77 m, 740 kg m −3 ) and C (106 m, 840 kg m −3 ). B′ and C′ in the impermeability profile correspond roughly to B and C. Bubble close-off begins at about 90 m depth (S) and close-off is complete at depth C′ (98 m).
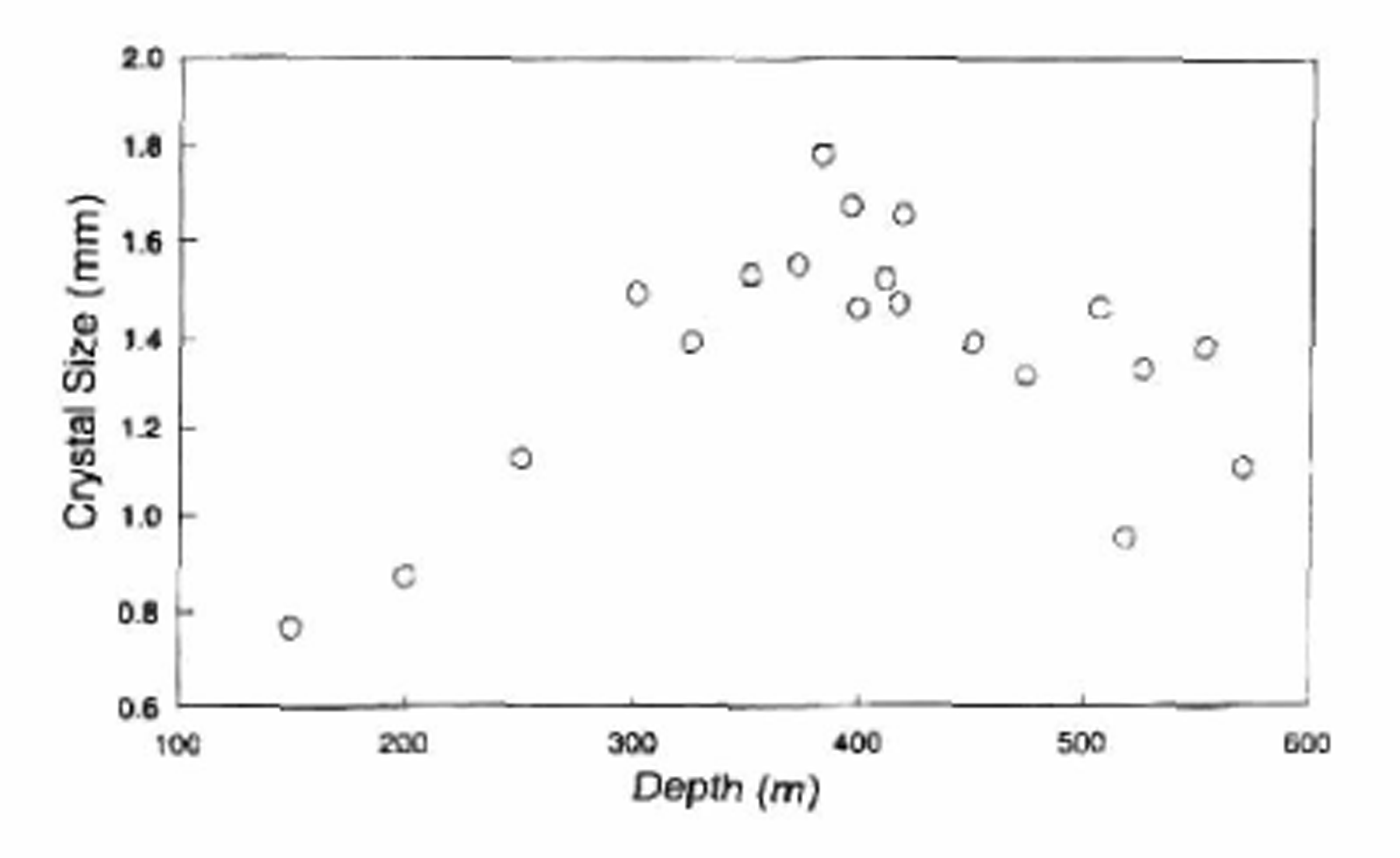
Fig. 7. Vertical profile of crystal size at Dome Fuji station.
The standard CO2 equilibrium method was employed for δ 18O analysis, normally using 5 ml water samples and two sets of secondary working standards for each batch of samples. The routine measurement accuracy is ± 0.1‰.
A preliminary plot of δ 18O as a function of depth to a depth of 2000 m is shown in Figure 5. The transition from ice deposited during the Wisconsin period to that deposited during the Holocene occurs at 350–550 m depth. The Wisconsin/Eemian transition is located at 1600–1750 m depth.
Density, permeability and crystal size
The depth profiles of density and air permeability for the Dome Fuji core are shown in Figure 6. Density increases gradually with depth, and air bubbles are completely closed at a depth of 98 m (Reference WatanabeWatanabe and others, 1997). Crystal size increases with depth down to 350–400 m. and then decreases from 400 to 600 m, as shown in Figure 7. The depth at which the change from increasing to decreasing crystal size occurs coincides approximately with the transition from Holocene to Wisconsin ice.
Chemical constituents
The chemical constituents of the core samples were measured by ion chromatography. Ions measured include cations (NH4, Na, K, Mg and Ca) and anions with weak acidic components (F, Cl, SO4, NO2, NO3, HCOO, CH3COO, C2O2, MSA). The profiles of the major components of sea salts (Na, Cl) and ions of secondary origin (MSA) are shown in Figure 8. There are large environmental changes evident between the glacial and interglacial periods.
ICE-CORE CHRONOLOGY
The net snow-accumulation rate at Dome Fuji station was estimated by three different methods: the snow stake method, fission-product tracer analysis and electrical conductivity measurement (ECM). Profiles of HTO and gross β activity are shown in Figure 9. Volcanic eruption events occurring at known times are indicated by increased ECM values as shown in Figure 10. Each of these methods suggests a similar accumulation rate of ∼30 mm w.e.a−1 for the Holocene period. This estimate is compatible with the Holocene/Wisconsin transition depth provided by the δ 18O data.
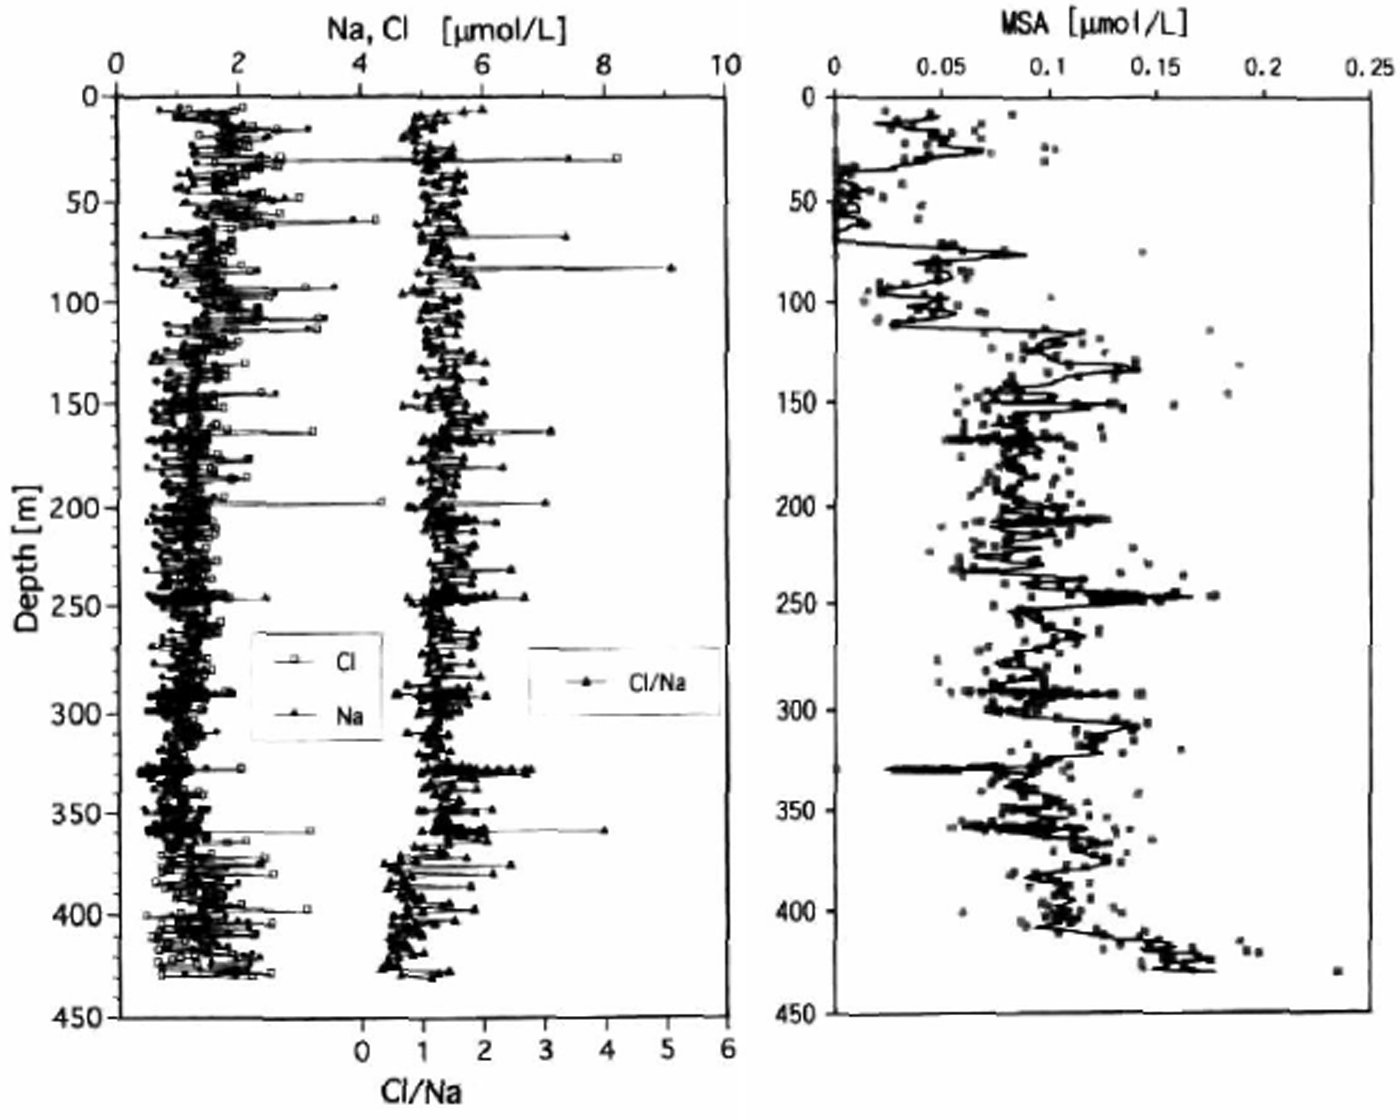
Fig. 8. Vertical profiles of major components of sea salts (Na, Cl) and ions of secondary origin (MSA).

Fig. 9. Vertical profiles of HTO and gross β activity at Dome Camp near Dome Fuji station.
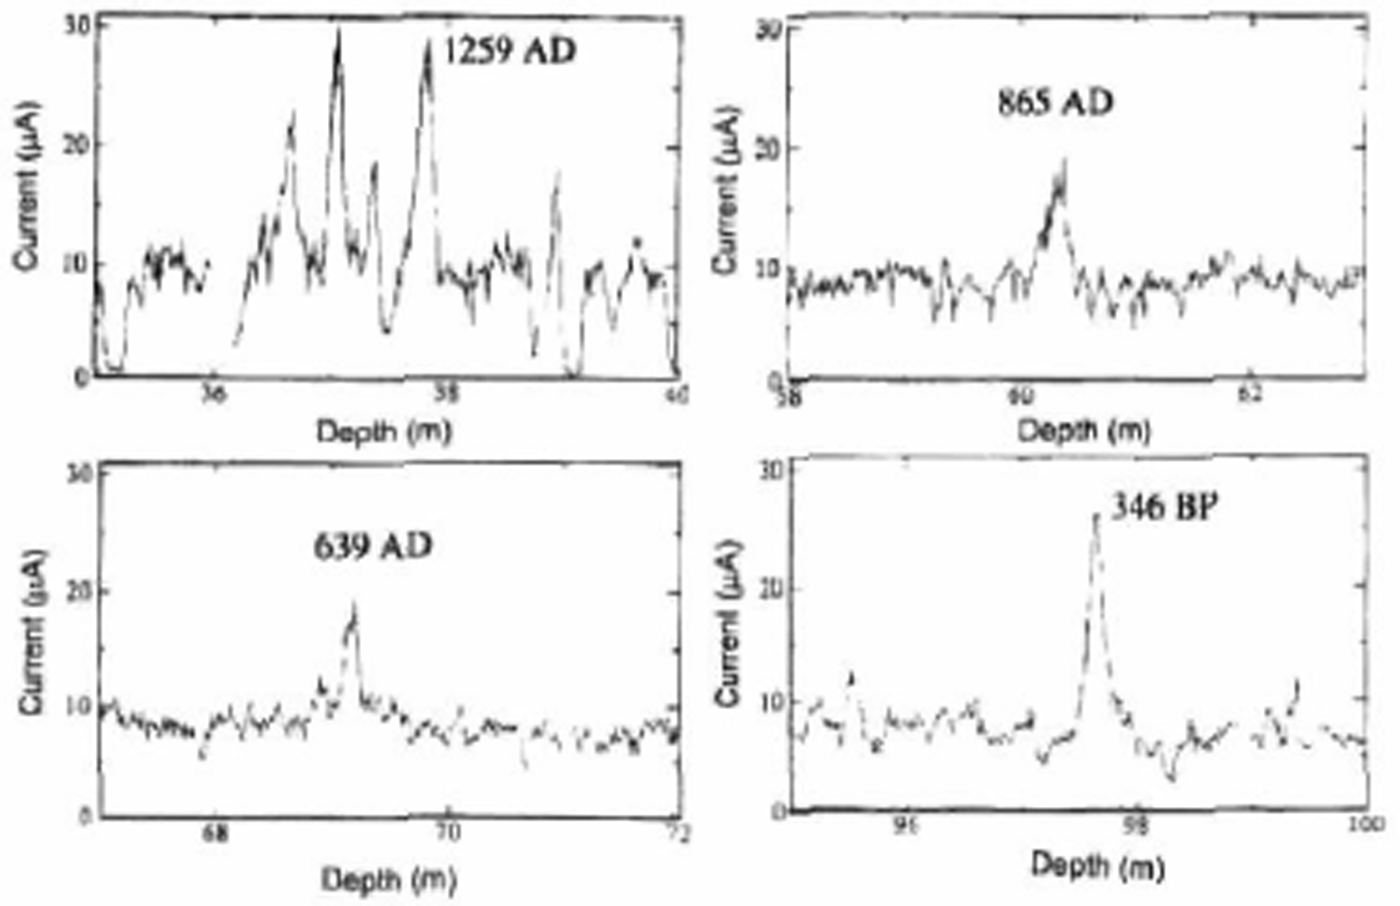
Fig. 10. ECM data used for dating by detecting volcanic eruptions which occurred at known times.
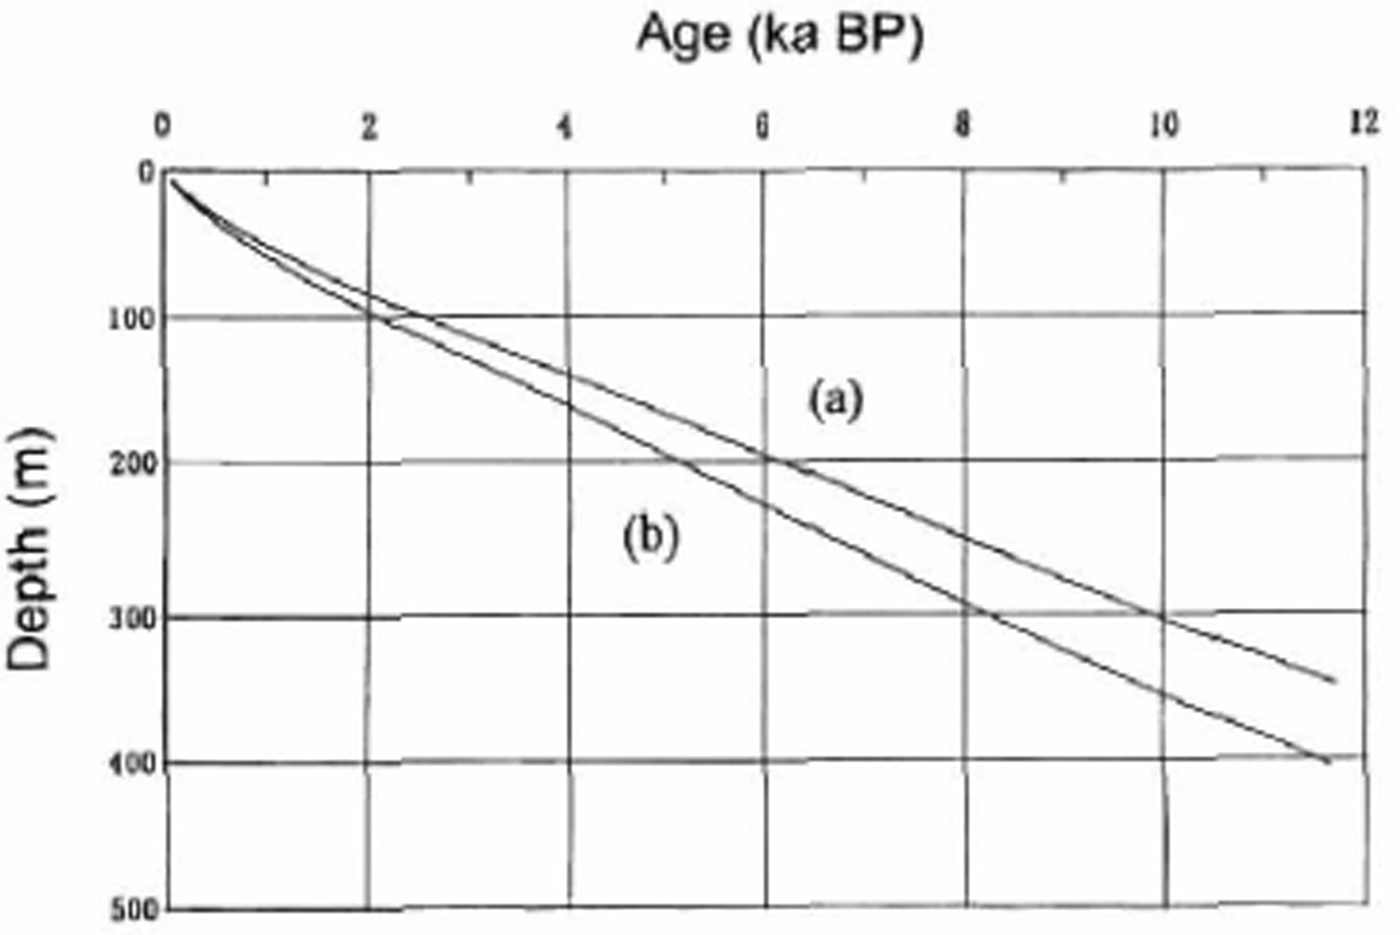
Fig. 11. Depth—age curves calculated with accumulation rate values of (a) 25 and (b) 30 mm w.e.a −1 .
By assuming a decreased net snow accumulation rate during the glacial periods, the depth–age relationship shown in Figure 11 is obtained. This relationship indicates that the 2503.52 m deep Dome Fuji ice core covers the last 330 ka. This is supported by comparison of the profiles of δ 18O with those from the (so far, more accurately dated) Vostok ice core.
CONCLUSIONS
The results obtained so far highlight several characteristics as follows.
There is substantial depth-hoar development during the snow metamorphism process in the surface snow layers. This may modify chemical signals which were originally indicative of atmospheric conditions.
The continuous δ 18O profile for the core suggests that the depth of the Holocene/Wisconsin transition is ∼380 m, indicating an annual mean snow accumulation rate of approximately 3.0 g cm−2 a−4 for the Holocene. This coincides with values obtained from fission-product tracers and the snow stake method. A depth–age relationship was obtained from the ice-sheet surface to 2500 m depth by estimating a decreased rate for precipitation during the glacial periods.
Measurements have been carried out for snow chemistry and δ 18O, as well as volcanic event analyses with ECM. Profiles of snow chemistry and δ 18O suggest the occurrence of large environmental changes between glacial and interglacial periods. δ 18O and chemical concentration and ice-crystal size show large fluctuations at the depths of the Holocene/Wisconsin and Wisconsin/Eemian transitions.


