Introduction
Seismic data have provided compelling evidence for multiple glaciations on the Ross Sea continental shelf, Antarctica since at least the Oligocene until the present (Reference Alonso, Anderson, Diaz, Bartek and ElliotAlonso and others, 1992; Reference Anderson, Bartek, Kennett and WarnkeAnderson and Bartek, 1992; Reference Bartek, Andersen and OneacreBartek and others, 1997). The evidence includes a foredeepened continental shelf, large-scale glacial troughs (comparable in size to modern-day ice streams) and a distinctive variation in seismic facies, indicating an alternation of glaciomarine (i.e. ice shelf) and grounded ice-sheet conditions.
Cenozoic sediments from the Ross Sea continental margin have been studied by different authors for a number of decades (e.g. Reference BarrettBarrett, 1975; Reference Anderson and TingleyAnderson, 1991). Deep Sea Drilling Project (DSDP) drill holes (sites 270 to 273), drilled in the 1970s, have provided limited information due to poor core recovery, and the limited geographical distribution of the cores, relative to the large area of the Ross Sea continental shelf. However, the data from the DSDP drill sites are quite valuable when correlated to high-resolution seismic data.
Deformation of the glacier bed plays a key role in the dynamics of mid-latitude ice sheets (Reference BoultonBoulton, 1979; Reference BoultonBoulton and Jones, 1979; Reference Boulton and HindmarshBoulton and Hindmarsh, 1987). Compressive flow occurs within a narrow marginal zone, while extending flow occurs further upstream (Reference BoultonBoulton, 1996). Sediments may be eroded by subglacial shearing from the region of extending flow and transported towards the margin, creating a subglacial shear zone and a marginal compressive belt (Reference Van der Wateren and MenziesVan der Wateren, 1995b, Reference Van der Waterenc). Strain rates in saturated sediment beneath a temperate glacier have been recorded in the order of 10 a 1 (Reference BoultonBoulton, 1996; Reference Boulton and HindmarshBoulton and Hindmarsh, 1987).Within a geologically very short time period, this results in extremely high shear strains in the subglacial shear zone. Analysis of microstructures of subglacial shear zones in samples from drill cores provides a method by which it is possible to determine the location of a glacial grounding line across the continental shelf (Reference Van der WaterenVan der Wateren, 1995a).
Overconsolidated marine sediments have been related to the presence of grounded ice on the Ross Sea continental shelf (e.g. Reference Anderson, Kurtz, Domack and BalshawAnderson and others, 1980; Reference Corradi, Fierro, Mirabile, Ferrari, Ivaldi and RicciCorradi and others, 1997) on the assumption that they were loaded by the weight of the overlying glacier during their deposition. In contrast, glaciomarine sediments deposited beneath floating ice are considered normally consolidated (Reference Kurtz, Anderson, Balshaw and ColeKurtz and others, 1979). Data presented in this paper show that subglacially deformed tills need not necessarily be overconsolidated and that these geotechnical properties are not diagnostic for distinguishing subglacial from glaciomarine diamictons.
The subject of this study is 14 piston cores, located in the central and eastern part of the Ross Sea continental shelf (Fig. 1). The cores were all collected during the NBP 94-07 cruise in the austral summer of 1994–95. During the cruise, a total of 93 piston cores were acquired with core lengths ranging from 0.2 m to > 4 m. All cores were located on high-resolution seismic lines so samples of underlying seismic facies could be obtained (Reference Bartek, Andersen and OneacreBartek and others, 1997).

Fig. 1. Central and eastern Ross Sea with bathymetry of continental shelf and location of piston cores. Inset shows location in Antarctica.
In this paper we demonstrate the use of microfabric analysis of cored sediments (15 samples), integrated with seafloor morphology (swath bathymetry and multibeam) and lithofacies to assist in distinguishing glacial marine from subglacial deposits. The aim of this study is to determine which depositional environments are represented by the Cenozoic sediments of the Ross Sea continental shelf and to establish the relationship between lithofacies and large-scale glacial events.
Methods
To distinguish subglacial and glaciomarine deposits, an analysis of data at multiple scales is used. Chirp-sonar data are acquired and used to map variation in subbottom stratigraphy. Piston cores are collected from landforms identified with chirp sonar, to obtain lithofacies data and samples for microscopic analysis associated with the landforms and cored deposits.
The term microfabric, used in this study, is defined as the relative orientation of parts of a rock mass, which refers to all components contained in a rock (Reference Passchier and TrouwPasschier and Trouw, 1996, p. 258). The method of structural analysis used here differs from micromorphology, a method originally developed in soil science which has been applied succesfully in glacial geology (Reference Van der MeerVan der Meer, 1993, Reference Van der Meer and Menzies1996; Reference Hiemstra and van der MeerHiemstra and Van der Meer, 1997). Because of the great similarity of (micro) structures produced by subglacial deformation in subglacial tills and deformation found in metamorphic rocks (Reference Van der WaterenVan der Wateren, 1995b, in press), we present a classification commonly used in structural geology as an alternative. Micro- structural analysis involves a morphological classification and kinematic analysis of foliations, as well as identification of S-C and S-C-C'-type shear-zone geometries, quite similar to that observed in mylonites, for example (Reference Passchier and TrouwPasschier and Trouw, 1996). Fabric strength is related to the magnitude of the finite strain: high shear strains result in a strong shear- zone fabric; low shear strains result in a weak fabric. Strength of the fabric also depends on the rheology and/or carbonate content of the material; therefore we compare the strengths of fabrics in relation to our observations on other scales, i.e. from the core lithologies to the chirp-sonar profiles, and make our interpretations based on this multi-scale analysis.
Piston cores are X-rayed and split lengthwise in the laboratory. Geotechnical properties, including shear strength and penetration (unconfined strength) are measured using a Torvane with three sizes of vanes and a pocket penetrometer. All measurements were conducted at 0.1 m intervals. Standard lithological descriptions (Reference JanecekJanecek, 1995) are made of the cores and their X-radiographs to document downcore variations in macroscopic sedimentary structures, pebble characteristics (content, size, and roundness), sediment clasts, the association of sedimentary contacts and the macrofossil content. Grain-size distribution is analyzed using an automated settling tube (of similar design to that of Reference Anderson and KurtzAnderson and Kurtz, 1979) and a laser particle-size counter (Spectrex) for the sand and silt—clay fractions, respectively. Organic carbon determinations were measured by combustion of a dehydrated sample at 500°C (Froehlich, 1980).
Samples for microscopic analyses were selected on criteria, such as lithofacies, geotechnical properties, seismic facies, location and age. Each sample was collected from the core as blocks ranging 0.5–0.1 m in length. The samples were air-dried in the laboratory for 2–4 weeks, impregnated, cut, mounted on glass slides varying from 60 × 60 to 60 × 90 mm and polished to a thickness of about 20μm (Reference MaltmanMaltman, 1994; Reference Van der MeerVan der Meer, 1993, Reference Van der Meer and Menzies1996).
Results
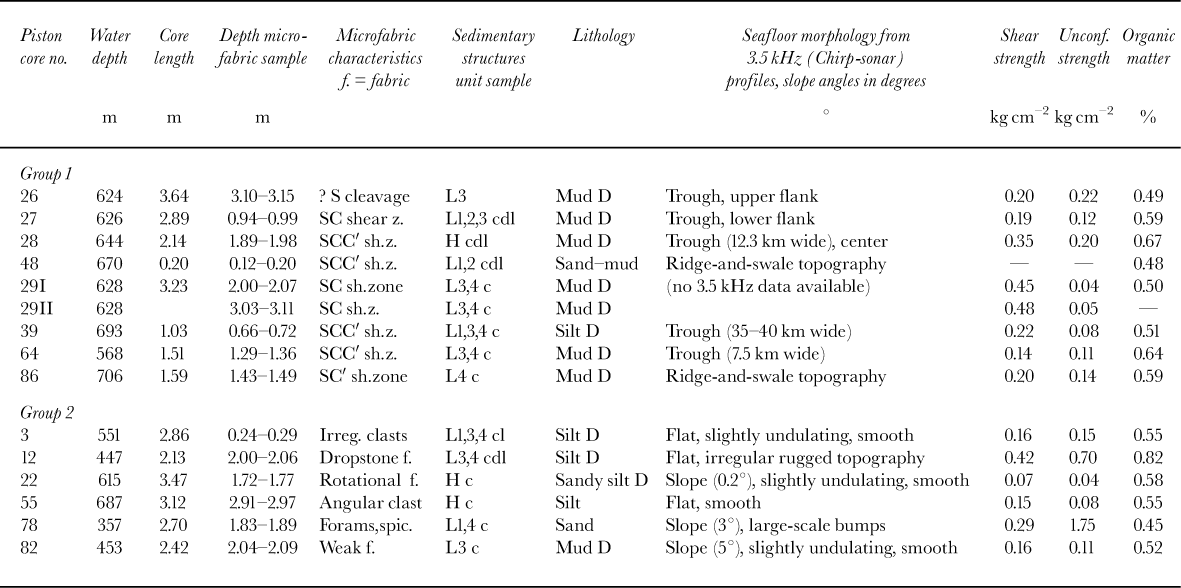
Results of microfabric analysis, along with their associated lithofacies and the piston core’s location on 3.5 kHz (chirp) profiles, indicates the presence of two groups (Table 1): Group 1 (eight piston cores) is found in troughs or on a ridge and swale topography, muddy diamicton composition and with microfabrics that show S-C and S-C-C’, -type shear-zone geometries, providing evidence of strong shearing along ductile shear zones. Group 2 (six piston cores), situated on slopes and flat terrain, consists of various lithologies which contain microfabrics with attributes such as drop- stones, angular-sediment clasts, large shell fragments and slight sorting in sandy layers, lacking a distinctive shear-zone geometry. Analytical results of textural, geotechnical and organic matter are presented next.
Table 1. Results of microbaric characteristics, lithofacies from piston cores, seafloor morphology, geotechnical measurements and organic-matter content.
Microstructures, lithofacies, chirp sonar
Group 1
Cores NBP94-7-48PC and -86PC are both located in areas of ridge and swale topography (ridge height, 10–20 m; ridge- ridge spacing, 100–500 m) (Table 1, Fig. 2). At the macroscopic scale, core 86PC contains a massive muddy diamict (contains > 70% mud) and core 48PC contains 0.2 m of alternating bands of sand and mud. Microfabric analysis shows that core 86PC has a well-developed continuous S- cleavage cut by spaced C' planes, as well as clasts with a rotational fabric within the matrix surrounding the clasts. Core 48PC shows a well-developed shear-band cleavage; SC cleavage cut by C' planes (Fig. 3).

Fig. 2. Chirp-sonar profile showing ridge and swale topography and location of core NBP94-7-86. Core symbols indicate pebbles. Inset shows contours of ridges with consistent NNE—SSW orientations; contour interval 10 m.

Fig. 3. Microfabric of sample from core NBP94-7-48: S-C-C' shear zone, with crossed polarizers and gypsum plate.
Piston cores NBP94-7-26PC, -27PC and -28PC are found on the upper and lower flank of a shallow trough (flank horizontal dimension approximately 500 m) and in the center of the shallow trough, respectively. The trough is approximately 12 km wide and 20 m deep (Fig. 4). Cores 27PC and 28PC are composed primarily of muddy diamicton with silty lenses and/or layers of sandy mud, while core 26PC contains a massive muddy diamict. The microfabric of a sample from core 28PC shows a clear S-C-C' shear-zone fabric (cf. Fig. 3). Core 27PC shows a continuous, strong cleavage in a silty layer attributed to stretching and an S- cleavage sigmoidally shaped between the subhorizontal spaced C-cleavages, which is interpreted as a dextral S-C shear-zone fabric (Fig. 4). Core 26PC shows a weaker fabric strength compared to 27PC and 28PC, with a single penetrative cleavage and weak rotational fabrics in the matrix around sand grains.

Fig. 4. Chirp-sonar profile showing morphology and location of cores NBP94-7-26, -27 and -28. Symbols indicate pebbles and horizontal contacts, as well as laminae. In set shows microfabric of NBP94-7-27, S-C shear zone in silt band, with crossed polarizers.
Similar trough morphologies are associated with cores NBP94-7-39PC and -64PC, although different in size (35— 40 km wide and 50–75 m deep for the trough with core 39PC and 9 km wide and 15-20 m deep for the trough with core 64PC). The cores contain muddy diamictons and both show S-C-C' shear-zone fabrics in very strong birefringent matrices at the microscopic level.
Lithologies of the group 1 samples are generally muddy diamictons. Lithofacies of the intervals sampled for microfabric analyses of group 1 strata vary, but generally show some sort of layering (L1, 2, 3, 4; see Table 1). Layers (L3) of variable densities of fine to very fine pebbles (2–8 mm) in macroscopically observed homogeneous diamictons are relatively common. This stratification is commonly on the order of 0.1 —0.5 m, but also shows as bands up to 1.5 m and is observed in X-radiographs. Continuous to discontinuous laminae and clasts are also common within group 1 samples.
Group 2
Core NBP94-7-55PC contains a massive silt unit (>70% silt) and was acquired from a site located on a flat, smooth surface (Fig. 5). The microfabric analyses indicate a lack of cleavage or any shear-zone fabric and shows there are abundant small to large (<32 mm) unlithified mud clasts with angular shapes (Fig. 5).
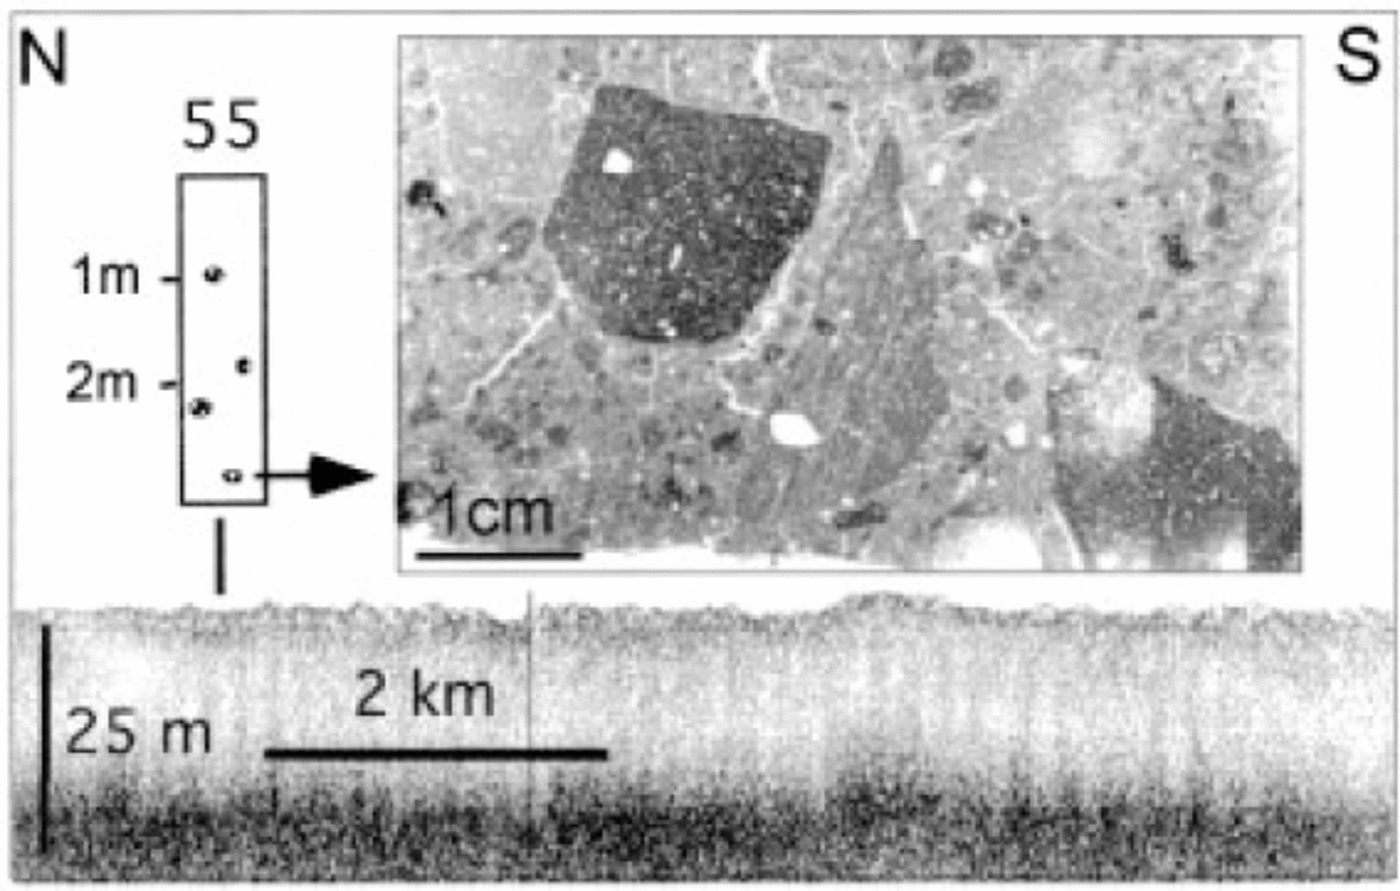
Fig. 5. Chirp-sonar profile showing fat smooth topography at core NBP94-7-55. Symbols indicate soft-sediment clasts. Inset shows microfabric with prominant angular shape of sediment clasts. View with plane light.
A slightly undulating sea-bed morphology is associated with cores NBP94-7-3PC and -12PC (Table 1). Both contain silty diamictons (<70% silt) and show a laminated structure. Microfabric analysis fails to reveal any distinctive cleavage, but reveals dropstone fabrics of coarse pebbles (underlying layer shows depression at the contact), wavy contacts, discontinuous sand layers, irregularly shaped clasts and alternating laminations of diatom and foram muds.
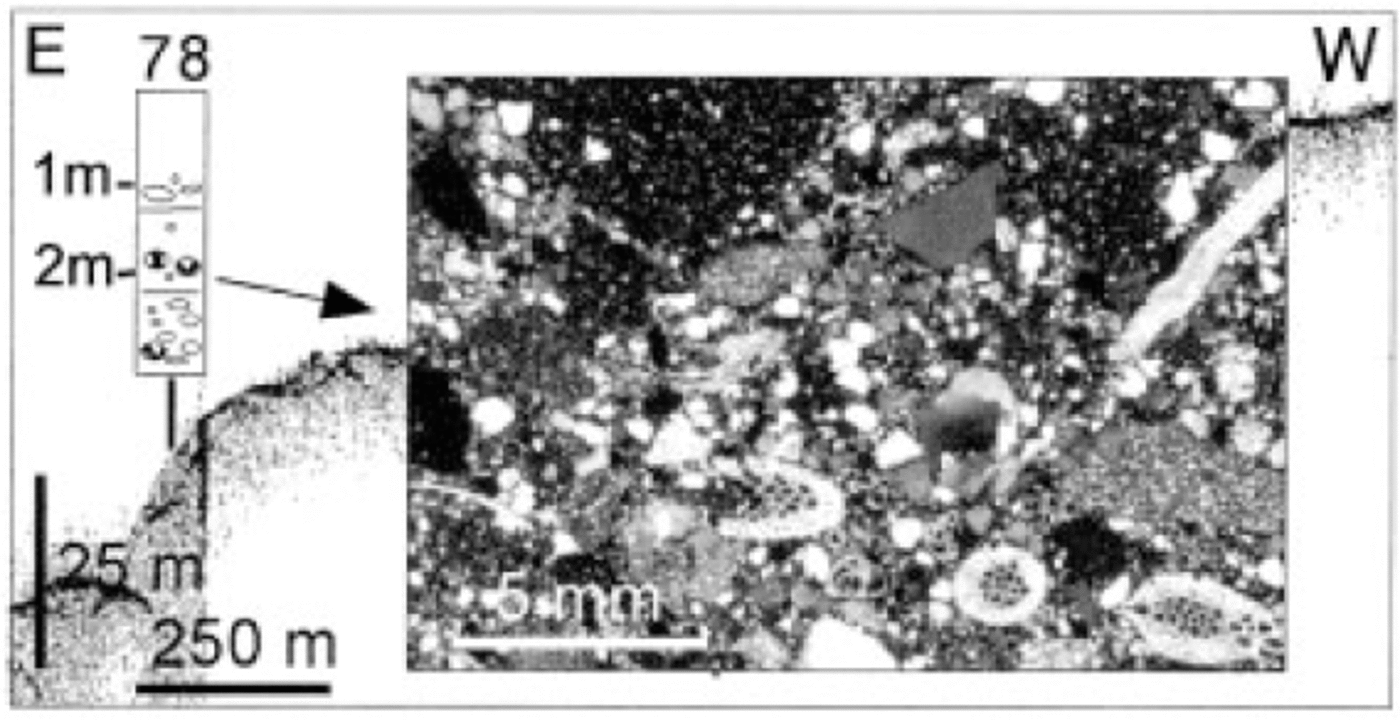
Core NBP94-7-78PC is on an undulating large-scale 3° slope (Fig. 6). The core is a sequence of alternating sand and muddy sand with abundant large to very large-sized mud clasts. The sand contains abundant forams, spicules and diatoms (Fig. 6).
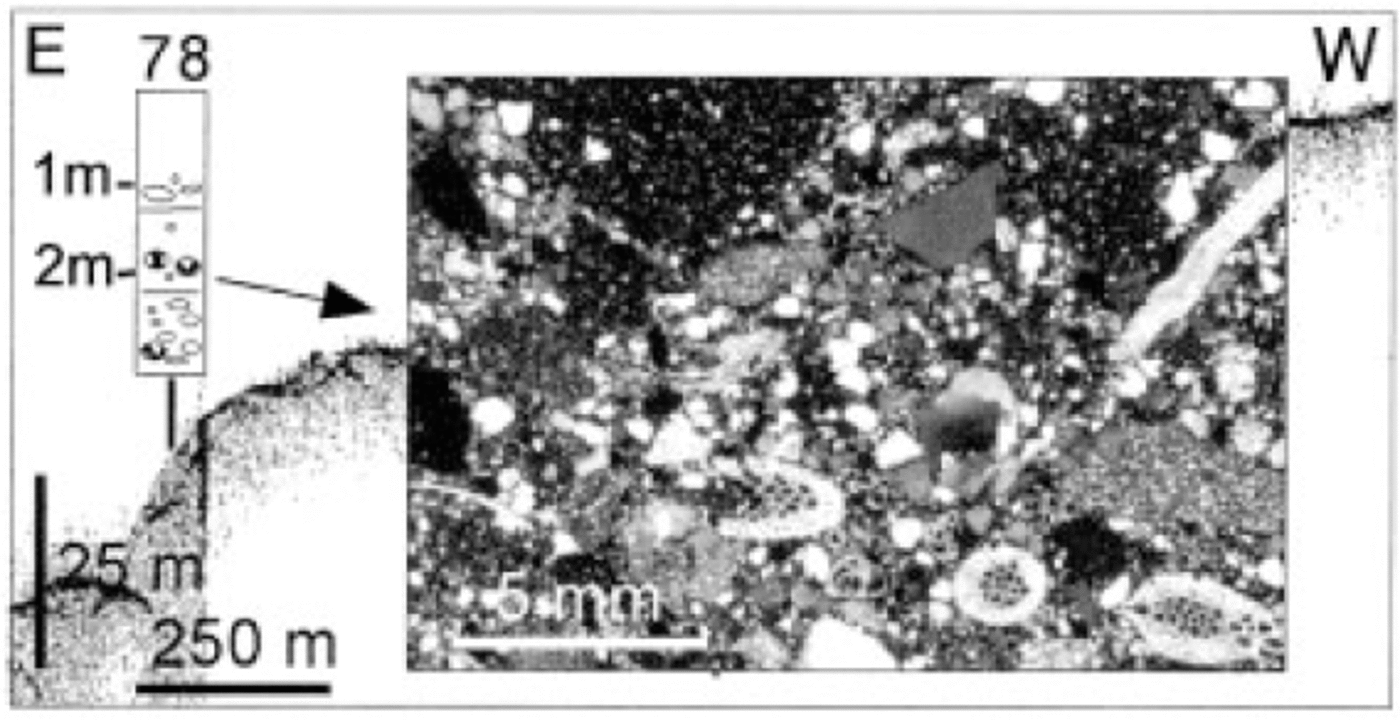
Fig. 6. Chirp-sonar profile showing slope with undulating topography at core NBP94-7-78PC. Rugged topography may be indicative of mass movement. Symbols show pebbles, as well as soft-sediment clasts. Inset shows microfabric with abundant foraminfera; in upper part, an angular coarsesized mud clast is seen. View with crossed polarizers.
Cores NBP94-7-22PC and -82PC are also associated with slope locations and contain muddy and silty diamictons, respectively (Table 1). Multi-beam data in the vicinity of core 82 show slope fans, probably indicative of sediment gravity-flow processes. The microfabric of core 82PC also lacks any distinctive cleavage and/or asymmetric shear-zone structure. On the microscopic scale, the matrix of core 22PC appears to comprise folded lamina, often in irregular and isolated forms. Sediment clasts of different colors and composition are found throughout the sample. Some sediment clasts, as well as most sand grains, possess a rotational fabric in the clay matrix around them.
Lithofacies descriptions of the units from which the microfabric samples were taken are variable. Sedimentary structures in group 2 generally indicate a layering of some sort (L1, 3, 4) or the absence of layering (H, homogeneous). Clasts are common, as well as (dis)continuous lamina within the layered intervals. The lithologies of the samples in this group range from sand and muddy sand to silt to muddy and silty diamictons.
Textural analysis, geotechnical measurements, organic-matter content
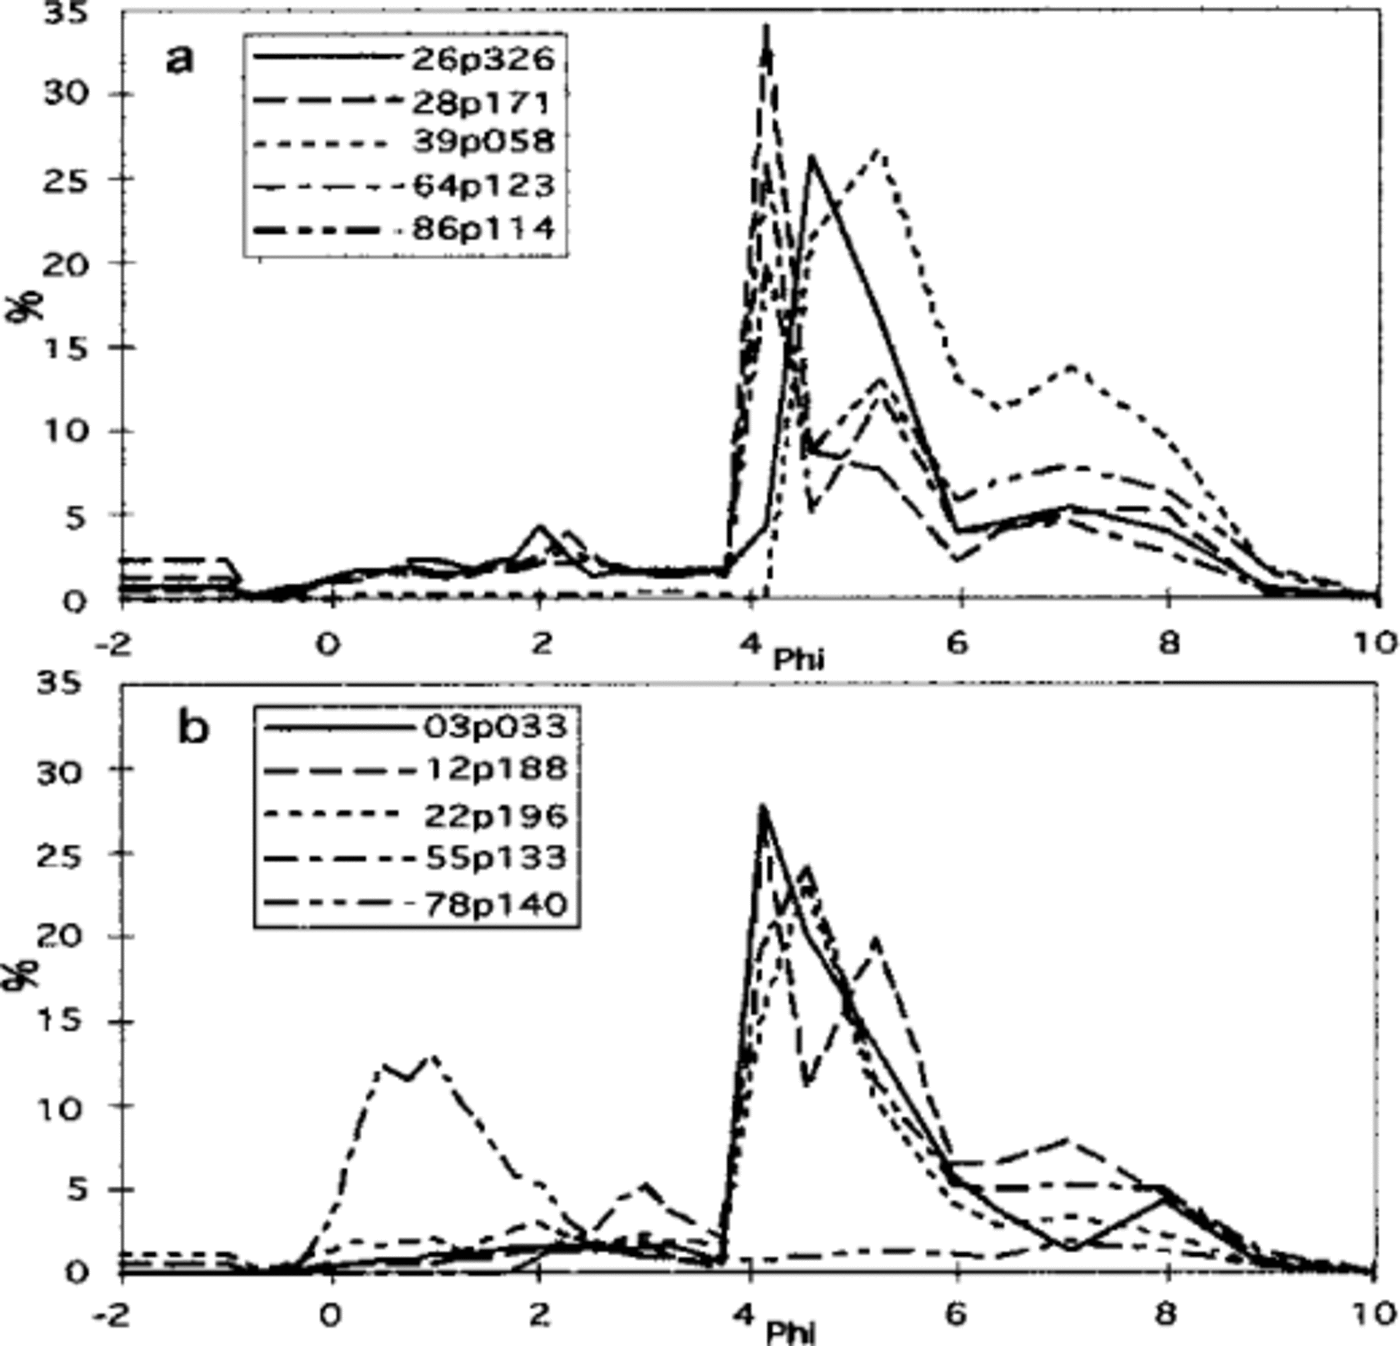
The two groups (Table 1) distinguished on basis of their microfabric, lithofacies characteristics and bottom morphology, as identified in chirp sonar data, are also recognized in analyses of sediment texture (Fig. 7). It appears the sediments of group 1 are almost exclusively mud diamictons and are very poorly sorted. Kurtosis descriptions of the curves vary from platykurtic, mesokurtic, to very leptokurtic, and the distributions can be described as polymodal .The majority of grain-size curves in group 1 are negatively skewed, due to a slightly higher sand and gravel content (Fig. 7a). Group 2 sediments, on the other hand, show more variety in their lithologies and are slightly better sorted (poorly) than group 1 sediments. Kurtosis in group 2 can be described as almost exclusively leptokurtic, distributions are almost unimodal and most curves are positive to symmetrically skewed (Fig. 7b).
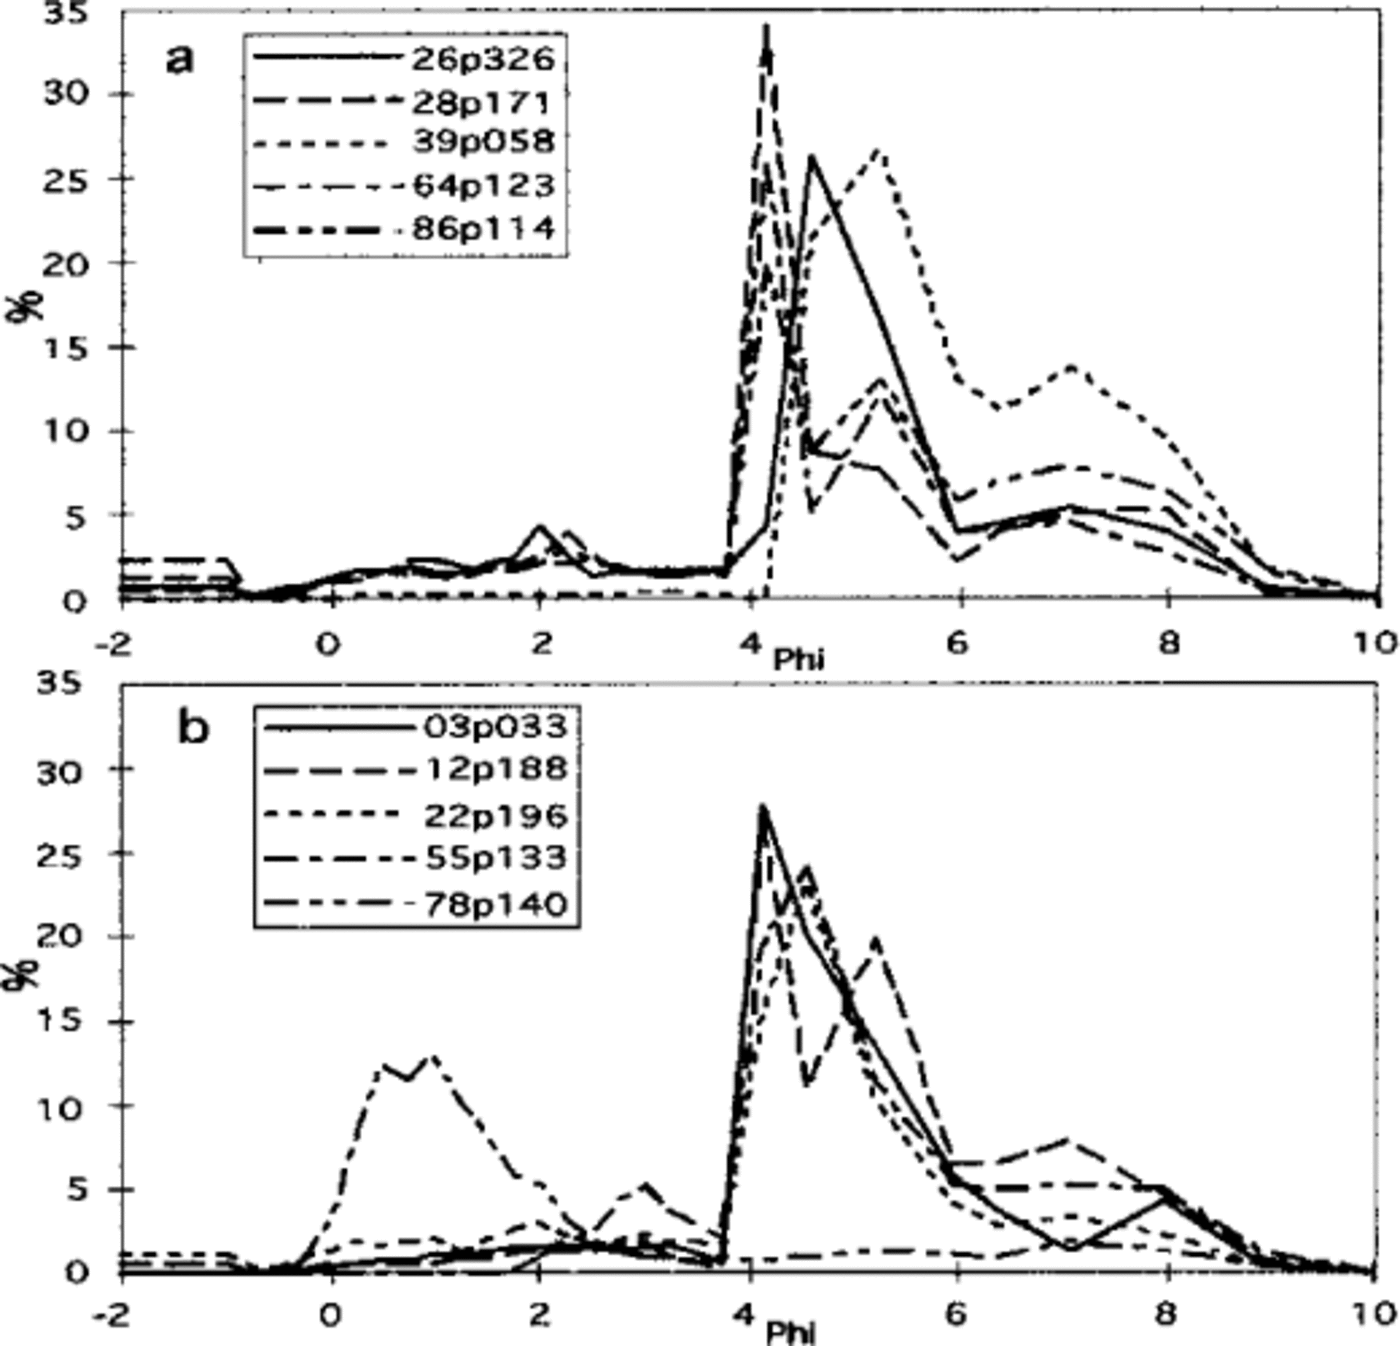
Fig. 7. Particle-size analysis with frequency-distribution curves of sediment samples from cores of group 1 (a) and group 2 (b). Group 1 shows generally polymodal, very poorly sorted, platy-, meso- to leptokurtic curves, whereas group 2 exhibits unimodal, poorly sorted, leptokurtic distributions. The first two digits refer to the core number, the last three digits refer to the depth (in cm) of sample.
Shear-strength values in group 1 samples are slightly higher than in group 2 (average values 0.28–0.21), but the unconfined strength values are higher in group 2 sediments (0.12–0.59) (Table 1). Analysis-of-variance of the shear strength and unconfined strength of the two groups indicates there is a low probability of the shear strength or the unconfined strength values of samples from the two groups being significantly different (P = .33 and .16).
Diatomaceous muds and oozes may contain high concentrations of organic (bituminous) compounds. This organic matter is expected to mask birefringence patterns in the clays, which could make it impossible to identify shear- zone fabrics. The results of the loss-of-ignition test on the samples shows there is no significant difference in organic-matter content between the two groups (Table 1) (P = .83). So the masking effect described above can be ignored for the set of cores described in this paper.
Discussion
Sediments from group 1 can be correlated to a seafloor morphology of a ridge and swale topography or to small- and large-scale troughs. Spacing between ridges occurs on a 100 m scale, while trough widths occur on a km scale.
Since cores NBP94-7-86PC and -48PC exhibit shear- zone fabrics (S-C' and S-C-C' type, Fig. 3) and both are located on a lineated topography, the microfabric is interpreted as suggesting subglacial shearing as the process responsible for both the homogeneous diamict (core -86PC) and the laminated mud (core -48PC) (Fig. 2).
Erosional scours and valleys are well known and described from the Ross Sea continental margin (e.g. Reference Anderson, Bartek, Kennett and WarnkeAnderson and others, 1992).The shear-zone assymetry represented in the microfabrics of cores NBP94-7-27PC and 28PC are interpreted as representing strong subglacial shearing. The position of the cores -27 and -28PC inside the trough conforms with the subglacial interpretation of the shear-zone fabrics and suggests subglacial erosion by grounded ice as the mechanism responsible for the trough morphology (Fig. 4). The weak fabric strength of the microfabric of NBP94-7-26PC, makes its interpretation less conclusive. The evidence from core -26PC, located on the upper flank of the trough, may suggest less-powerful subglacial deformation outside the trough (Fig. 4).
At the microscopic level, cores NBP39PC and -64PC show S-C-C' shear-zone fabrics in very strong birefringent matrices, indicative of subglacial deformation of the bed as the ice was moving over the continental shelf. The position of both cores in troughs suggests that subglacial erosion may also have eroded these sites. One trough, containing core 39PC, has dimensions comparable to modern-day ice streams. The combination of these observations lends strong support to the hypothesis that the process of subglacial erosion and deformation is responsible for the trough morphology, as well as till formation.
Although the lithofacies descriptions vary considerably for each core within group 1 ranging from homogeneous to layered, the fine and very fine pebble-density variation (L3), as well as the dominant mud-diamicton lithology, seem to be common features within this group (Table 1). Possibly the pebble-density variation reflects an intermediate stage of mixing sediment layers in a deformable bed, prior to total homogenization. The pebble-density variations, as well as the presence ofdiscontinuous and continuous lamina in many of the cores and samples and associated with S-C, S-C' and S-C-C' fabrics, can be explained as a “transposed sedimentary foliation” (Reference Van der WaterenVan der Wateren, 1995c). A “transposed sedimentary foliation” can be a diamict with a diffuse compositional layering which is the product of intense shearing.
Group 2 sediments are found on low-angle slopes and on flat, smooth terrain. Core NBP94-7-55PC is associated with such flat terrain (Fig. 5). The well-preserved angular facets of the soft-sediment clasts suggest deposition with minimal clast-to-clast contact, such as settling through a water column, and excludes a subglacial deformation process which produces rounded clasts (Reference Van der MeerVan der Meer, 1993, Reference Van der Meer and Menzies1996).
Observations from cores NBP94-7-3PC and -12PC on a microscale show dropstone fabrics, wavy contacts, discontinuous lamina and irregular-shaped clasts in the absence of a shear-zone fabric. The association of these microfabric characteristics with a smooth, slightly undulating topography, suggests settling from suspension from underneath an iceberg or ice shelf, with minor sediment gravity-flow.
The position on a slope of core NBP94-7-78PC (Fig. 6) and the possibility that the undulations are slump- “mounds”, may suggest that the mixed sand—muddy sand facies in this core is produced by a sediment gravity-flow.
Cores NBP94-7-82PC and -22PC are both located on slopes. NBP94-7-82PC, as seen on chirp-sonar profile as well as multi-beam, is associated with a slope-fan morphology. The lack of any cleavage or shear zone in the microfabric analysis associated with this morphology suggests an environment characterized by slump processes. Rotational fabric is generally considered as evidence for rotational movement and subglacial deformation within a sediment mass (skelsepic plasmic fabric: Reference Van der MeerVan der Meer, 1993). The rotational fabric of NBP94-7-22PC associated with vague folded matrix bands, in absence of any shear-zone fabric and related to the core’s position on a slightly undulating slope, is interpreted here as a lower grade of soft-sediment deformation, possibly a product of a debris flow in a glaciomarine environment.
Lithofacies analysis of group 2 sediments reveals no common structure (Table 1); homogeneous and layered structures are both common. Lithologies vary from sand to silt, indicating variable sources of sediment or variable processes of sediment transport and sorting of sediments, such as sediment gravity-flows and “rain-out” (ice-rafted debris) processes.
Comparisons of textural parameters such as skewness, kurtosis and sorting of group 1 and group 2 samples indicate that the texture of the samples from the two groups are different (Fig. 7). Group 1 samples are negatively skewed, while group 2 samples are symetrically to positively skewed and tend to be better sorted and have a leptokurtic grain-size distribution. These features imply that group 2 sediments primarily have a unimodal distribution suggesting that a single process or source is responsible for deposition, whereas group 1 samples have variable, more multimodal distributions suggesting multiple sources or multiple processes, mixing or reworking of the sediments. The latter processes correlated to texture are consistent with processes associated with a deformation till (Reference BoultonBoulton, 1996; Reference Van der WaterenVan der Wateren, 1995b). The more leptokurtic distribution and better sorting of group 2 samples may be attributed to winnowing of sediment by currents as the sediment settles through the water column. The effects of the presence of sediment clasts on the grain-size distribution is not considered here, because the distribution of clasts within the sediment of each group is equal.
Early research involving detailed analysis of diamictons in the Ross Sea formulated criteria which favored a subglacial origin for the diamictons (Reference Kellogg, Truesdale and OstermanKellogg and others, 1979; Reference Anderson, Kurtz, Domack and BalshawAnderson and others, 1980). Some of these criteria include a lack of sorting and stratification, absence of fossils, as well as overcompaction, as indicative for a subglacial origin. However, Reference Anderson, Bartek, Kennett and WarnkeAnderson and others (1992) stated that caution should be exercised when using these criteria for environment de- positional interpretation and suggested that these criteria were not conclusive indicators of subglacial deposition. In this study, both groups 1 and 2 show layered and laminated structures in their cores (see Table 1) and therefore the groups cannot be easily distinguished from one another based on the presence or absence of macroscopic stratification. Also, the geotechnical measurements performed on the cores cannot be used for differentiating the sediments into two groups in the same manner as is demonstrated by the integration of microfabric analyses, lithofacies, chirp data and textural analyses. Therefore, a multi-scale analysis is best for differentiating subglacial from glaciomarine environments. Use of single or even combined criteria as stratification and/or overcompaction can give erroneous interpretations of depositional environments and should therefore be avoided.
Conclusions
Analysis of microfabrics in samples from piston cores, along with seafloor morphologies, textural data and lithofacies characteristics, is a strong tool to distinguish subglacial tills from glaciomarine deposits on high-latitude continental margins.
Ice sheets or ice streams, grounded on the continental shelf may erode trough-shaped morphologies and/or may leave a fluted terrain imprinted on the soft-sediment substrate (Figs 2 and 4). Sediments deformed by overriding ice share a similar lithofacies and show as rather homogeneous mud diamictons. The outcome of the textural analysis suggests that these coarse-skewed, very poorly sorted sediments may have been reworked and mixed multiple times. On a microscale, S-C and S-C-C'-type shear-zone geometries indicating subglacial deformation confirm the presence of grounded ice on the shelf during formation of this deposit.
Ice shelves and icebergs produce sediment via meltout at their base and glaciomarine deposition results in flat, generally smooth topographies, or deposition is on slopes where sediment gravity-flows may modify the sediment. Glaciomarine deposits are poorly sorted with symmetrical curves, show more variety in lithologies and the kurtosis-parameter suggests a single depositional process is responsible for the grain-size distribution. Microfabrics and composition associated with group 2 sediments include: abundant forams; dropstone fabrics around pebbles; angular clasts and irregu- lar-clast shapes; and folded and mixed nature of the matrix, associated with rotational fabrics around sand and silt grains. There is an absence of a shear-zone fabric characteristic. The results of the microfabric analysis, combined with the textural, lithofacies and sea-floor data provide evidence for glaciomarine depositional processes, ranging from settling-from-suspension to sediment gravity-flows as being most important in formation of group 2 deposits. This implies ice shelf or open-water conditions present on the continental shelf during the deposition of these sediments.
Acknowledgements
This research was supported by U. S. National Science Foundation grants OPP-9220848 and OPP-9316710. We thank the captain and crew of the R/V Nathaniel B. Palmer, as well as the technicians of the Antarctic Support Associates for their help and support during the cruises. F. M. van der Wateren acknowledges support from the Netherlands Geosciences Foundation, with financial aid from the Netherlands Organization for Scientific Research. We thank J. van der Meer, J. Rose, and A. Stroeven for critical reviews of the paper which resulted in substantial improvements to the text. N. Koot of the Rock Processing Laboratory, Vrije Universiteit Amsterdam, is thanked for her skillful preparation of the thin sections.


