Introduction
It is well known that not all meltwater from the Greenland ice sheet will eventually run off into the ocean. A fraction will be stored, particularly in the accumulation zone, as refrozen water and superimposed ice. An estimate of the effect of meltwater retention shows that the global sea level could be as much as 5 cm too high over 150 years if meltwater retention from the Greenland ice sheet is not accounted for (Reference Pfeffer, Meier, Illangasekare, Weller, Wilson and SeverinPfeffer and others, 1991).
Meltwater released at the surface percolates into dry snow through vertical channels (Reference BøggildBøggild, 2000). Figure 1 shows a tracer experiment where water is sprinkled on top of a windblown snowpack, as commonly occurs on the Greenland ice sheet. The percolation shows clear preferential flow paths with alternating horizontal and vertical water-flow directions. Reference Marsh and WooMarsh and Woo (1984) performed important early work on meltwater movement through snow, and documented the formation of ‘flow fingers’ (vertical channels), horizontal channels and ice lenses. Here, we approximate the meltwater flow paths as vertical for pore refreezing (RF) and horizontal for superimposed ice (SI) formation. With vertical flow we believe low water saturation and transient conditions mainly result in freezing by warming of the grains exposed to water. The horizontal flow, however, is where downward flow is obstructed, meltwater accumulates and downward heat conduction results in SI formation. This system of alternating water-flow direction likely results from competing processes, i.e. RF prevents water ponding needed for SI, and SI prevents further downward pore-water freezing. The competing effect between SI and RF means that the system cannot be forecasted and be quantified when water first enters cold, dry snow. However, because the two processes are driven by different physical mechanisms their potential magnitude can be estimated.
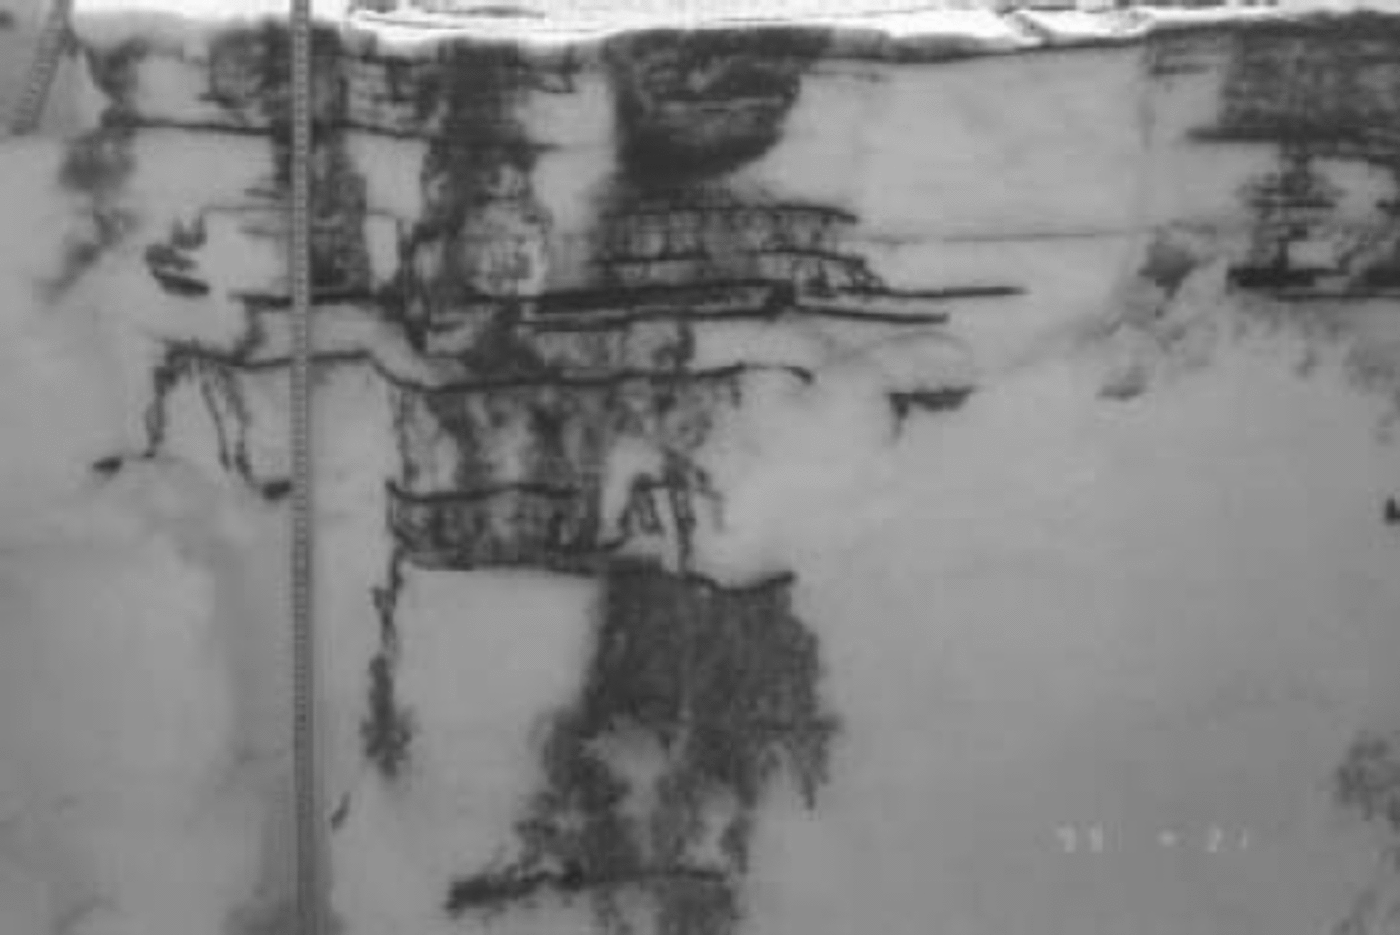
Fig. 1. Tracer experiments where meltwater percolates into cold snow. Note the alternating horizontal and vertical flow directions, which resemble the different processes of SI and RF, respectively.
Here we perform a modeling study along a transect across the ice sheet. The transect chosen is along 66° N, from the eastern to the western margin of the ice sheet (see Fig. 2) where significant water retention is believed to occur and information is available. Since the SI and RF processes are likely to occur simultaneously in the same snow/firn column, and can be estimated with some assumptions, we model both processes independently. Finally we discuss the occurrence and magnitude of each process with respect to location along the transect and discuss the impact in relation to the mass-balance setting along the profile and a changing climate.

Fig. 2. Location of the selected transect of investigation at 66° N.
Models
Meltwater refreezing
A method has been derived and a model developed to estimate the magnitude of meltwater refreezing in porous firn, i.e. in the accumulation zone on glaciers (Reference BøggildBøggild, 1990).
If we assume that the snow/firn column is at the melting point at the end of the melt season, two processes lead to meltwater retention: (1) pore-water freezing (Gw) during winter where heat from the wetted firn is conducted upward into the atmosphere; and (2) the effect of meltwater freezing during summer as meltwater becomes first exposed to contact with the cold snow/firn (Gc). The Gc and Gw processes are determined in the following way (Reference Trabant and MayoTrabant and Mayo, 1985):
where ρf and ρi are the density of firn and ice, respectively, C is heat capacity of ice, F is the latent heat of fusion, Swi is the irreducible water content and z is the vertical coordinate.
In order to obtain information about the freezing-front penetration and evolution of the temperature field, modeling of transient temperature development in a vertical column during winter is carried out. However, as a boundary condition the model needs two sides of moving interface at the top and bottom, respectively, the upper boundary being defined by the snow surface where winter accumulation results in an upward migration of the upper boundary condition. The downward movement of the lower boundary is determined by the temporal position of the freezing front. The penetration of the freezing front at each time-step is determined by an extended version of the heat-balance integral (HBI) approach (Reference BøggildBøggild, 1990). The integration principle has been derived for application in a medium with different thermal properties, based on an approach for isotropic conditions Reference Lunardini(Lunardini, 1988). The principle behind HBI is that the penetration of the freezing front (∂S) for each time-step is determined by the temperature change from the surface down to the freezing front (first term on righthand side), the heat loss to the atmosphere (second term) and a correction term to compensate for variable thermal properties (third term). Penetration of the freezing-front ∂S is determined in the following way:
where K is the thermal diffusivity. The model runs at 2 hourly time-steps over the course of the winter from the first day of freezing (initial conditions) until the first day with surface melting. At each time-step, first the development of the temperature field is determined at discrete vertical steps of 0.1 m using the heat diffusion equation (Reference BøggildBøggild, 1990). Secondly, the freezing-front penetration is determined. When melting begins, the resulting temperature field is used to determine the cold content of the vertical column, from which Gc can be determined. Equation (3) is used to determine Gw over the course of a winter.
Superimposed ice formation
To our knowledge, the first numerical model of SI growth was presented by Reference Wakahama, Kuroiwa, Hasemi and BensonWakahama and others (1976). They treated the SI formation in a one-dimensional domain and found that, in order to obtain realistic quantities, time-steps as small as 120 s and grid steps of 0.02 m were necessary. Bøggild (in press) adapted the Wakahama and others model and has re-examined old modeling results (Reference BøggildBøggild, 1991). It was found that the growth rate of SI follows a square-root function with time. This finding led to the examination of SI formation as a Stefan problem of moving interface Reference Lock(Lock, 1990). The theory behind the Stefan problem is that accretive freeze at an interface results in a moving boundary and stretching of a temperature gradient. The result is a decline in growth rate, which theoretically has been determined to relate to the square root of time. Based on the theory of the Stefan problem, an analytical solution for SI growth was derived for the case of isothermal glacier ice on which the SI grows (Bøggild, in press). However, since the theory is only valid for isothermal conditions, a parameterization was carried further in an empirical way to account for (1) a temperature gradient in the ice on which SI grows and (2) variable thermal properties of the underlying ice on which SI is formed. The final solution to SI growth H(t) on top of an impermeable medium is determined in the following way (Bøggild, in press):
where Ts is the ice temperature prior to SI formation where SI forms first, and dT/dx is the temperature gradient of the upper meter of the impermeable ‘ice’. k1, k2 and k3 are constants.
Data Input
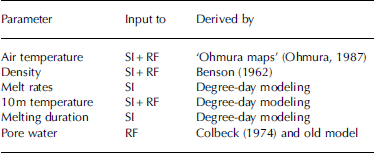
Data required as input for modeling the two processes in a transect across the ice sheet are listed in Table 1.
Table 1. Data input for SI and RF modeling
Air temperature
The annual temperature cycle in air temperatures has been reconstructed by means of published maps provided by Reference OhmuraOhmura (1987) and inferring a sinusoidal cycle given by the annual mean air temperature and the amplitude as determined by TJuly – Ta.mean. From this relation, daily air temperatures can be derived.
Density profiles
Observations have documented that vertical profiles of density can vary considerably even over short distances (Reference BøggildBøggild, 1990). To account for spatial variability and retrieve regional trends along a given transect, a high number of surface ice cores are needed, which again calls for an unrealistically large field campaign. The most comprehensive study of firn-density variations is provided by Reference BensonBenson (1962). His results indicate that the vertical density profile cannot simply be described as a function of altitude but is also related to melt rates. This is not surprising since melting results in both wet-snow metamorphism (densification) and meltwater retention by SI and RF. Figure 3 shows the density distribution with altitude based on a parameterization from data published by Reference BensonBenson (1962) in the Thule area, some 1300km to the north of the present transect. In the present parameterization the depth–density increase with elevation has been raised by 800 m, which corresponds with the higher equilibrium line along our transect.

Fig. 3. Comparison between observation and parameterization of data at a location 1960 ma.s.l.
Melt rates
Melt rates have been determined by means of the probability (normal distribution) of daily positive air temperatures occurring during the annual air-temperature cycle (Reference ReehReeh, 1991; Reference Bøggild, Reeh and OerterBøggild and others, 1994). From daily air temperatures the daily melt rates have been determined using the degree-day approach (Reference Bøggild, Reeh and OerterBøggild and others, 1994). It would have been ideal to use the energy-balance approach to account for the turbulent flux field, for example, but such data are not available.
10 m temperatures
10m temperatures can be derived from annual mean air temperatures over most of the ice sheet Reference Benson(Benson, 1962). However, in the lower accumulation zone the effect of firn warming from meltwater freezing significantly warms the firn and results in a positive deviation from the annual mean. Reference ReehReeh (1991) has determined the rate of firn warming to relate to the magnitude of meltwater freezing (MWF) in the following simplified way DT = 26.6(MWF) at <2000ma.s.l. A first, crude, estimate of MWF was determined by means of the relation proposed by Reference ReehReeh (1991) where 70% of the surface meltwater is assumed to warm the firn.
Melting duration
The number of days with meltwater formation can be derived in a similar way to the melt rates, from the probability of having a day with positive air temperature. In the calculations, a Gaussian integral was superimposed on the annual air-temperature cycle Reference Reeh(Reeh, 1991). By integrating for only values above the melting point, the probability of melt-day occurrence can be derived. A standard deviation of 4.5 K has been applied to the Gaussian integral as recommended by Reference ReehReeh (1991).
Pore water
Published literature states that the irreducible water content of snow is 7% of the pore space (Reference ColbeckColbeck, 1974). However, thorough model experiments reveal that a lower water content is likely to occur in the firn on the Greenland ice sheet since this would result in a more realistic penetration of the freezing front into the firn (Reference BøggildBøggild, 1990). Consequently, we assume an irreducible water content of 3% as recommended by Reference BøggildBøggild (1990).
Figure 4 shows comparison between observations during a CryoSat campaign in 2002 at a point approximately 20 km north of the transect on the eastern slope of the ice sheet at 1960 ma.s.l. Part of the discrepancy in the temperature field is likely because the snow temperatures were measured on 30 April and model results are from mid-June. However, at depths of 1m or greater, observations and model results agree fairly well, giving confidence in the calculation of the temperature field.

Fig. 4. Density gradients (dρ/dz) derived (points) for the transect at 66° N, and observed gradient (line) by Reference BensonBenson (1962) at 79° N.
The dataset presented above is by no means optimal for the present study and can be improved by more observations. The automatic weather station network established under the Program for Arctic Regional Climate Assessment (PARCA) (personal communication from K. Steffen, 2001) will likely improve the older temperature maps used here. Furthermore, the stations can provide the data required for determining melt rates more precisely using the energy-balance approach, as well as determining melt duration. This would be a separate study, however, and is beyond the scope of the present paper. Temperatures at 10m depth have become a proxy measure for the annual air temperature. However, sensitivity analysis has shown that at 10 m depth the firn temperature may oscillate up to 1–2˚C over the course of a year.
Modeling Results
Modeling the RF potential was carried out by first inducing the 10m temperature in each entire profile. Then the simulations of the temperature field were performed for one annual cycle without considering free water in the profile (negative ice firn/ice temperatures). Next, for the simulation of freezing-front penetration, free water was inserted into the top grids by introducing meltwater into each grid until all the meltwater was consumed. For determination of the potential SI formation we assumed that free water was always available for freezing at the SI surface and that the SI formation takes place at the previous year’s summer surface Reference Benson(Benson, 1962).
Figure 5 shows the SI and RF gradients in comparison with the precipitation distribution. It is evident that the SI potential has a downward trend from west (around 0.6 m) to east (around 0.2 m), and approximately correlates inversely with accumulation. Since the climate gradients are elevation-dependent, the east–west SI gradient cannot be explained by climate, but more likely by the insulating effect of winter snow. Generally, the SI potential only reduces to little less than average around the summit of the transect, despite the fact that the number of melting days reduces from >100 at the outermost points to 6 days at the summit point. Furthermore, low-density profiles should be less favorable for SI formation due to the lower thermal diffusivity. But, the lower air temperatures at highest elevation seem to compensate for the shorter melting
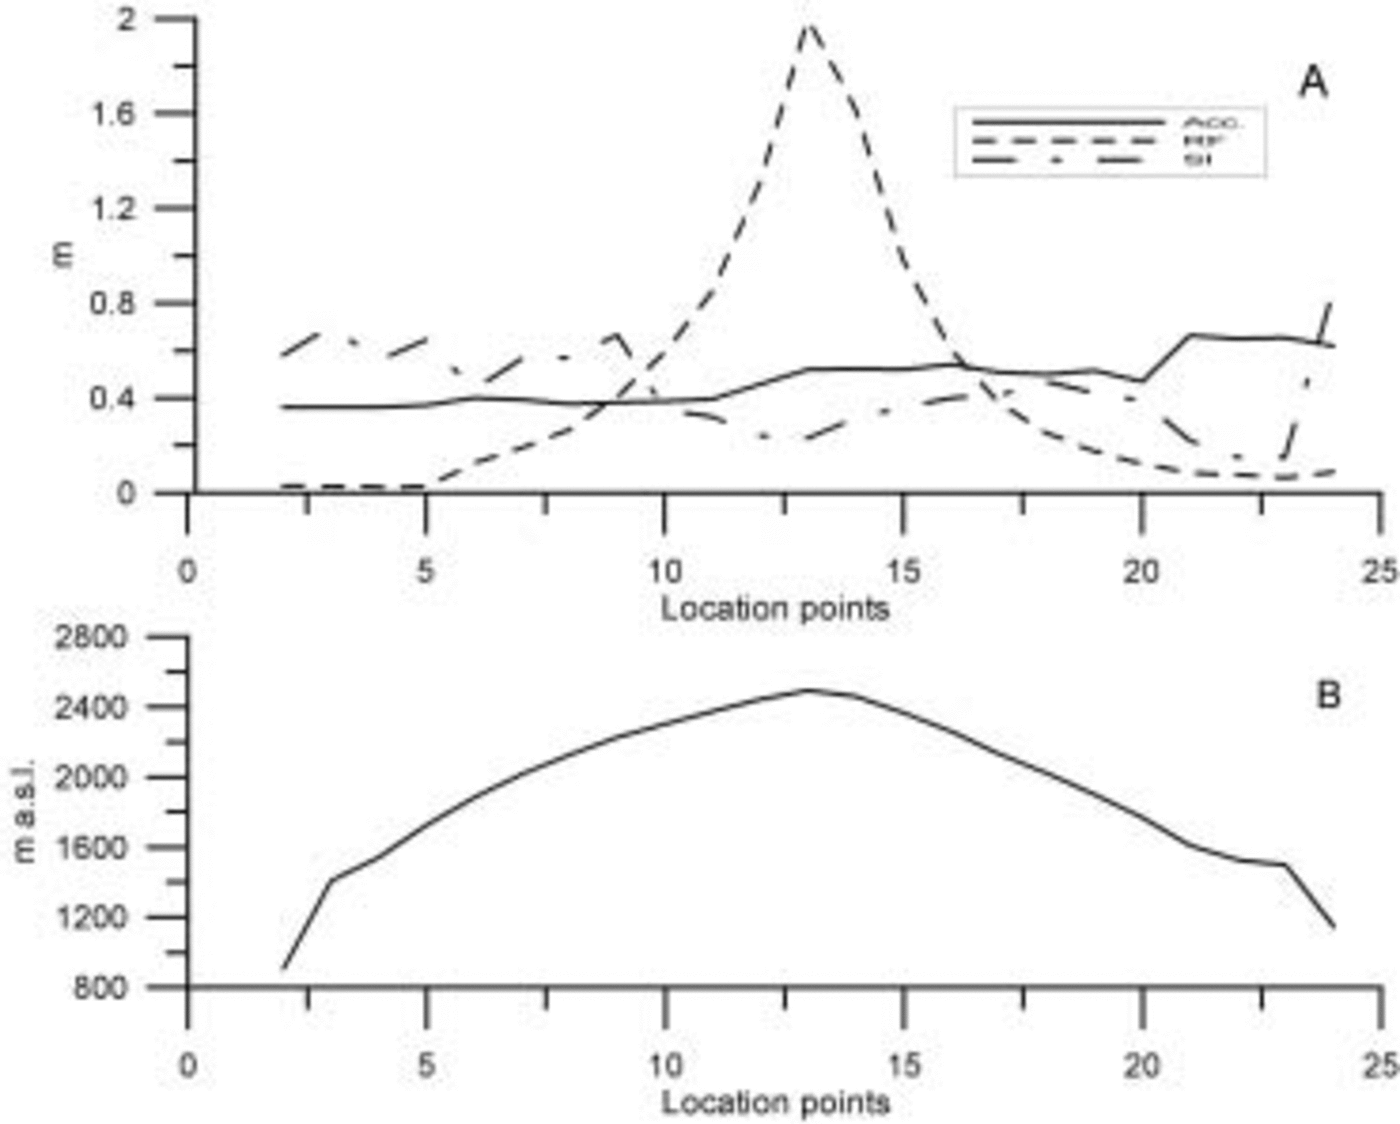
Fig. 5. (a) Retention components (SI and RF) plotted together with accumulation rates. (b) The altitude distribution along the transect.
duration and lower thermal diffusivity at the summit point.
The lack of RF at the western flank of the transect results from the fact that the winter snow is deposited on top of solid ice and this snow is removed later in the summer by melting. On the eastern flank of the transect, higher accumulation rates result in some porous firn below the winter snow. The parameterization of vertical firn-density profiles as a function of melting rate results in a nearly exponential rise in RF toward the summit region. An RF potential of nearly 2 m at point 13 is only possible if all porous firn throughout the profile is exposed to a temperature rise to the melting point during the summer of melting, which is not the case.
The total retention potential (SI + RF) is shown to exceed the ablation over most of the ice-sheet transect (Fig. 6), which is not surprising since 10m ice temperatures have been observed to be well below the melting point Reference Reeh(Reeh, 1991). Since the sum of SI and RF (total RTN) represents the total meltwater retention, the locations where total RTN and ablation cross represent the lowest theoretical position of the runoff line on the ice sheet. It can be seen to vary from ∼1400ma.s.l. in the west to ∼1600ma.s.l. in the east. Again the west–east contrast reflects the general accumulation gradient, which results in less winter firn cooling and deeper firn warming from summer percolation in the east.
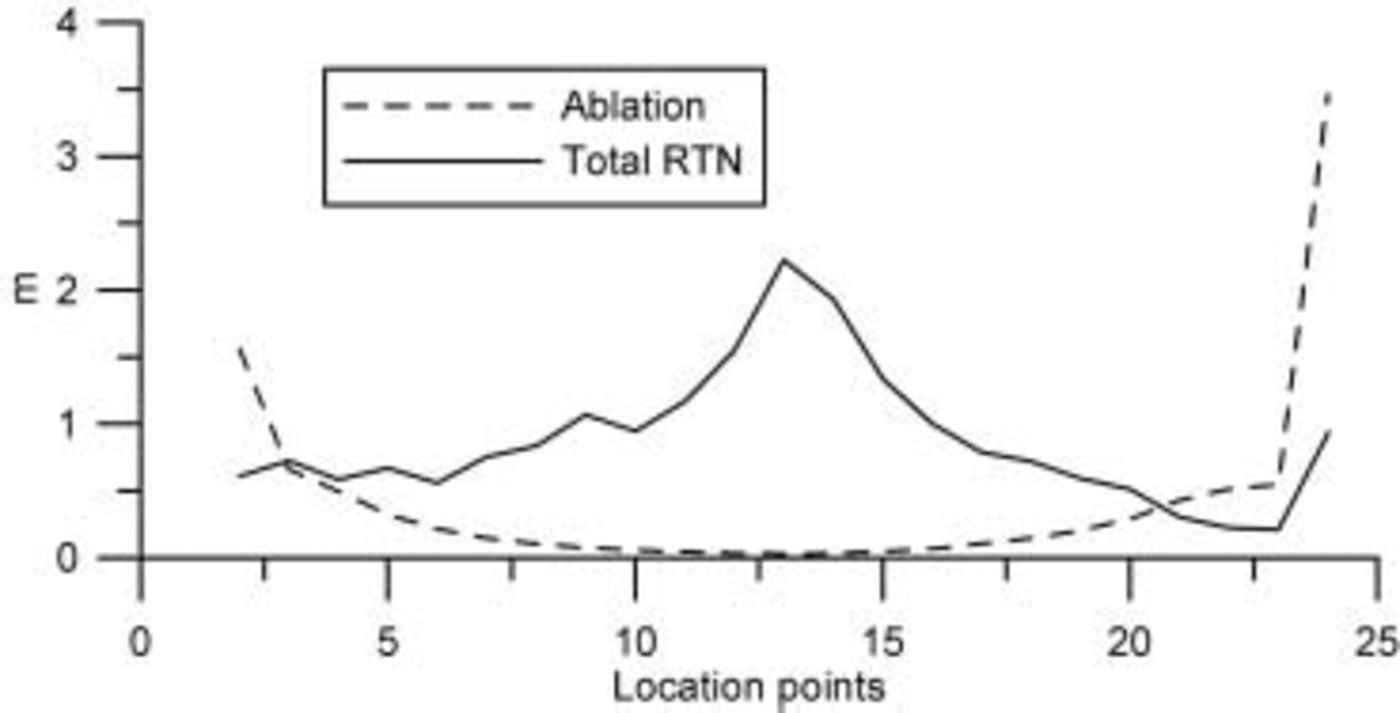
Fig. 6. Ablation and total retention (SI + RF) along the transect.
Discussions and Conclusions
Treatment of meltwater retention potentials has revealed that the lowest theoretical runoff lines could be determined as ∼1400ma.s.l. in the west and ∼1600ma.s.l. in the east. Both SI and RF are directly controlled by winter climates. A term in this budget which theoretically is independent of the winter climate is the ability of the firn to retain meltwater against gravity: the irreducible water content, which has been determined to be 3% of the pore space (Reference BøggildBøggild, 1990). The potential storage by this term is shown in Figure 7 and constitutes <˚% at most and some 4% on average of the total RTN. This underlines the fact that the winter climate almost entirely controls the meltwater retention of the ice sheet. Furthermore, this winter climate is believed to react more strongly to a changing greenhouse climate than does the summer climate.
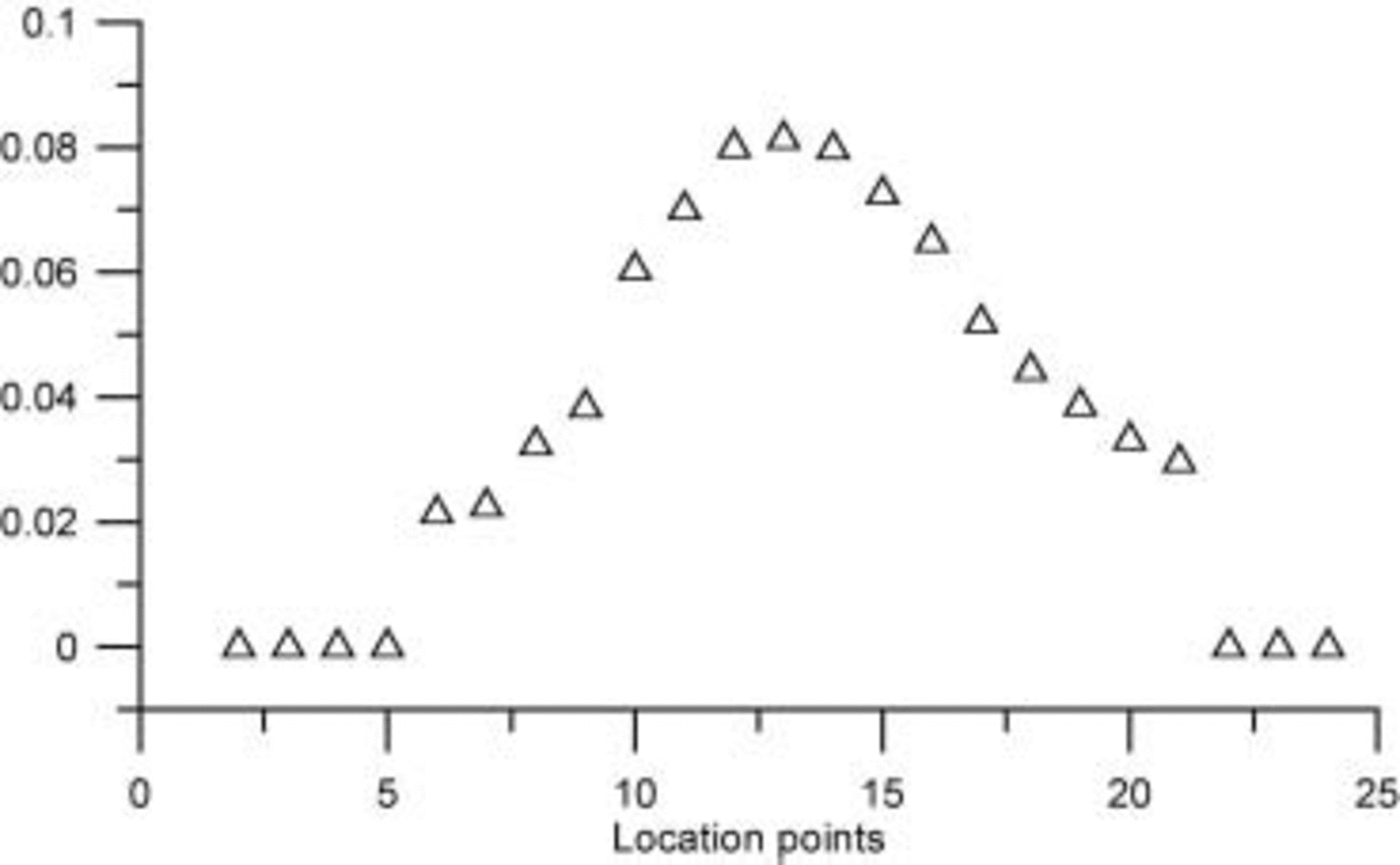
Fig. 7. The fraction of irreducible pore water in relation to the total retention.
SI formation and meltwater refreezing can be considered competing processes preventing each other from developing to a full extent. In addition, SI is not significantly lower near the summit of the transect, which likely prevents significant deep-water infiltration and refreezing in the interior of the ice sheet. Hence, most of the warming is nearest to the surface (where the SI forms), resulting in a large temperature gradient during winter and a recharging of the cold content. This again means that despite some higher than normal summer melt, as has been documented recently (Reference Abdalati and SteffenAbdalati and Steffen, 2001), this is unlikely to result in a proportional increase in run-off or a reduction in the retention capacity of the ice sheet.
At the transect summit, the high SI formation potential reduces the chances of deep meltwater penetration to a depth beyond the penetration depth of a winter freezing front. The combination of a downward movement due to ice flow and the freezing-front position above the percolation front would eventually lead to temperate firn and ice conditions at depths beyond the annual temperature cycle. If this were the case, more of the ice sheet could become temperate, with runoff nearly matching surface ablation. It can therefore be stated that the high SI potential partly serves as a runoff buffer to a warming of the summer climate.
Another point related to the high SI potential is that, as opposed to nearly instant grain-to-water freezing associated with RF, the SI is significantly time-dependent. However, the non-linear time dependence is seen in Figure 8 where the SI formation rate is significantly faster in the early stage, meaning that the full SI potential is likely not used since sufficient free water is not available early in the melt season. This is particularly pronounced at high altitudes, where melting is scarce and the SI potential is highest.
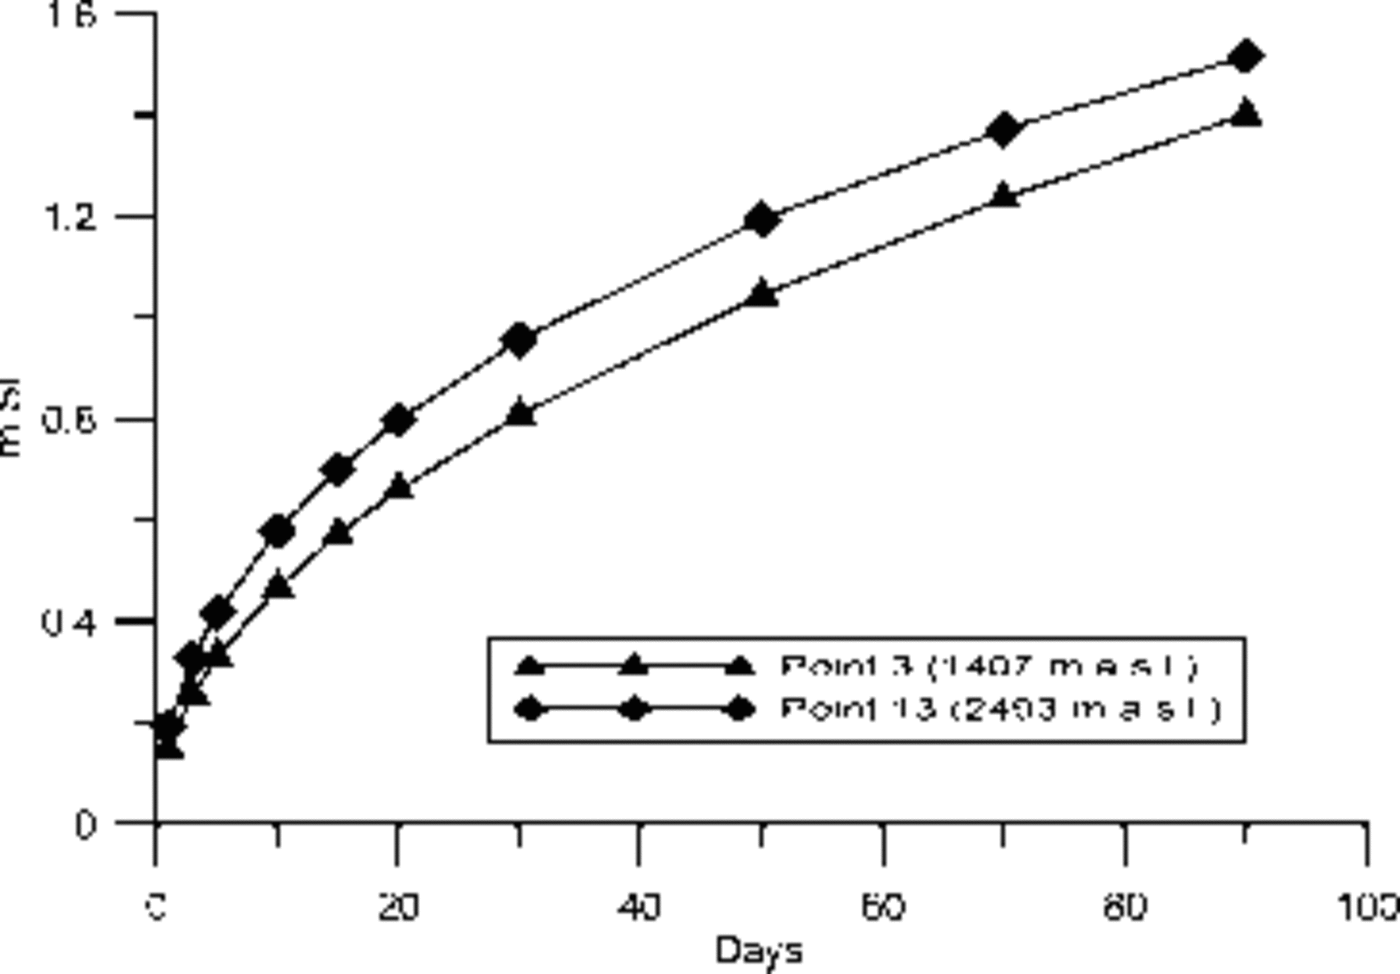
Fig.8. SI formation rates at two points in the transect (point 3 at the western flank) and the highest point (13).
Since SI formation is highly time-dependent and SI rates decline with time, an extension of the melting season could likely stimulate runoff, more than would be the case with only an increase in melt rates. This critical length of the melting season can conveniently be determined by means of remote-sensing methods (Reference Abdalati and SteffenAbdalati and Steffen, 1997).
Acknowledgements
This work was supported by the Danish Environmental Protection Agency under the program ‘Danish Cooperation for Environment in the Arctic – Dancea’, and by the Danish Natural Science Foundation for the projects ‘CryoSat’ and CryoGreen. Reviewers are thanked for their constructive criticisms and useful suggestions.


