Introduction
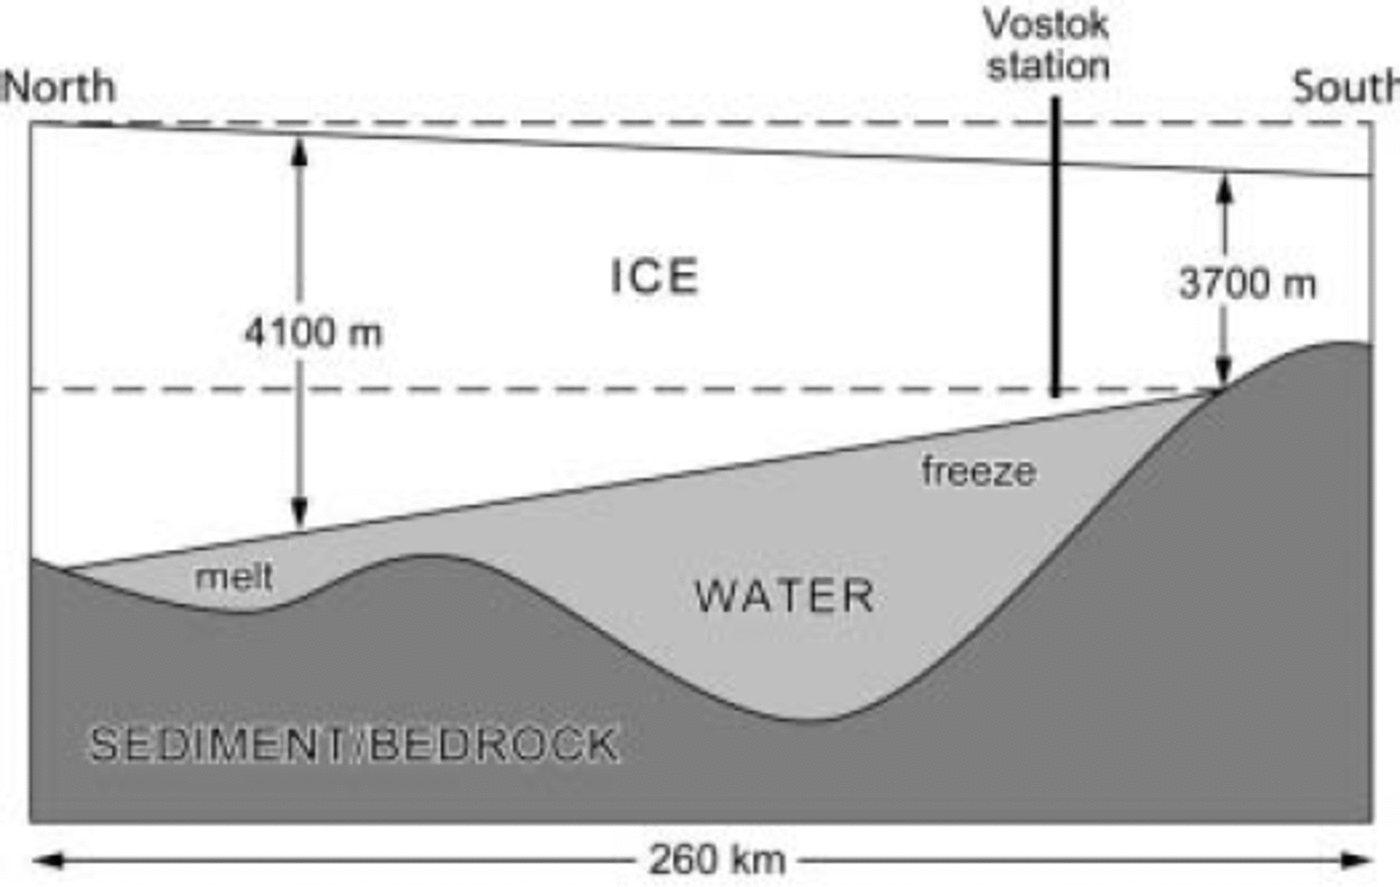
Vostok lake is the largest of more than 100 lakes identified beneath the Antarctic ice sheet (Reference Siegert, Dowdeswell, Gorman and McIntyreSiegert and others, 1996; Reference PriscuPriscu and others, 2003). The lake is up to 260 km long and 80 km wide (Reference Tabacco, Bianchi, Zirizzotti, Zuccheretti, Forieri and la VedovaTabacco and others, 2002), with a volume calculated to be 5400 km3 (Reference Studinger, Bell and TikkuStudinger and others, 2004). The liquid water results from melting of the overlying ice sheet in the north where it is sufficiently thick for the basal ice to reach the pressure-melting point (PMP). Melting is thought to be approximately balanced by the refreezing of lake water to the underside of the ice sheet in the south, where ice is not thick enough to reach the PMP (Fig. 1). Melt and freeze rates are estimated to vary from a few millimetres to a few centimetres per year (Reference Siegert, Kwok, Mayer and HubbardSiegert and others, 2000; Reference Bell, Studinger, Tikku, Clarke, Gutner and MeertensBell and others, 2002). An ice core has been drilled to 3623 m depth in the southern part of the lake at Vostok station by the Russian Antarctic Expedition. The top portion of the core is composed of glacial ice (referred to as meteoric ice) formed from surface snow accumulation, providing a detailed palaeoclimate record spanning >400 000 years (Reference PetitPetit and others, 1999). Below 3539 m, dramatic changes in the δD and δ18O signatures, gas content, crystal size and electrical conductivity suggest that the ice comprises lake water which has refrozen to the underside of the ice sheet (Reference JouzelJouzel and others, 1999). This ‘accreted ice’ has been used by several workers to infer the physical, chemical and biological properties of the lake (e.g. Reference PriscuPriscu and others, 1999; Reference SiegertSiegert and others, 2001, Reference Siegert, Tranter, Ellis-Evans, Priscu and Lyons2003; Reference Souchez, Petit, Jouzel, de Angelis and TisonSouchez and others, 2003).

Fig. 1. A simplified north–south cross-section of Vostok lake showing the melting and freezing areas. The thick vertical line represents the Vostok ice core. others, 2002).
Particulates in the Ice Core
The glacial ice contains a record of debris blown onto the surface of the East Antarctic ice sheet between Vostok station and the ice divide, presently Ridge B to the west. This fine dust is a mixture of extraterrestrial particulates (micrometeorites and cosmic dust) and terrestrial dust and biota that probably originated from the Patagonian plain of South America during past glacials and interglacials (Reference Basile, Grousset, Revel, Petit, Biscaye and BarkovBasile and others, 1997). Dust particle concentrations and sizes from the surface to 3550 m depth have been determined using a Coulter Counter (Simo∽es and others, 2002; Reference Souchez, Jean-Baptiste, Petit, Lipenkov and JouzelSouchez and others, 2002). To depths of 3346 m, particle concentrations alternate between those typical for interglacial periods (∼53 ppb by volume) and those typical for glacials (∼310 ppb by volume). There is evidence for particulates scoured from the bedrock between 3450 and 3539 m, characterized by a shift in the modal particle diameter from 2.1 μm to 3.4 μm, and by the presence of aggregates as large as 30 μm, larger than might be expected from aeolian transport (Reference SimôesSimoes and others, 2002; Reference Souchez, Jean-Baptiste, Petit, Lipenkov and JouzelSouchez and others, 2002). Such material could be released into Vostok lake when ice melts, predominantly over the northern third of the ice–water interface (Reference Studinger, Bell and TikkuStudinger and others, 2003). The accreted ice is almost devoid of dust (<50 ppb), although only one sample has been analyzed to date (Souchez and The number of larger ‘inclusions’ in each metre of core has also been counted (Reference Souchez, Jean-Baptiste, Petit, Lipenkov and JouzelSouchez and others, 2002). These inclusions are reported to reach a few mm in diameter and ‘mainly consist of a rock core on which dirt particulates are attached’. The distinction between ‘rock’ and ‘dirt’ is not made by the authors. The number of inclusions is negligible throughout the glacial ice, including the deformed portion (3310–3539 m), but increases dramatically in the top part of the accreted ice (to <30m–1) before returning to <10m–1 by ∼3585 m. Inclusion numbers are highly variable within each of these sections (Reference Souchez, Jean-Baptiste, Petit, Lipenkov and JouzelSouchez and others, 2002, fig. 3). These inclusions are not present beyond 3609m (Reference Souchez, Petit, Jouzel, de Angelis and TisonSouchez and others, 2003).

Fig. 3. Scanning electron microscope image of particulates from accreted ice (3548 m). The particulates range from rounded to very angular.
Two mechanisms have been proposed for incorporating particulates into the accreted ice. The first idea is that the ice sheet ‘scrapes’ over the western shore, eroding bedrock particulates that can be trapped as the first accreted ice forms here. As the ice sheet moves over deeper, cleaner water, fewer particulates will be present at the freezing front (Reference JouzelJouzel and others, 1999; Reference Souchez, Jean-Baptiste, Petit, Lipenkov and JouzelSouchez and others, 2002). Reference Souchez, Petit, Tison, Jouzel and VerbekeSouchez and others (2000) put forward a ‘double diffusion’ hypothesis to explain how coarser particulates (<∼1 mm) could be incorporated into the accreted ice. They hypothesized that glacial melt, warmer and less saline than the lake water, would lose heat and gain salts by diffusion. Since the diffusion of salt is an order of magnitude slower than heat, the meltwater would supercool and then freeze around any particulates present. In theory, this mechanism can incorporate larger particles than over the main body of the lake because it does not require them to be suspended in the water column. This explanation requires both melting and freezing to occur at the same place, which disagrees with our current conceptualization of the system (Fig. 1), although we cannot rule out the possibility of small-scale melting and refreezing at the ice–water interface.
The second mechanism is the scavenging of particulates from the bed or water column by anchor ice and frazil ice crystals respectively. Anchor ice and frazil ice crystals could be formed in the lake under weakly saline conditions (0.1–1%) in supercooled meltwater plumes (Reference Souchez, Petit, Jouzel, de Angelis and TisonSouchez and others, 2003), and can theoretically carry 0.1 kg L–1 of sediment in a neutrally buoyant ice–sediment mixture, assuming ice and water densities of 0.9 and 1.0 kg L–1 respectively. The ice crystals can nucleate around a particulate or can collide and adhere to particulates as they float upwards. This idea is tentatively supported by the high proportion of micas in the accreted ice compared to typical crystalline and metamorphic rocks (Reference PriscuPriscu and others, 1999), since the geometry of mica crystals allows them to be suspended more easily (Reference Souchez, Petit, Tison, Jouzel and VerbekeSouchez and others, 2000).
Understanding the process of particulate inclusion into accreted ice can provide important information on the physical conditions in the lake. For example, changes in the particulate concentrations through the accreted ice may have been caused by changes in the circulation of water. The presence of organic material within the accreted ice has also been used to help infer biological conditions within the lake (Reference Karl, Bird, Bjorkman, Houlihan, Shackelford and TupasKarl and others, 1999; Reference PriscuPriscu and others, 1999). However, variations in particulate concentrations may be an artefact of an inclusion mechanism that depends on water depth (since the accreted ice builds up as the ice sheet moves over the lake), or variable freezing rates that lead to varying efficiencies of particulate incorporation at the freezing front. The higher particulate concentrations in the accreted ice which form near the western shore could be explained simply by the higher accretion rate that is observed here than above deeper water (Reference Bell, Studinger, Tikku, Clarke, Gutner and MeertensBell and others, 2002; Reference Tabacco, Bianchi, Zirizzotti, Zuccheretti, Forieri and la VedovaTabacco and others, 2002).
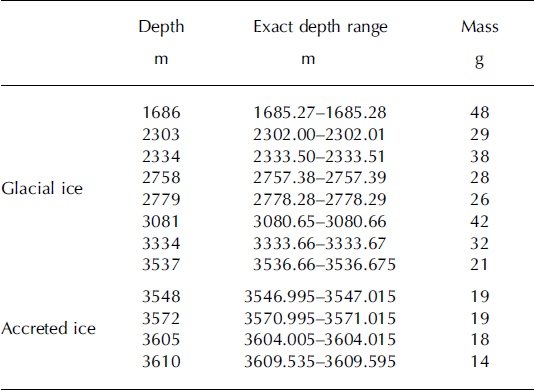
In this paper, we characterize the size and shape of particulates in both the glacial ice and accreted ice using scanning electron microscopy (SEM). This technique, unlike the Coulter Counter or laser diffraction, allows the shape of particulates to be directly measured, and aggregates (several particulates stuck together) to be identified. By comparing the size distributions in eight depths of glacial ice and four depths of accreted ice (see Table 1), we look for evidence for the two proposed mechanisms of particulate inclusion.
Table 1. Exact depths and masses of Vostok ice-core samples

Methods
Samples of ice were cut from each ice core (depth) with a band-saw housed within a –10˚C walk-in freezer, and at least 1 mm was scraped from the outer surface to remove contamination that might have been added by handling the core in the field and the laboratory. The ice samples were thoroughly rinsed with 0.2 μm-filtered water at –20˚C in a Class 100 Purifier Horizontal Clean Bench (Labconco Corporation, model 36125) and placed in clean glass beakers. The ice was melted at room temperature to yield >15mL of melt, and, once melted, a 10mL aliquot was filtered through a small area (5mm diameter) of a 0.2 μm polycarbonate filter. The filter apparatus, beakers and instruments used to handle the samples were rinsed three times with 0.2 μm-filtered water. Filtering and sample mounting for the SEM took place under a Bioguard laminar-flow hood (Baker Company, model B6000-1) which eliminates 99.99% of particulates <0.3 μm in the atmosphere. Clean gloves were worn throughout sample collection and preparation. To check for contamination in the laboratory, a ‘blank’ ice core was prepared from 0.2 μm-filtered water frozen in a clean plastic tube. This artificial core was cut, cleaned, melted and filtered in the same way as the ice core from Vostok station, serving as a control for potential contamination at all stages of sample collection and preparation.
Secondary electron images were collected at ×500 magnification using a JEOL 6100 scanning electron microscope for five randomly chosen fields of view on each filter. These images were loaded into an image analysis package (SigmaScan Pro 5) in which the outlines of particulates on each image were semi-automatically traced. From these traces the following measurements were made automatically: (i) major axis length (Mal), (ii) minor-axis length (mal), (iii) surface area (A) and (iv) perimeter (P). The aspect ratio (mal/Mal) and compactness (4πA/P 2) were calculated for each particle from these basic measurements. The measure of compactness is defined such that a perfect circle has a value of 1.0 and a rod has a value nearer 0.0, which is useful when checking the assumptions of Stokes’ settling law (see later).
Relatively few particulates can be measured with the SEM method because collecting images and tracing individual particulates takes considerable time. Hence we examined the sensitivity of size and shape averages to the number of particulates measured to prevent unrepresentative sampling. Averages were calculated using 10, 20, 40, 80 and 120 particulates randomly chosen from a total set of 270 in one sample. We found that the averages reach asymptote when approximately 100 random particulates have been measured. For each subsequent sample, 99–286 particulates were traced for each field of view, depending on the number of particulates present and whether or not particulates could be successfully traced (e.g. particulates obscured by other particulates and those extending beyond the field of view could not be traced).
Results and Discussion
The blank ice-core filters contained <10 particulates per field of view, which represents <20% of the lowest concentration of particulates observed in any of the samples, indicating that our data were not compromised by contamination. Means, maxima, minima and the standard deviations of the sizes and shapes of particulates measured in glacial and accreted ice samples are given in Table 2.
Table 2. Summary of sizes and shapes of particulates in glacial and accreted ice samples

The distribution of major-axis lengths (Mal) is similar for the glacial and accreted ice (Fig. 2a and b). The Mals of particulates in the glacial ice are not significantly different from those in the accreted ice (two-sample t test, p 0.667). We caution that the average lengths and areas we present are only representative of particulates >∼1 μm at the magnification we used (×500); our comparisons relate to this size only. The distribution of two-dimensional shapes of particulates is strikingly similar in the glacial ice and accreted ice (Fig. 2c–f); the majority of particulates have aspect ratios close to 0.7 and compactness values around 0.8 (Table 2). This is indicative of the ‘compact’ nature of most of the particulates, although they range from well rounded to very angular (Fig. 3). The difference between the aspect ratios of particulates in the two ice types is not significant (two-sample t test, p = 0.909), whereas the difference in their compactness is significant (two-sample t test, p = 0.017). Within the accreted ice the size and shape of particulates does not vary much between the different samples (Fig. 2b, d and f).

Fig. 2. Major-axis-length, aspect-ratio and compactness distributions, respectively, for glacial ice (a, c, e) and accreted ice samples (b, d, f).
Similar size and aspect-ratio distributions for the glacial ice and the accreted ice lead us to believe that material entering the lake when ice melts above the northern end is circulated in the lake before being incorporated into the accreted ice below Vostok station. This is consistent with the predicted net transfer of water from north to south in the lake, regardless of whether the water is fresh or saline (Reference SiegertSiegert and others, 2001). However, the small, but statistically significant, decrease in compactness in the accreted ice suggests an additional source of more angular material. This could be glacial erosion of the bedrock upstream of the lake, or could be the result of more angular material being deposited on the surface of the ice sheet prior to ∼600 kyr BP. Similar size and shape distributions for the different depths of accreted ice can be most simply explained by a single process incorporating the majority of particulates from the same source into the ice column.
Stokes’ Settling Model
To understand how particulates might behave once they enter the lake, we produced a simple model based on Stokes’ settling law. Stokes’ law relates the settling velocity of a particle (U s) to the second power of its linear dimension (r 2). A parameter that depends on the properties of the fluid and particle material (but not particle size) is included (B), as is a shape factor (α) (Reference LermanLerman, 1979)
The B parameter is calculated as follows:
where g is acceleration due to gravity (9.81ms–1), ρ s is the density of the particle (kgm–3), ρ is the density of the fluid (kgm–3) and η is viscosity (kgm–1 s–1). If Vostok lake’s water is fresh, as indicated by indirect measurements of its conductivity (Reference Gorman and SiegertGorman and Siegert, 1999), and ∼0˚C, then ρ = 1000 kgm–3 and η = 0.00179 kgm–1 s–1 (Reference LideLide, 2003). The settling velocities of particle sizes from 1 to 50 μm were calculated, assuming that particulates are spheres (α = 1.0) and have an average density of 3000 kgm–3, reflecting the high proportion of micas (75%) found at 3590 m (Reference PriscuPriscu and others, 1999). These sinking velocities were subtracted from 0.0003ms–1, an estimate of geothermally driven upward water velocities based on laboratory experiments (Reference Wüest and CarmackWüest and Carmack, 2000). A limitation of this model is that it ignores the potential effects of a boundary layer just below the ice–water interface. Such a layer may develop due to freezing-induced heating from above and the non-slip boundary condition required at the ice–water interface. This may prevent particulates reaching the accreted ice where the geothermal convection cannot reach the ice ceiling (Reference Wüest and CarmackWüest and Carmack, 2000).
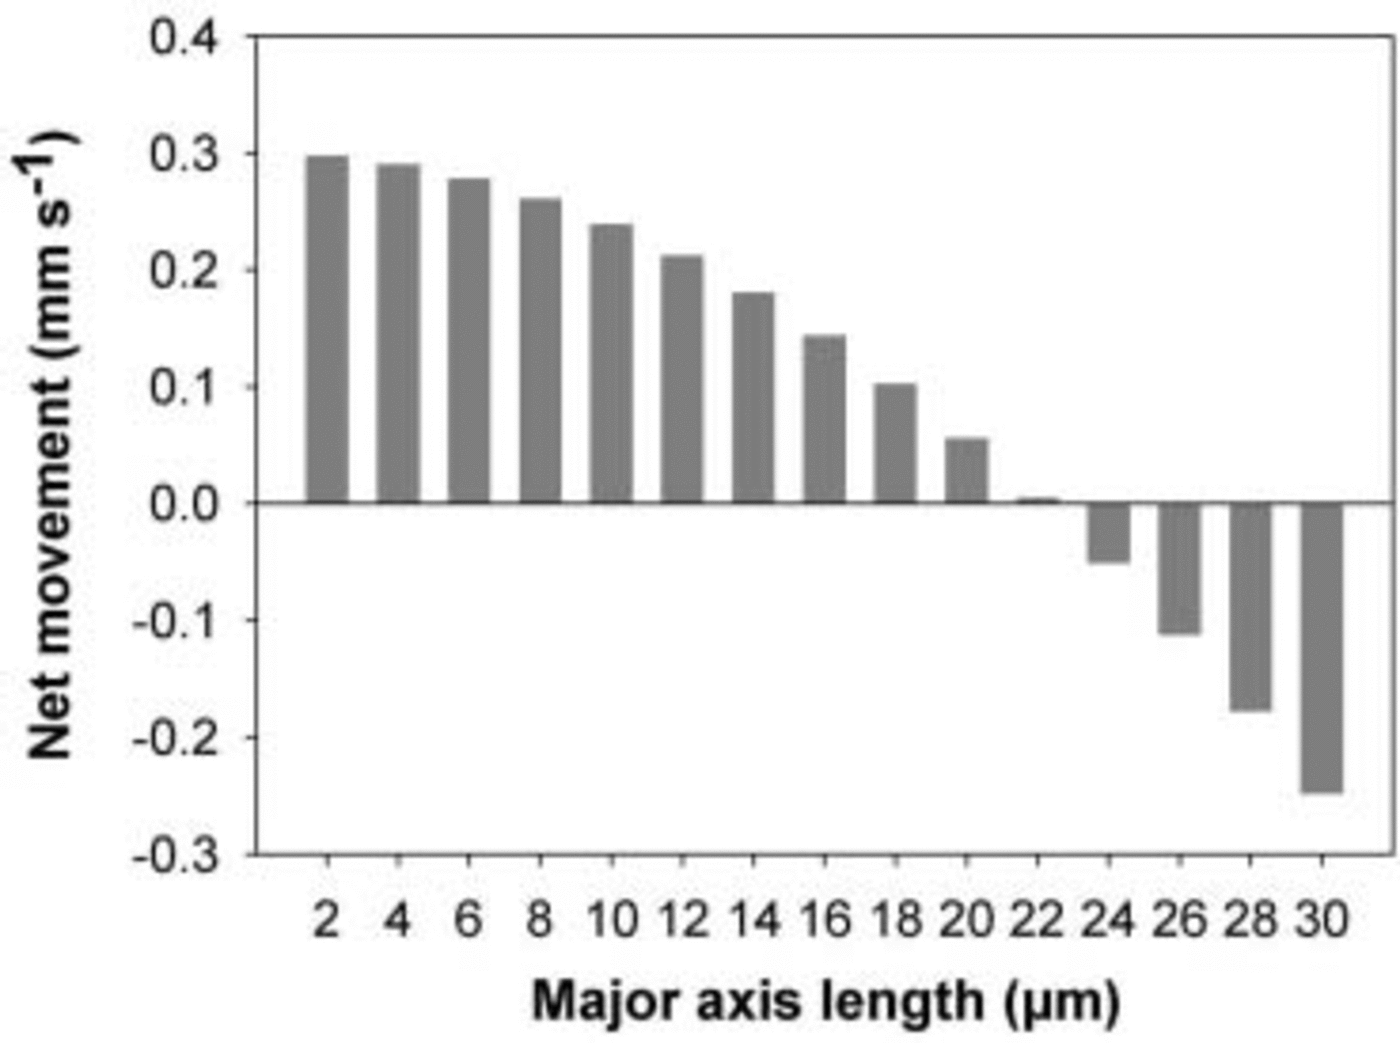
The model predicts that particulates with diameters <23 μm will remain suspended, and larger particulates will sink to the bed on time-scales of days to weeks (Fig. 4). We know from the SEM images that the particulates are not spheres (Fig. 3). However, a mean compactness of 0.8 suggests that this is a reasonable idealization for most of them. We also expect the particles in the glacial ice to be near-spherical since they have been transported by wind over >1000km (Reference Basile, Grousset, Revel, Petit, Biscaye and BarkovBasile and others, 1997). Non-spherical particulates create greater drag forces in the surrounding fluid, reducing the settling velocities we calculate. Tetrahedra with the same equivalent length as a sphere settle 3 times more slowly than a sphere, discs (broadside down) approximately 6 times more slowly, and vertical cylinders 20 times more slowly (Reference LermanLerman, 1979; note: these settling velocities refer to a disc where the ratio of the polar to equatorial semi-axes is small, and a long cylinder with a large height-to-base radius).

Fig. 4. Net vertical movement of different size particulates in the Vostok lake water column, assuming an upward water velocity of 0.3 mms–1.
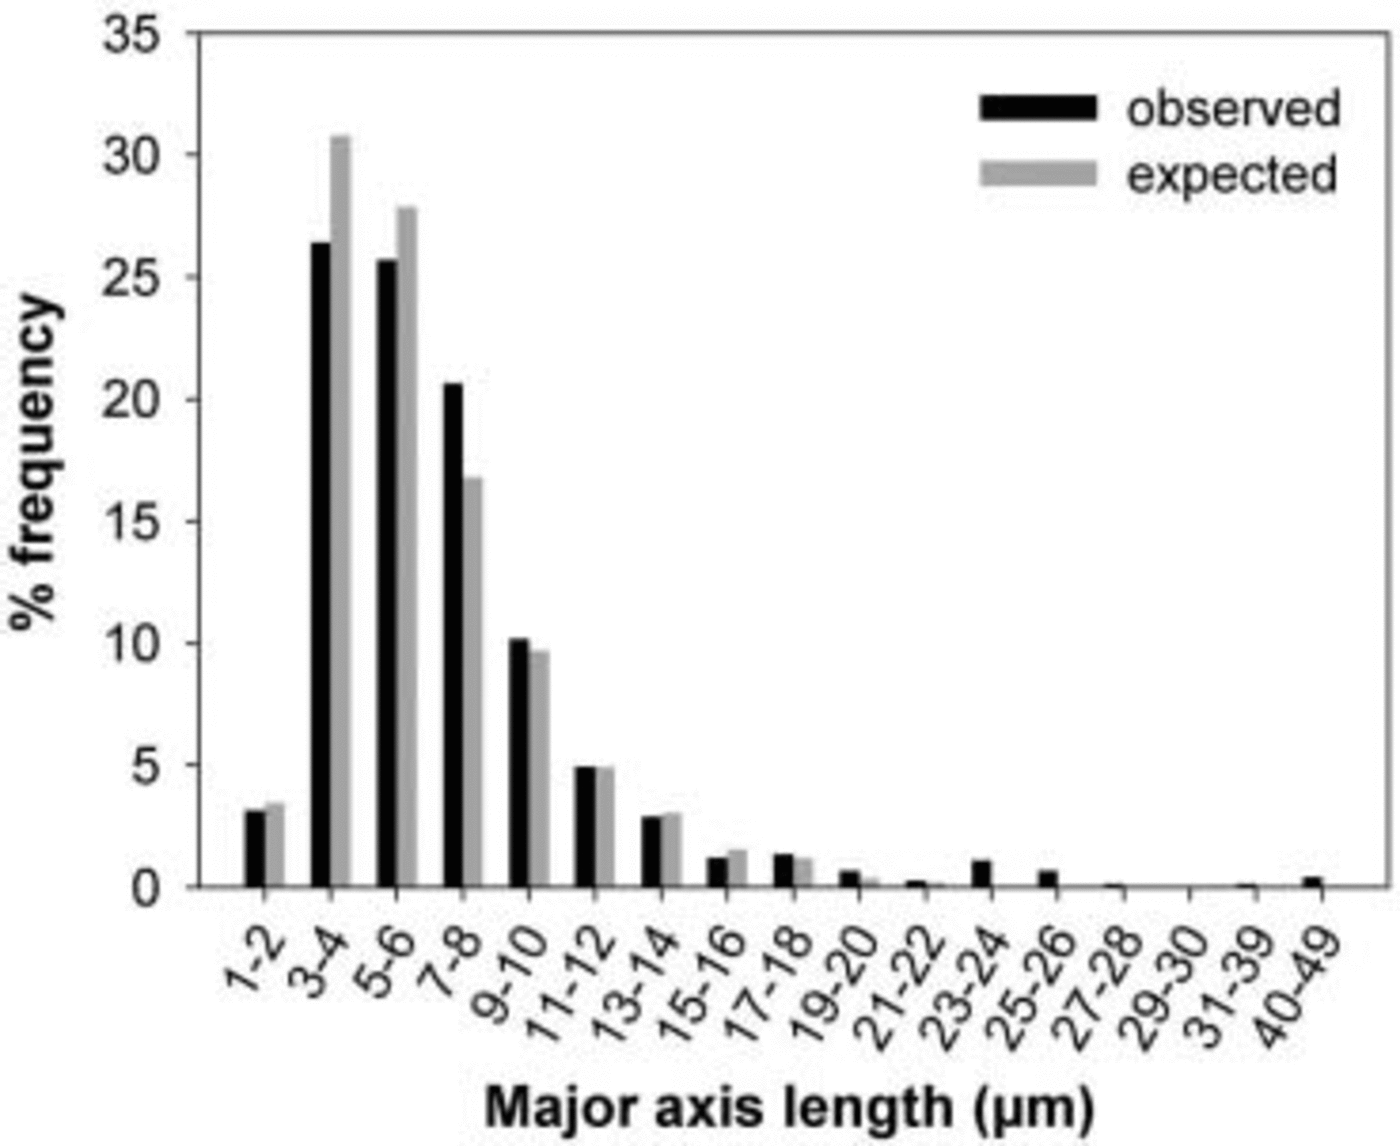
To test whether particulates entering Vostok lake in the north could be suspended at the ice–water interface in the south, where they are incorporated into freezing lake water, we assume that glacial ice containing particulates with a size distribution identical to that of particulates found in glacial ice in the core melts into the lake. We then compare the size distribution we expect to find in the accreted ice, given Stokes settling velocities, with measurements (Fig. 5). The prediction resembles the measured distribution very closely, with 98% of particulates in the accreted ice explained by their ability to ascend in the lake. A vertical water velocity of 0.0013ms–1 is needed to explain all particulates we observed in the accreted ice.

Fig. 5. Observed and expected particle size distribution in Vostok lake accreted ice based on Stokes settling velocities.
This result implies that particulates could be present at the ice–water interface across the entire width of the lake, and not just near the west shore and in shallow waters. These particulates would be engulfed by growing ice crystals at the lake ceiling, in the form either of a progressing freezing front or of frazil ice crystals that may or may not already be carrying particulates. Therefore, entrainment of particulates at the grounded lake shore is not necessary to explain debris particulates observed in the accreted ice. This is important for understanding conditions in the lake because it implies that mineral and organic (e.g. micro-organisms) particulates can be incorporated over any depth of water, not just at the shores. The presence of larger than expected particulates (2%), which most likely originate from the glacial ice (there is no visual evidence of larger particulates produced by coagulation of smaller particulates), and the uneven spatial distribution of particulates in accreted ice, may suggest periodic perturbations to the lake system in the past, such as a change in the lake’s circulation induced by net melting or freezing caused by ice-thickness or ice-flow direction changes (Reference SiegertSiegert, 2005) or episodic plumes in the lake. It may also be that some of the larger particulates in the accreted ice are non-spherical, such that they would settle more slowly. Particulates more than 23 μm are on average less compact than those less than 23 μm (0.58 vs 0.77). However, since this mean is based on only 14 measurements, we cannot be statistically confident that the larger particulates are less compact. Although our analysis is based on a discrete ice core, we do not expect large variations in wind-blown debris arriving over the Vostok lake catchment. Also, although the accreted ice was extracted at one location above the lake, it represents water frozen from different locations across the lake.
Conclusions
For the first time, particulates were quantified and characterized in glacial ice and accreted ice from above subglacial Vostok lake using scanning electron microscope images. Particulates range from <1 to 70 μm in the glacial ice and from <1 to 46 μm in the accreted ice, and mostly have compactness values close to 0.8. The distributions of sizes and shapes of particulates in the glacial ice are very similar to those in the accreted ice, suggesting a simple cycling of particulates through the lake, from the melting ice in the north to the accreted ice in the south. Calculation of Stokes settling velocities suggests that 98% of the particulates entering the lake can float to the ice–water interface if upward vertical water velocities are 0.0003 ms–1, such that neither the entrainment of particulates from the shore nor widespread scavenging by frazil ice crystals is required. Larger than expected particulates in the accreted ice can be explained by subtle changes in the lake’s circulation, the existence of plumes with higher velocities, scavenging by buoyant frazil ice crystals, or particle shapes that settle much more slowly than spheres.
Acknowledgements
Funding was provided by UK Natural Environment Research Council (NERC) grant NER/A/S/2000/01144 to M.T. and M.J.S. and a NERC Studentship NER/S/A/2002/10332 to G.R.-B. Work at Montana State University was supported by US National Science Foundation grant NSF OPP 00854000 to J.C.P. We thank D. Mogk for his help with collection of SEM images. We thank B. Hubbard, M. Sharp (associate editor) and an anonymous reviewer for their constructive comments on the manuscript.


