Introduction
The large-scale features of the earth’s climate result from the differential heating of the globe and the consequent poleward heat flow facilitated by the oceanic and atmospheric circulations. the net radiation budget at the top of the atmosphere in the tropics is positive, with the absorbed shortwave radiation (insolation) greater than the emitted longwave (infrared) radiation. even though the infrared emission to space is smaller in polar regions than in the tropics, the net top-of-atmosphere radiation budget at high latitudes is negative, with the emission outweighing the absorbed insolation on an annual basis (Reference PaynePeixoto and oort, 1992). polar atmospheres are therefore a major conduit through which the earth loses heat to space, primarily though infrared radiative transfer.
By modulating the surface and atmospheric heat losses, the presence and characteristics of polar clouds influence the efficiency with which the polar heat sink can function. throughout the polar regions, the surface heat budget is dominated by the radiative terms, the turbulent exchanges of sensible and latent heat at the surface being very much smaller. this is the case not only where the surface is frozen (Reference MinnettWendler and others, 1988), but also for summertime conditions over open water, such as arctic polynyas (Reference MinnettMinnett, 1995). over the summertime frozen ice surface of terre adélie, antarctica, Reference Spinhirne, Palm and HartWendler and others (1988) found the net radiative terms to be about eight times larger than the turbulent exchanges, and a similar, but larger, factor was found over the ice and open water of the northeast water polynya off greenland by Reference MinnettMinnett (1995). uncertainties in the radiative terms therefore have large consequences on estimating the surface heat budget.
Of the two spectral constituents used in calculation of radiative forcing, the variability of the longwave (3–50 μm) component is small in comparison to that of the shortwave (0.3–3 μm) component (Reference Spinhirne, Palm and HartWendler and others, 1988; Reference MinnettMinnett, 1995; Reference Perovich, Grenfell, Light and HobbsPersson and others, 2002; Reference KeyKey, 2004), during the sunlit parts of the polar year. this is also true of the top-of-atmosphere radiation budget, where variations in the planetary albedo at high latitudes introduce fluctuations in the shortwave radiative fluxes many times greater than the variability in outgoing longwave radiation (Reference Wendler, Ishikawa and KodamaYamanouchi and charlock, 1997). during the polar night, the longwave cloud radiative effects constitute the entire radiative forcing at the surface, as the shortwave effects, which require solar illumination, are absent.
The influence of clouds in the global climate system can be couched in terms of feedback mechanisms that amplify or moderate initial radiative perturbations (e.g. Reference Persson, Fairall, Andreas, Guest and PerovichRamanathan and others, 1989). a positive cloud feedback is therefore one that leads to increasing surface temperatures, and a negative one to cooler conditions. the competing effects of cooling the polar surface by clouds scattering insolation andwarming the surface by increasing the incident infrared radiation are clearly seasonal in character, with the infrared warming being dominant in the dark winter months and when the sun is close to the horizon during the sunlit times of year (e.g. Reference MinnettMinnett, 1999). the cooling of the polar regions in summer by clouds is a negative feedback effect, as the increasing cloudiness attendant on a warmer, moister atmosphere leads to a reduction in the surface insolation. this cooling retards ice melt and therefore reduces the moisture available to the atmosphere from the liquid surface, leading to a decrease in the humidity available for cloud formation. the decreased rate of ice melt also has a negative feedback on the surface absorption of the insolation by slowing the rapidity with which the low-albedo open water surface replaces the high-albedo snow and ice during the melt season (Reference Curry, Schramm and EbertCurry and others, 1995). the high surface albedo over snow and ice can lead to positive cloud forcing (Reference Cogley and Henderson-SellersCogley and henderson-sellers, 1984; Reference Spinhirne, Palm and HartWendler and others, 1988), sometimes referred to as the radiation paradox (Reference AmbachAmbach, 1974).
Many publications describing measurements of cloud radiative forcing at the surface use net radiation, i.e. the difference between the incident and reflected or emitted components at the surface. this requires accurate knowledge of the surface albedo, as this determines the partition of the incident insolation into the reflected and absorbed components. over most of the world’s oceans this is a reasonable approach, as the surface albedo is small and rather uniform (Reference Pavlonis and KeyPayne, 1972), but over the polar oceans, albedo is highly variable and challenging to measure. there can be significant horizontal and rapid temporal changes in the surface reflectivity (Reference Peixoto and OortPerovich and others, 2002), especially as the surface begins to melt. during melting, the interstitial spaces in the snow grains fill with liquid water, and the bright surface of snow on ice becomes markedly darker (Reference Hanesiak, Barber, De Abreu and YackelHanesiak and others, 2001). this can happen over several hours as the surface temperature rises through the melting point. the net shortwave component of the surface cloud radiative-forcing determination is therefore critically dependent on the state of the surface, and the magnitude, even the sign, of the resultant net cloud radiative forcing is dependent on the surface albedo (Reference IntrieriIntrieri and others, 2002; Reference ShineShupe and intrieri, 2004). thus, when applied to polar regions, the use of the net cloud radiative forcing introduces a dependency on changes of the surface, which can be considered as a response rather than a forcing. to avoid such uncertainties, and to focus on the radiative effects of clouds themselves, we consider incident fluxes in this analysis.
Measurements of the incident radiation cloud forcing over the darker surface of open water at high latitudes show consistently negative values (Reference MinnettMinnett, 1999; Reference Hanafin and MinnettHanafin and minnett, 2001), while over fast ice where the surface has a high albedo, the influence of the low-albedo surface over the open water can still be felt, and the cloud forcing remains negative. over polar coastal areas the net cloud effects on incident radiative fluxes show a less pronounced dependence, and less non-linearity, on cloud amount (c. ananasso and others, unpublished data). the increase in incident shortwave radiation from spring through summer is a vital factor in the development of the seasonal cycle of the snow and ice cover, and its influence at the surface is determined by the surface albedo. as the snow and ice begins to melt, there is scope for a potential positive feedback mechanism because of the decrease in albedo both on the microscale as liquid water fills the space between snow grains, and on the macroscale as melt ponds develop. this decreases the surface reflectivity (Reference Hanesiak, Barber, De Abreu and YackelHanesiak and others, 2001) and increases the rate of absorption of solar energy and surface heating (Reference Curry, Schramm and EbertCurry and others, 1995).
The modulation of the surface insolation by clouds impacts not only the physical state of the surface, but also the biological productivity. ice algae are photosynthetically active well before the ice melts or breaks up (Reference Arrigo and Van DijkenArrigo and van dijken, 2004). the primary productivity below the ice is critically dependent on the availability of photosynthetically active radiation (par), which is greatly reduced by the presence of snow on the surface of the sea ice, and by cloud. the broadband surface insolation may be reduced by a factor of five by clouds (Reference MinnettMinnett, 1995), with a corresponding reduction in the par. this attenuation of par could negatively influence cloud formation, since the dimethyl-sulfide derivatives produced by ice algae during photosynthesis cross the air–sea interface into the boundary layer where they can serve as cloud condensation nuclei (Reference Leck, Tjernström, Matrai, Swietlicki and BiggLeck and others, 2004).
We present results of the analysis of measurements taken on a cruise of the r/v Aurora Australis in the austral spring (11 september–29 october 2003), on which meteorological, radiative and environmental observations were collected. an examination of the shortwave cloud forcing and its relation to the atmospheric and oceanic state is shown, while final results are couched in terms of bipolar applicability through comparisons with several arctic datasets.
Data and Methodology
In spring, when all aspects of the atmosphere–ice–ocean system are undergoing rapid change, continuous sampling of pertinent variables was conducted at 1 min resolution from an australian research icebreaker, the Aurora Australis, during the antarctic remote ice sensing experiment (arise). meteorological sensor arrays, cloud imagers, and observers from the australian bureau of meteorology provided the information with which to characterize the conditions present in the ice-free southern ocean, antarctic sea-ice pack and a coastal polynya (fig. 1). time-lapse imagery of the sea surface provided a record of the sea-ice cover and wave state, which complemented the 3 hourly observer records of wind waves, swell and icing conditions. this time series was also used to parse the remainder of the variables–air temperature, relative humidity, barometric pressure, wind and cloud – into general ice and weather regimes.
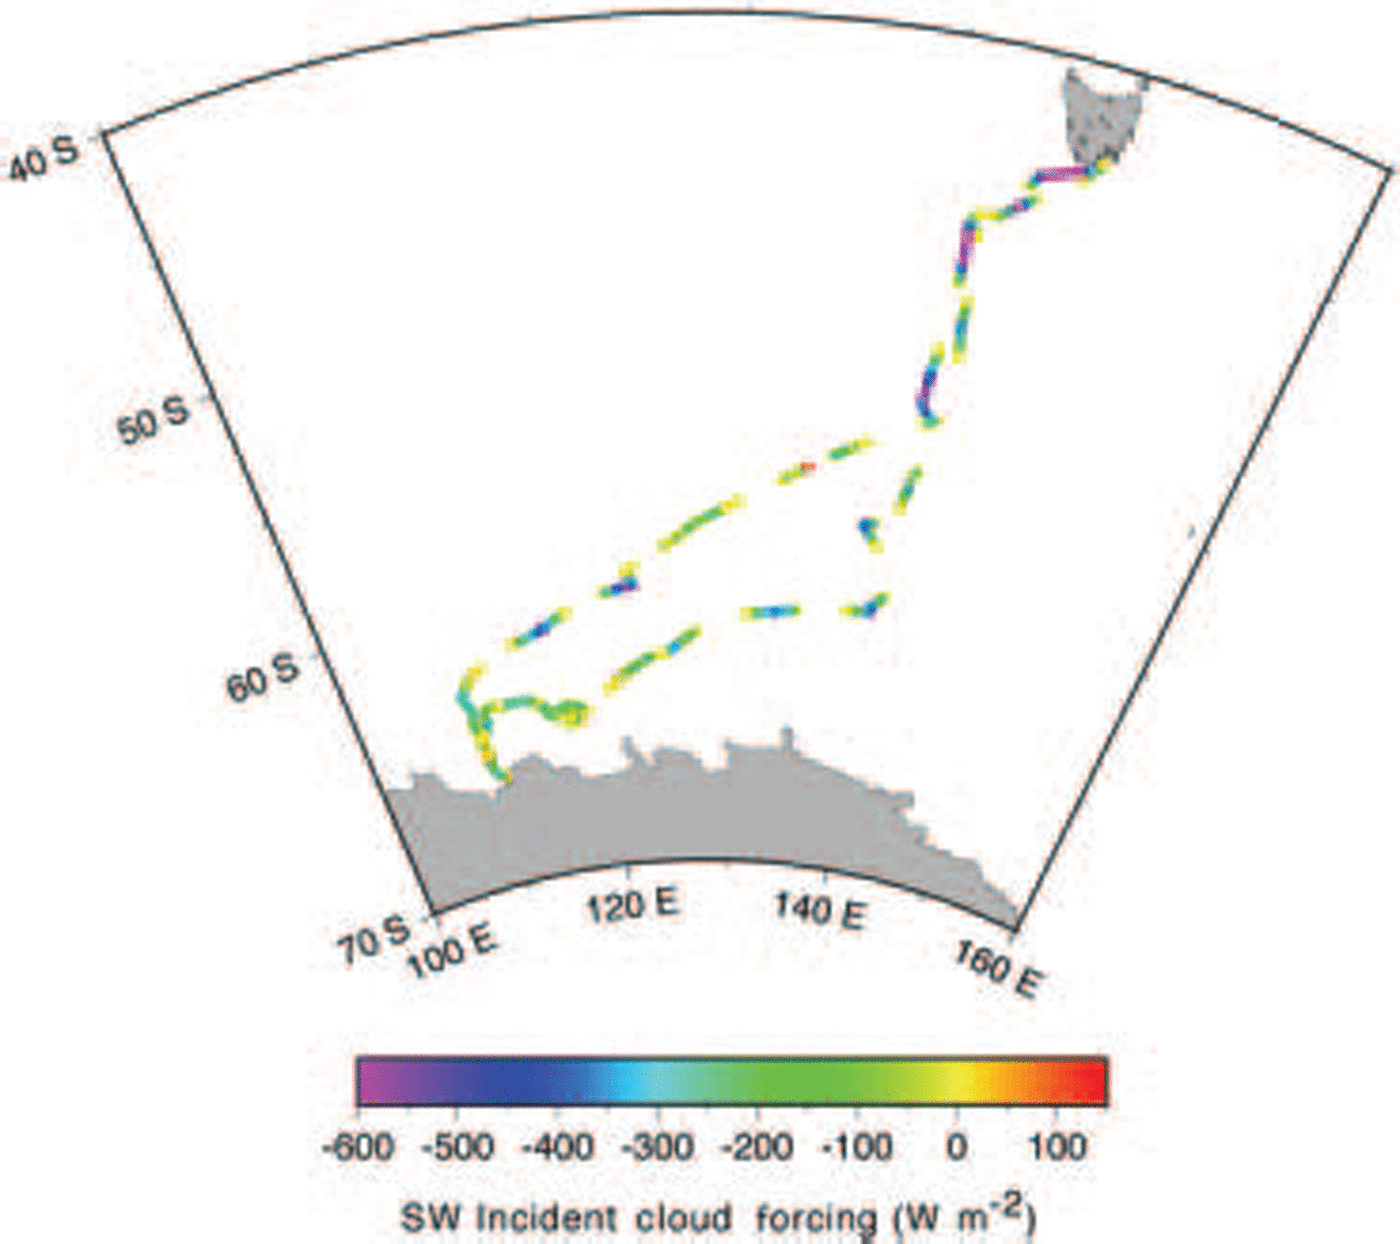
Fig. 1. The track of the R/V Aurora Australis, 11 September–29 October 2003. The color coding is indicative of the incident shortwave cloud forcing at the surface. The gaps in the track are attributable to the inclusion of only daytime measurements when the sun was above the horizon and clouds were readily discernible in the all-sky camera images. The Aurora Australis departed Hobart and entered the ice pack on 24 September at about 63˚ S, 125˚ E. The ship was off Casey Station on 18 October, and emerged from the ice on 24 October at about 60˚ S, 121˚ E in mostly open water.
For this study, we analyze the measurements of incident shortwave radiative flux provided by two eppley labs precision spectral pyranometers (psps) which were mounted on opposite sides of the ship above the bridge and maintained several times daily. the use of two sensors allows situations to be identified where one was shadowed by the mast or other parts of higher superstructure. in such cases, the higher, unshadowed, value was selected. when both instruments were free of shadowing, an average of the two simultaneous measurements was utilized. these sensors were not gimballed to remove the ship’s motion, but studies have shown that oscillatory motion of the ship does not contaminate the measurements to the same extent as mean tilts of the ship (Reference MacWhorter and WellerMacwhorter and weller, 1991), provided that the averaging period applied to high-frequency measurements is long compared to the period of the ship’s oscillatory motion. here we use 1 min averages of 1 s samples which fulfill this condition.
The images of the dome of the sky recorded by a time-lapse video system at intervals of 17 s were visually analyzed to determine the cloud types and amounts present. the analysis was done at 10 min intervals throughout the sunlit parts of the cruise (fig. 2). the cloud types were identified according to the world meteorological organization (wmo) guidelines for meteorological observers, and categorized into three layers (low, mid-level and high) according to cloud type. the time-lapse video provides information about the movement of the clouds, which can be very valuable in identifying multiple cloud layers, although in periods of extensive mostly overcast sky, the interpretation remains biased toward the lower cloud layer.
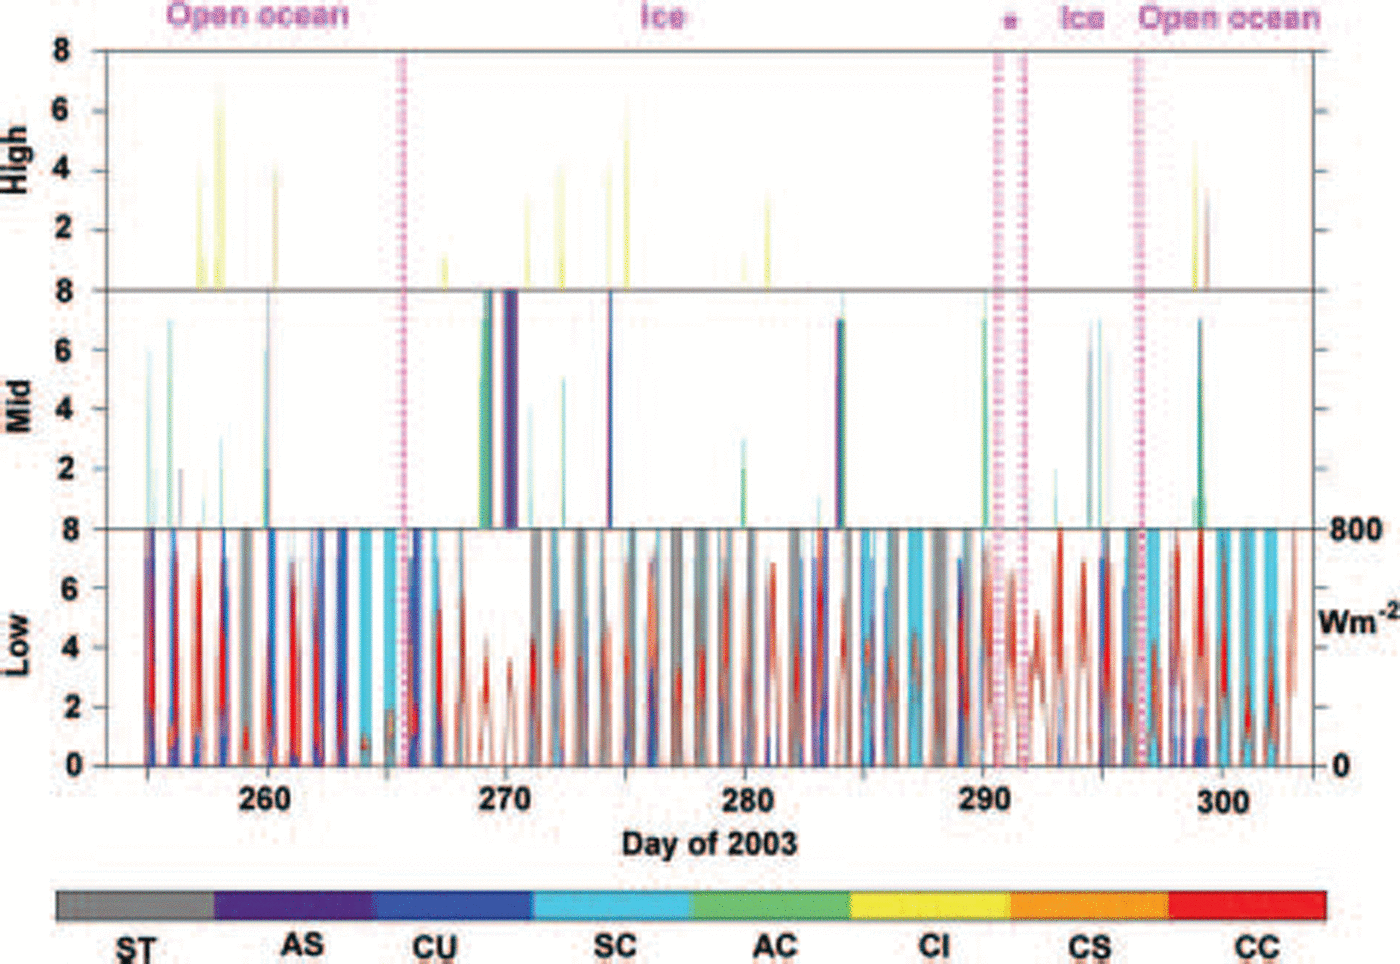
Fig. 2. Time series of cloud type and amounts derived from analysis of the all-sky camera images made at 10 min intervals for the entire sunlit portions of the cruise. The analysis is guided by the WMO cloud classification. Clouds are measured in oktas, where 1 okta is equal to 1/8 of the 2π hemisphere of sky. The cloud classification is: ST, stratus; AS, altostratus; CU, cumulus; SC, stratocumulus; AC, altocumulus; CI, cirrus; CS, cirrostratus; CC, cirrocumulus. The red trace in the lower panel is the measured insolation. The vertical dotted lines indicate the times the ship passed from one regime to another, as indicated by the labels at the top; the asterisk indicates the time the Aurora Australis was in the open water and patchy ice of Vincennes Bay off Casey Station. The times of the transitions between regimes, and the cloud-cover statistics are given in Table 2.
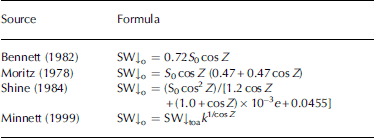
Following the analyses of Reference Hanafin and MinnettHanafin and minnett (2001) and Reference KeyKey (2004), the shipboard radiation measurements were used to evaluate polar-optimized clear-sky shortwave radiative parameterizations. four schemes were tested (Reference Moritz, Barry and JacobsMoritz, 1978; Reference BennettBennett, 1982; Reference RamanathanShine, 1984; Reference MinnettMinnett, 1999) (table 1), and that which incurred the lowest rms uncertainty for the entire cruise was employed in the calculation of surface shortwave cloud radiative forcing, C SW, with the Reference Persson, Fairall, Andreas, Guest and PerovichRamanathan and others (1989) equation:
Table 1. A listing of the clear-sky shortwave parameterizations evaluated. S 0 is the solar constant, Z is the solar zenith angle, e is the surface vapor pressure, SW#toa is the insolation at the top of the atmosphere (toa) taking into account changes in the Earth–sun distance, and k is the normal incidence cloud-free atmospheric transmittance
Where sw↓o is the parameterized incident shortwave flux at the surface under cloud-free conditions, and sw↓c the measured incident solar radiation under all conditions. minute-averaged forcing values were further analyzed in terms of variation with cloud type and amount as a function of solar zenith angle and compared against results published for arctic polynyas and ice stations.
Results
The weather observations indicate that this cruise provided a representative sample of antarctic variability. open water areas were characterized by variable cloud cover, which increased in amount as the ship approached the marginal ice zone. the transition into the ice was accompanied by large swell, cyclone activity, an increase in the occurrence of snowfall, and higher wind speeds. a drop in air temperature of >20 k was recorded between the open water north of the ice edge and within the ice pack. once in the ice, the average insolation was less, due in part to the shift from a stratocumulus-dominated environment to one with overcast stratus. gaps in the stratus layer provided glimpses of another complete cloud layer at mid-levels, composed of extensive altostratus and altocumulus. on a few occasions, the uppermost cloud layer was visible, consisting mostly of large amounts of cirrus. a quasi-diurnal (1–1.5 days) variation in wind speed was punctuated by three storms, which were responsible for the majority of precipitation, usually in the form of snow (not shown). coincident with the increase in multiple cloud layers was the appearance of warmer air temperatures, though never above freezing. as the ship approached casey station (66˚17' s, 110˚32' e) in the australian antarctic territories, a lull in cyclone activity allowed for safe passage into vincennes bay where the ice was patchy. low humidity and clear skies characterized the conditions within the bay, and air temperatures hovered near –10˚c. the return trip to hobart encountered only one snowstorm, just as the ship exited the ice pack. air temperatures increased northward across the southern ocean, and strong winds (∽20ms–1) were persistent; there was a moderate swell throughout.
Notes: Times are taken from the 3 hourly log of observations of the meteorological and ice conditions, which are used to partition the 10 min retrievals of cloud amounts from the time-lapse images of the all-sky camera.
Over the entire sunlit portions of the cruise, the observed cloud amount was 5.8±3.1 oktas (72.4±38.6%), where 1 okta is equal to 1/8 of the 2π hemisphere of sky, and when cloud was present the average amount was 6.7±2.2 oktas (83.8 ±27.6%). low cloud, when present, covered 6.6±2.4 oktas (83.1±29.6%). this conforms with measurements of cloud amount derived from the geoscience laser altimeter system (glas) on the ice, cloud and land elevation satellite (icesat) for the period of october 2003, coincident with the measurements made during the second part of the Aurora Australis cruise (Reference Shupe and IntrieriSpinhirne and others, 2005). for the region south of 60˚ s to the antarctic coast, glas retrievals indicated a strong dominance of low stratus and a total cloud occurrence of 60–100%. over the antarctic continent, cloud occurrence was reduced and cirrus became the dominant species. other satellite-based studies report similar dominance of low stratus and large cloud amounts seaward of the coastline (Reference Yamanouchi and CharlockYamanouchi and kawaguchi, 1992; Reference Wendler, Ishikawa and KodamaYamanouchi and charlock, 1997; pavo-lonis and key, 2003). similarly, surface-based cloud observations in the southern ocean show a high incidence (>80%) of clouds during the austral summer (Reference Hahn, Warren and LondonHahn and others, 1995).
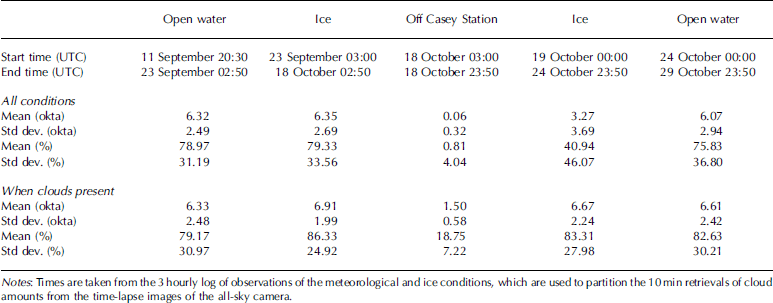
The cloud measurements, partitioned according to the surface regimes experienced during the cruise, are summarized in table 2. there is little change in cloud amount on entering the ice after crossing the southern ocean, but there is a marked clearing of the sky when the ship approaches the arid coastline off casey station in vincennes bay. the return passage through the ice is characterized by reduced cloud cover compared to conditions in the ice on the outbound passage as well as conditions in the open water on the subsequent crossing of the southern ocean. clear skies during the first few days of the transit away from casey station give way to greater cloud cover towards the ice edge, accompanied by snow, then rain as the ship entered open water. average cloud cover for this time interval (19–24 october; table 2) is the result of extremes in cloud amount. when clouds were present, the cloud-cover statistics do not deviate significantly from those of the outbound passage through the ice, or of the crossings of the southern ocean.
Table 2. Cloud amounts in the different surface regimes experienced during the cruise
The clear-sky shortwave transmissivity, k (Reference MinnettMinnett, 1999), is derived from:
Where sw↓toa is the calculated top-of-atmosphere shortwave flux and μ is the atmospheric path length. this relationship is illustrated in figure 3, where the colors represent different cloud amounts as determined by analysis of the all-sky camera images. a value of 0.91 for k was derived from the Aurora Australis data. this is in good agreement with those of arctic polynya and ice-station datasets, which averaged 0.89±0.02 over a range of daylight conditions, seasons and latitudes (Reference MinnettMinnett, 1995, 1999; Reference Hanafin and MinnettHanafin and minnett, 2001; Reference KeyKey, 2004), as shown in table 3 (dataset acronyms explained in table 4). the values for k clear are derived from the least-squares fit to measurements visually identified as clear, and k best is the transmissivity that minimizes the mean uncertainty between the parameterized and actual clear-sky measurements. the residual uncertainties in the clear-sky shortwave flux derived using k best in equation (2) are shown in the last column of table 3. the atmospheric transmissivity is comparable for the high-arctic and southern ocean–antarctic datasets. the outlier is the st lawrence island polynya which is a sub-arctic polynya that was sampled during spring when clear-sky observations were few. this resulted in a relatively small number of data points with which to derive the clear-sky transmissivity (Reference KeyKey, 2004). the high-arctic polynya data were taken at much higher latitudes than the Aurora Australis measurements, but the range of solar zenith angles was not so different, as the southern data were taken earlier in the austral year when the sun was lower in the sky. nevertheless, the correspondence in k between the diverse datasets is noteworthy, especially given the different origins of the air masses in the northern and southern hemisphere measurements.
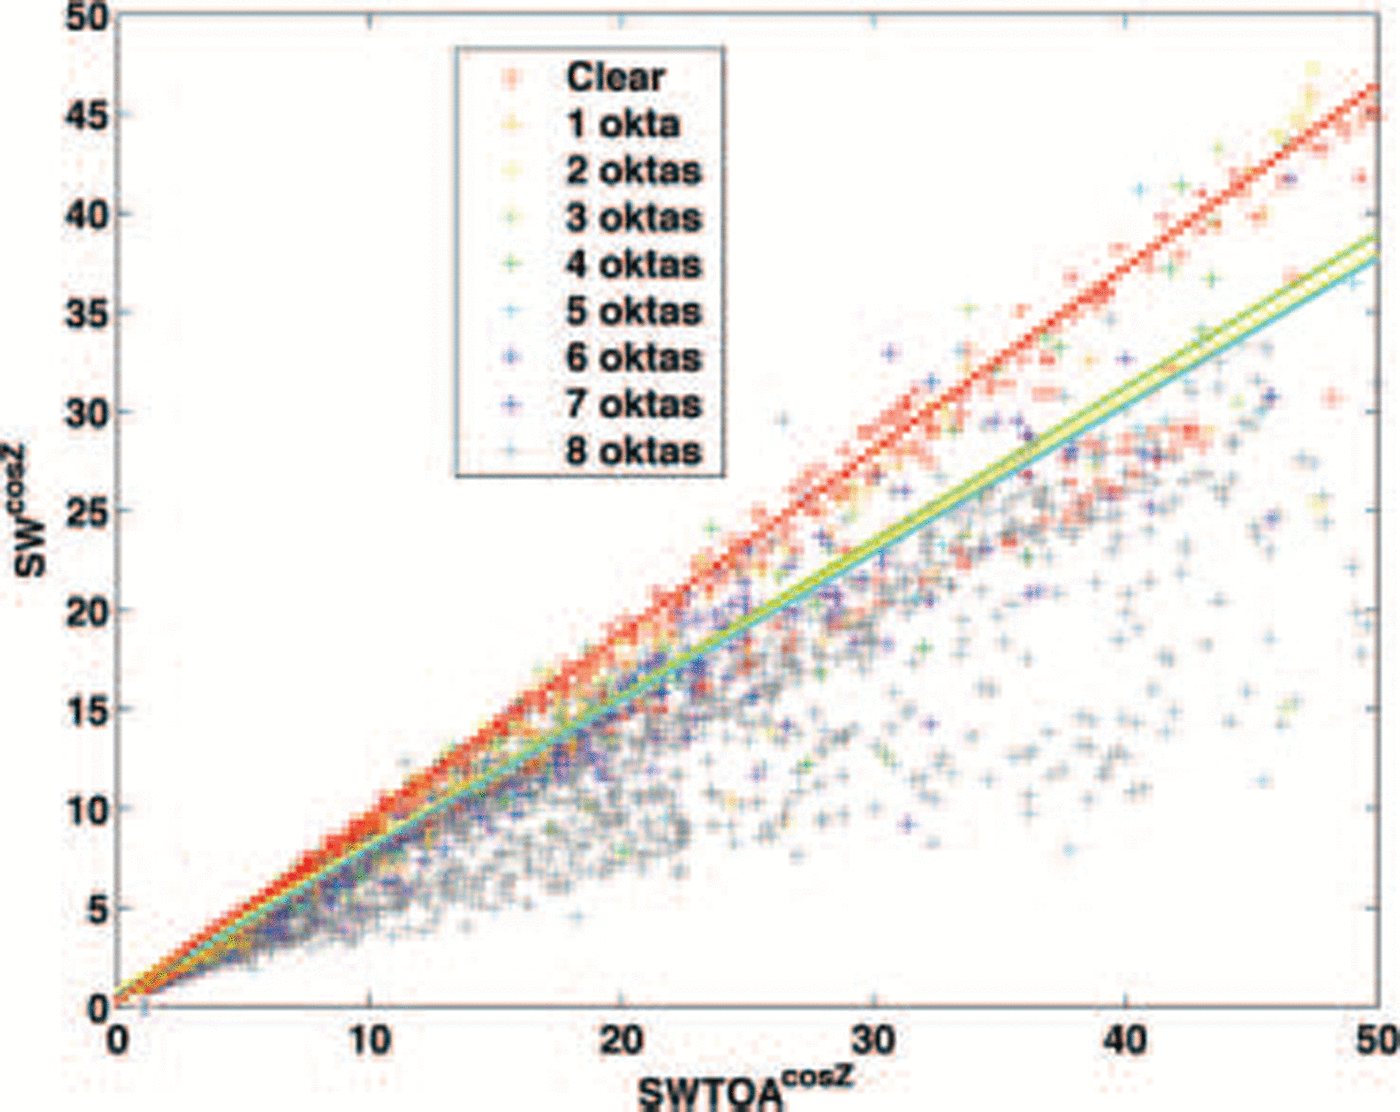
Fig. 3. Ratio of incident shortwave measured at the surface, compared to that at the top of the atmosphere (TOA). The slope of the red line is the clear-sky transmissivity, k clear, of the dataset. In this case, that value is 0.91, which is in agreement with results from Arctic analyses (0.89±0.02). Using a cruise-specific k best in the Reference MinnettMinnett (1999) clear-sky downwelling shortwave parameterization reduces uncertainties in SW(0) to <1Wm–2.
Table 3. Atmospheric transmissivity, k, derived from data taken during several research cruises to the Arctic and during the cruise of the Aurora Australis. The code for each cruise is given in Table 4. The k clear is derived from the least-squares fit line of clear-sky shortwave measurements, and k best is the value that minimizes the mean uncertainty in parameterized clear-sky shortwave radiation. The residual uncertainties in the clear-sky shortwave flux derived using k best in Equation (2) are shown in the last column

Table 4. Explanation of the acronyms used to describe the cruise datasets in Table 3

Shortwave cloud radiative forcing of the incident shortwave radiative flux was largely negative over the length of the cruise, regardless of cloud type (fig. 4) or the possibility of multiple reflections between the ice surface and overlying cloud bases. this is to be expected, as the density and distribution of cloud was extensive. however, the magnitude of the forcing was greater over open water areas than over the pack ice and marginal ice zones (figs 1 and 5). this may be the result of multiple reflections between cloud base and the high-reflectivity surface of the sea ice, or the relative predominance of stratus clouds over the ice pack as compared to the stratocumulus-dominated open water. the most positive values of derived shortwave forcing were calculated from measurements taken near casey station. low atmospheric humidity and a lack of cloud within this coastal area contributed to the efficient transmission of insolation to the surface through an extremely clear atmosphere, leading to an apparent positive forcing.
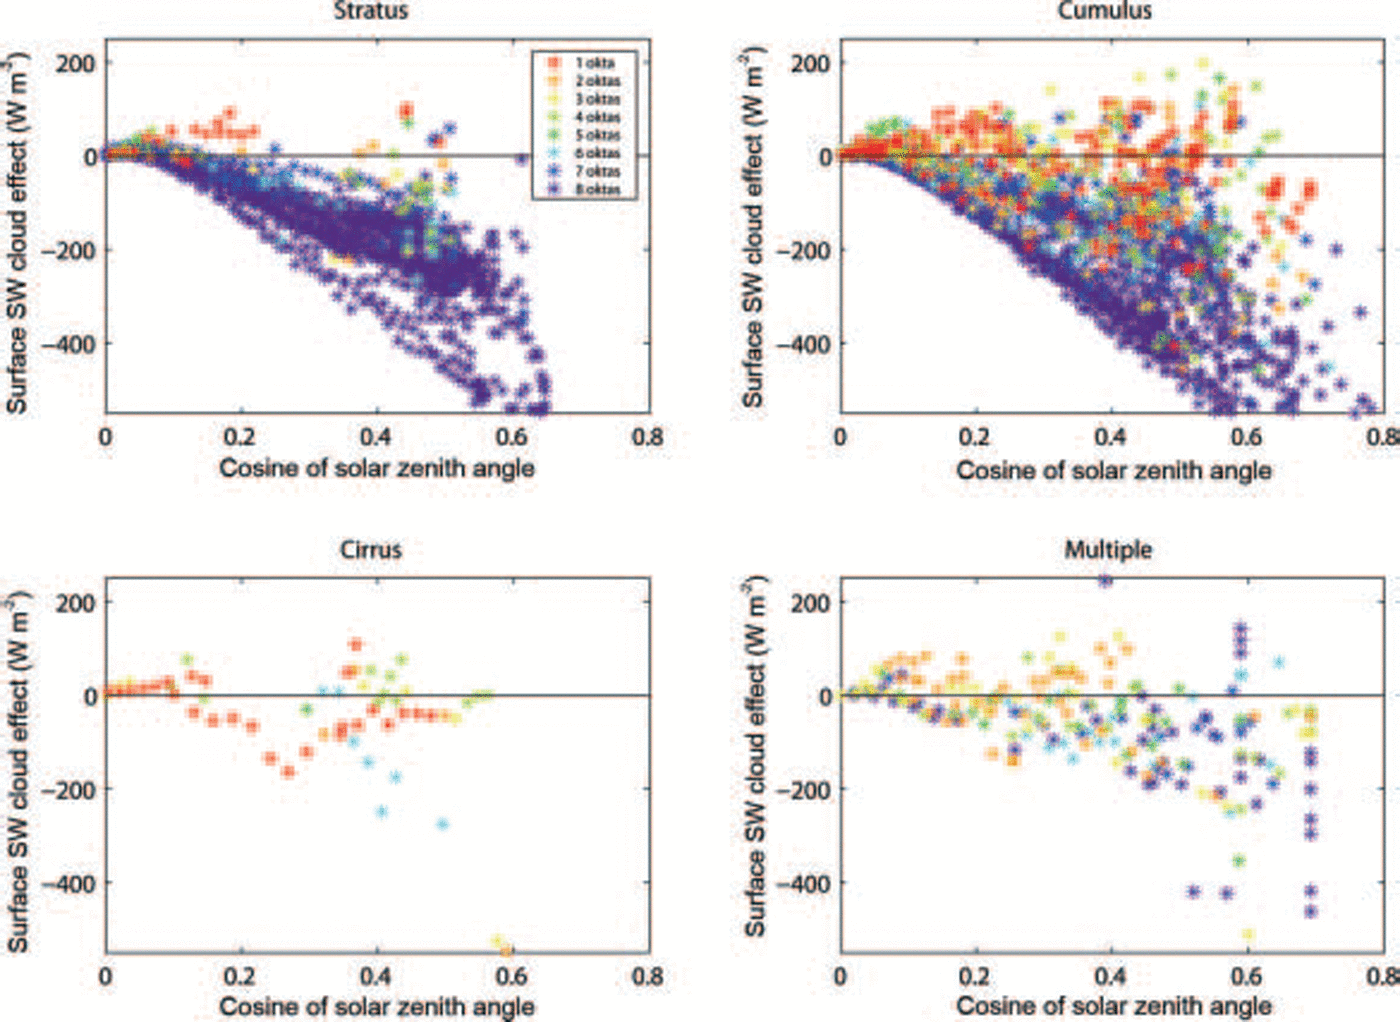
Fig. 4. The surface shortwave (SW) cloud effect as a function of the solar zenith angle, cloud amount and cloud type. ’Stratus’ includes stratus and altostratus clouds; ‘cumulus’ includes cumulus, cumulonimbus, altocumulus and stratocumulus; and ‘cirrus’ includes cirrus, cirrostratus and cirrocumulus. ‘Multiple’ indicates clouds identified at multiple levels.
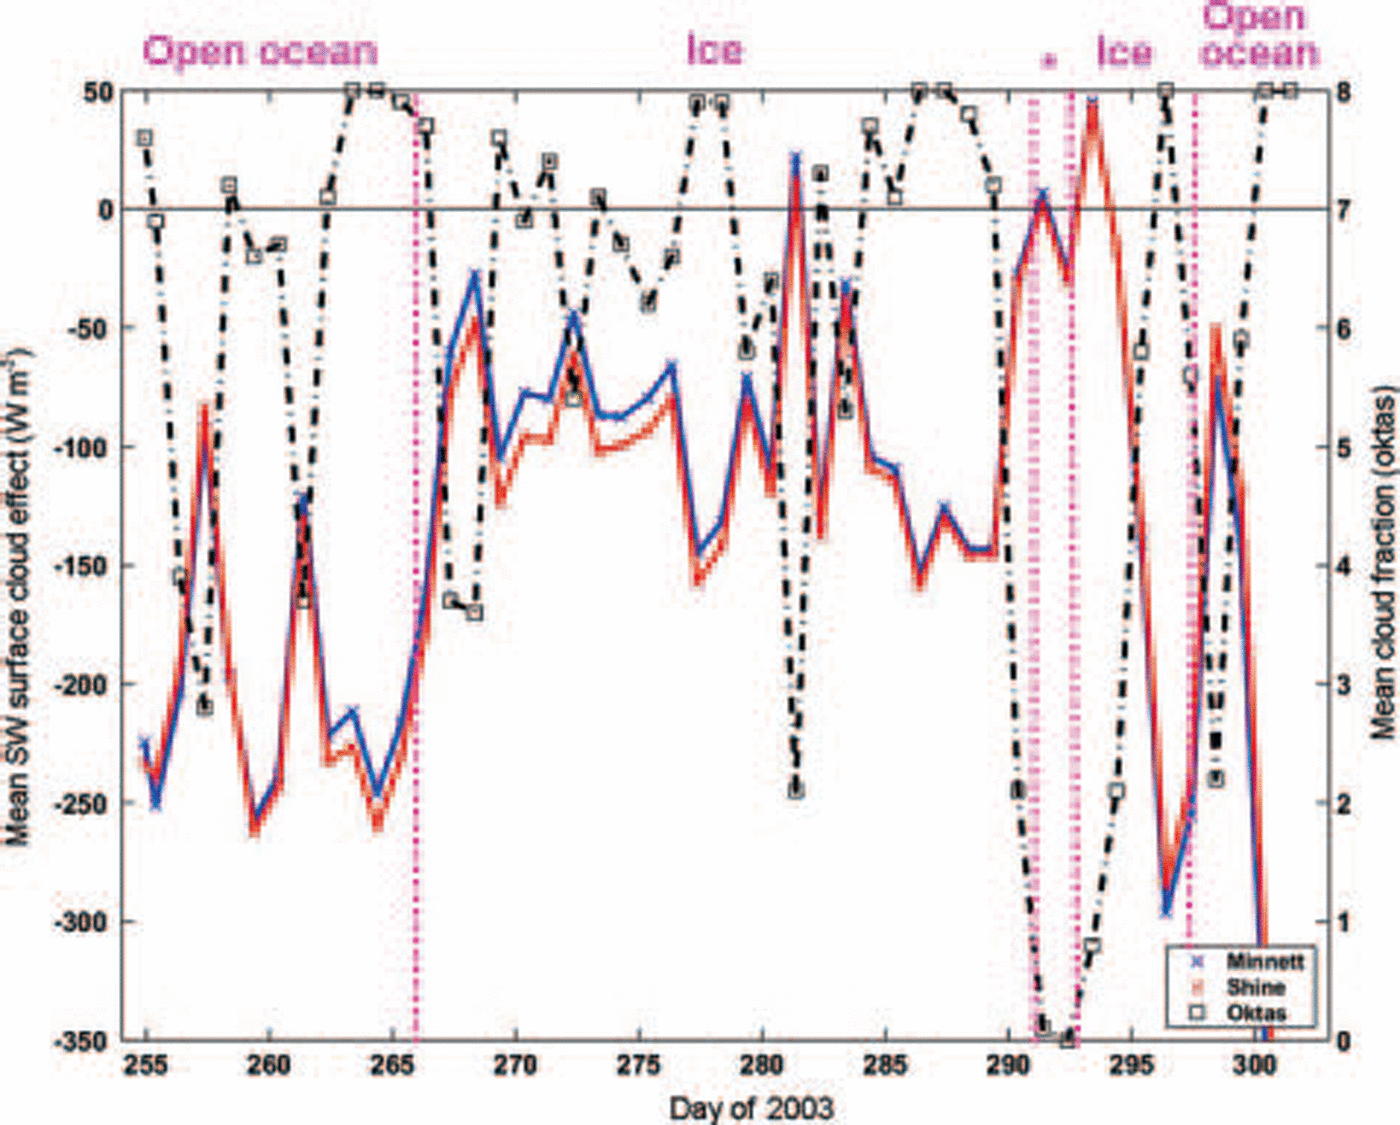
Fig. 5. Daily averaged incident shortwave (SW) cloud-forcing effect for the entire length of the cruise track. The red curve shows the forcing effect as calculated with the Reference RamanathanShine (1984) parameterization, while the blue curve utilizes the Minnett (1999) parameterization with a cruise-specific clear-sky transmissivity (k best). Daily averages of cloud amount are given by the dashed line and corresponding axis at right. As in Figure 3, the vertical dotted lines delineate the times the ship transitioned from one regime to another, as indicated by the labels at the top; the asterisk indicates the time the Aurora Australis was in the open water and patchy ice of Vincennes Bay off Casey Station. The times of the transitions between regimes, and the cloud-cover statistics are given in Table 2.
The daily mean incident shortwave cloud radiative forcing is displayed in figure 6 as a function of the daily mean cloud amount (both derived for the sunlit part of each day). the least-squares line fitted to the data implies a cloud forcing of ∽–27wm–2 per okta, or –2.2wm–2%–1 cloud cover. clearly there are many factors that contribute to this effect, such as the cloud types (fig. 4), their phase and their optical depths, but a more thorough investigation would require a longer, more complete dataset that includes cloud microphysical measurements. such an inclusive sampling of clouds and radiation may be possible at coastal sites, but the aridity and tendency toward clear sky or cirriform cloud over the continent and at the coast does not allow for extension of the results over the ice pack or southern ocean. this limits our ability to compare results with other in situ maritime radiation studies to those conducted in the arctic; at the time of writing, only one other observational study has been conducted in the antarctic, and it analyzes data collected at palmer station on the antarctic peninsula (Reference LubinLubin, 1994).
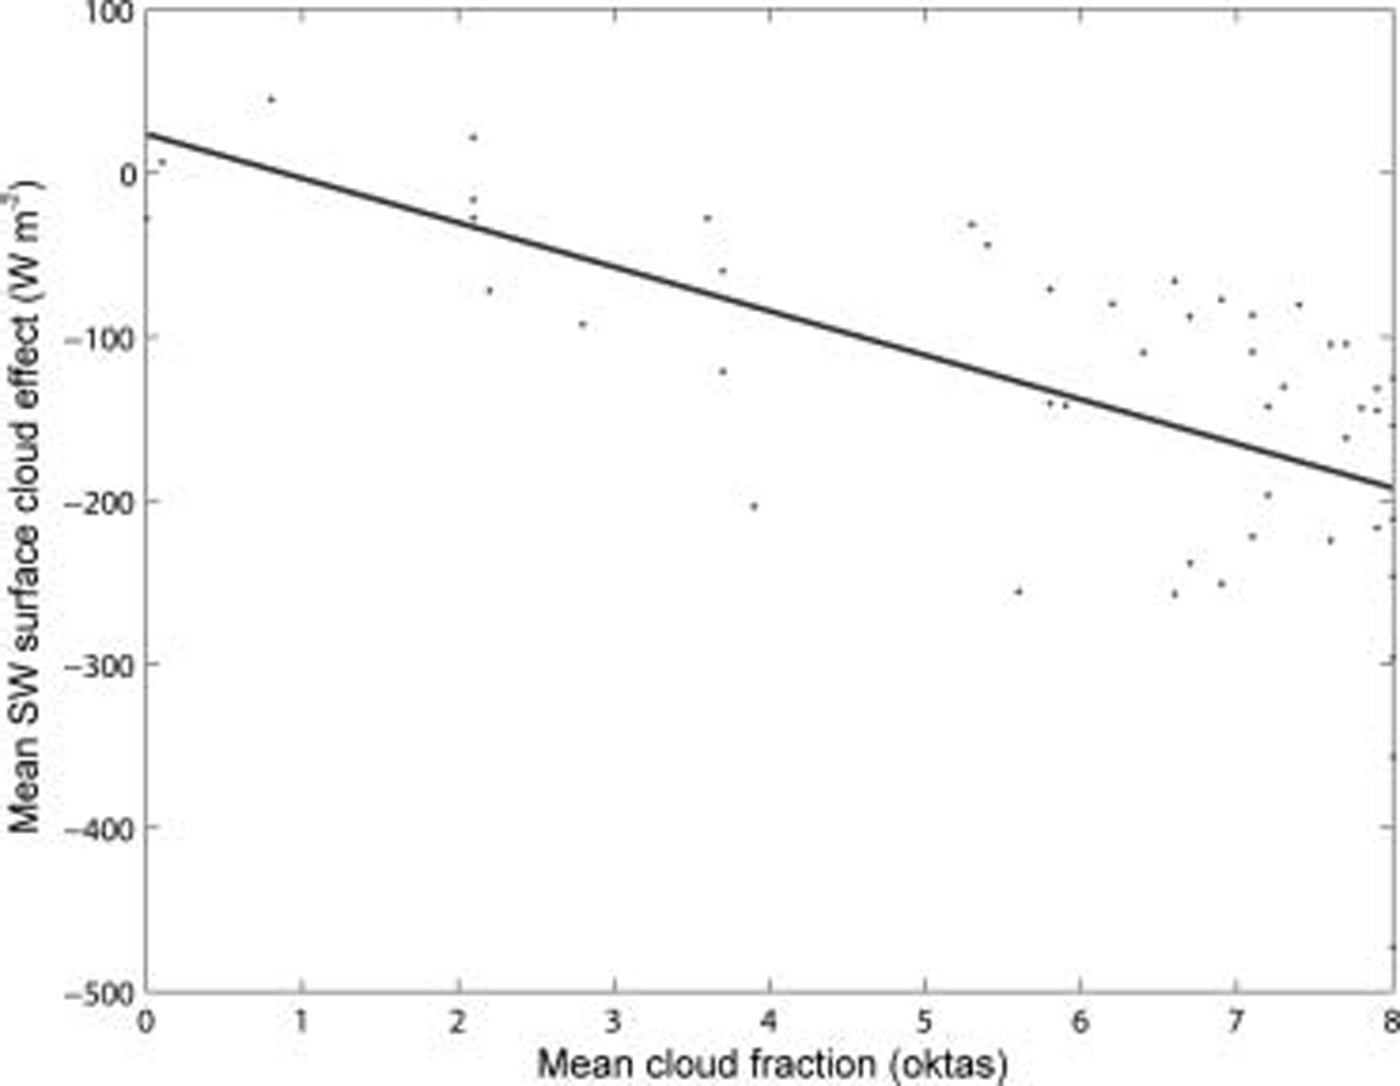
Fig. 6. Daily-averaged shortwave (SW) incident cloud forcing as a function of cloud fraction for the entire ARISE cruise. The blue line demarcates the least-squares fit to the data. The slope of this line suggests that for every okta of cloud, the shortwave radiation is attenuated by ∽27Wm – 2. The lack of data with low cloud fraction is typical of polar data, where clouds may be present in as many as 90% of the observations.
For all cloud types, the forcing showed a distinct dependency on solar zenith angle (fig. 4). when the disk of the sun is below the horizon (Z > 90.8˚, where Z is the solar zenith angle; the upper edge of the sun is just below the horizon), shortwave forcing is necessarily zero. cloud forcing in times of twilight is not considered here. as the sun rises, at Z ≈ 82˚ the forcing becomes positive and increases linearly. for Z < 82˚, with the sun now being above the lower cloud layer and thus reducing contributions from multiple reflections and increasing backscattering, the sign of the forcing becomes negative.
The contribution of incident radiation in the photo-synthetically active wavelengths (par) was well correlated with the diurnal cycle in shortwave radiation. given that the presence of clouds reduced the surface insolation by up to a factor of three (fig. 2), the reduction in par by clouds will be by a comparable factor. this compares to reductions by a factor of about 20 caused by a few centimeters of snow on sea ice of thickness 50–60cm in the north water polynya area in the north of baffin bay (Reference Belzile, Johannessen, Gosselin, Demers and MillerBelzile and others, 2000). the depth of water in the absence of ice required to reduce the surface par to 1% varied from 14 to 71 m (Reference Belzile, Johannessen, Gosselin, Demers and MillerBelzile and others, 2000). thus the effects of even small amounts of snow on sea ice have a greater effect on the par available to ice algae on the underside of the ice and are much more important in limiting the potential primary production prior to ice break-up than the presence of clouds.
Complementary analyses of arctic cloud and radiation datasets (Reference MinnettMinnett, 1999; Reference Hanafin and MinnettHanafin and minnett, 2001; Reference KeyKey, 2004) have yielded similar results, namely, that shortwave effects are pronounced in daylight months, reducing the incoming radiation by as much as a factor of five (see Reference MinnettMinnett, 1999, fig. 3), with the atmospheric transmittance (equation (2)) being reduced from 0.90 for clear skies to 0.70 for stratiform clouds (Reference MinnettMinnett, 1999). for the north water polynya measurements, the daily averaged net incident cloud forcing at the surface (the sum of the shortwave and longwave effects) was found to have a sensitivity of –12.5wm–2 per okta, or –1.0wm–2%–1, for cloud amounts less than 50%, and –30wm–2 per okta, or –2.4wm–2%–1, for cloud amounts greater than 50% (Reference Hanafin and MinnettHanafin and minnett, 2001). a change in the sign of forcing at a solar zenith angle of ∽82˚ is also common to both polar regions. in contrast to the antarctic, however, the few excursions of positive forcing calculated for arctic data are attributable to extensive periods of overcast skies, and are thus features of the longwave emission of clouds. however, the absence of longwave measurements during arise prevents a direct comparison with the arctic results. stratus and stratocumulus clouds characterize both polar datasets, as does the transition toward clear skies and cirriform over high-topography coastal sites.
Conclusions
The measurements of cloud amount and type, derived from analysis of time-lapse video from an all-sky camera system, indicate a high frequency of cloud along the arise track across the southern ocean and into the fast ice. the occurrence of clear skies was largely limited to areas in close proximity to the antarctic coast. this is in broad agreement with previous studies, and new measurements from a spaceborne lidar system, taken during october 2003 (i.e. during the second part of arise), which show fractional cloud cover >90% seaward of the antarctic coastline (Reference Shupe and IntrieriSpinhirne and others, 2005).
Many analyses of cloud cover over mixed arctic surfaces indicate that the relative contribution of clouds to surface heat budgets in polar regions is dominated by the shortwave component during daylight months (e.g. Reference MinnettMinnett, 1999; Reference Hanafin and MinnettHanafin and minnett, 2001; Reference KeyKey, 2004). light scattering in extensive clouds, which are often multilayered, outweighs the longwave emission from the cloud base toward the surface, resulting in a largely negative surface cloud forcing (Reference KeyKey, 2004). this should effectively cool the underlying surface and either retard spring melt or spur fall refreeze. while the incident shortwave effect calculated for the arise data is large and of comparable magnitude to arctic values, a lack of downwelling longwave radiation measurements on the Aurora Australis disallows any determination of the total cloud effect. however, calculations of the incident shortwave forcing at the surface over this representative cruise track in the southern ocean show much more negative values over the open water area than over the ice pack. likely reasons for this disparity include higher liquid-water contents in the cloud over open water (Reference CurryCurry and others, 2000) and also the latitudinal gradient in insolation.
The sensitivity of the shortwave surface radiation budget to cloud forcing was found to be ∽–27wm–2 per okta, or –2.2wm–2%–1 cloud cover. given that the area of the southern ocean and antarctic ice pack, at least away from the coast, is already very cloudy (80–90% cloud occurrence), the increase in cloud amount that can be anticipated in a warmer climate with reduced ice cover has a maximum cooling potential of 10–20wm–2. this is likely to be enhanced by increases in cloud liquid-water content and cloud optical depth.
Antarctic atmospheres encompass a wider range of relative humidity than the maritime arctic (Reference KeyKey, 2004). this is due in part to the influx of moisture associated with cyclone passages and the strong winds which enhance turbulent exchanges with the exposed ocean surface. along the coast, continental air drainage and katabatic winds extend the lower boundary of the relative humidity range towards 30%, some 40% less than the average maritime relative humidity.
Acknowledgements
The support of the captain and crew of the Aurora Australis is gratefully acknowledged, as is the contribution of r.a. jones who undertook the analysis of the all-sky camera images. d. allen and s. visentin of the australian bureau of meteorology provided the 3 hourly meteorological, ice and sea-state observations. this research was supported by nasa and the us national science foundation.


