Introduction
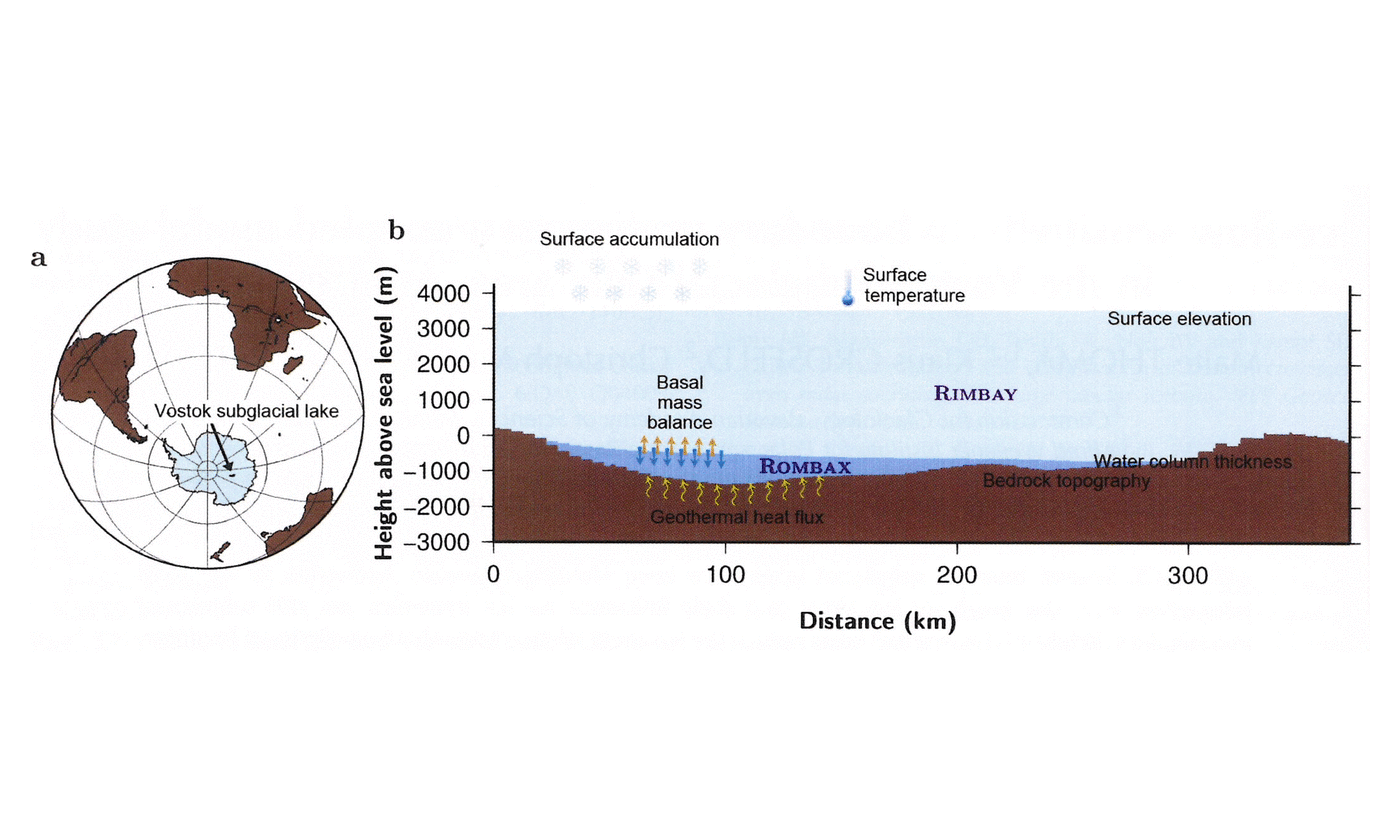
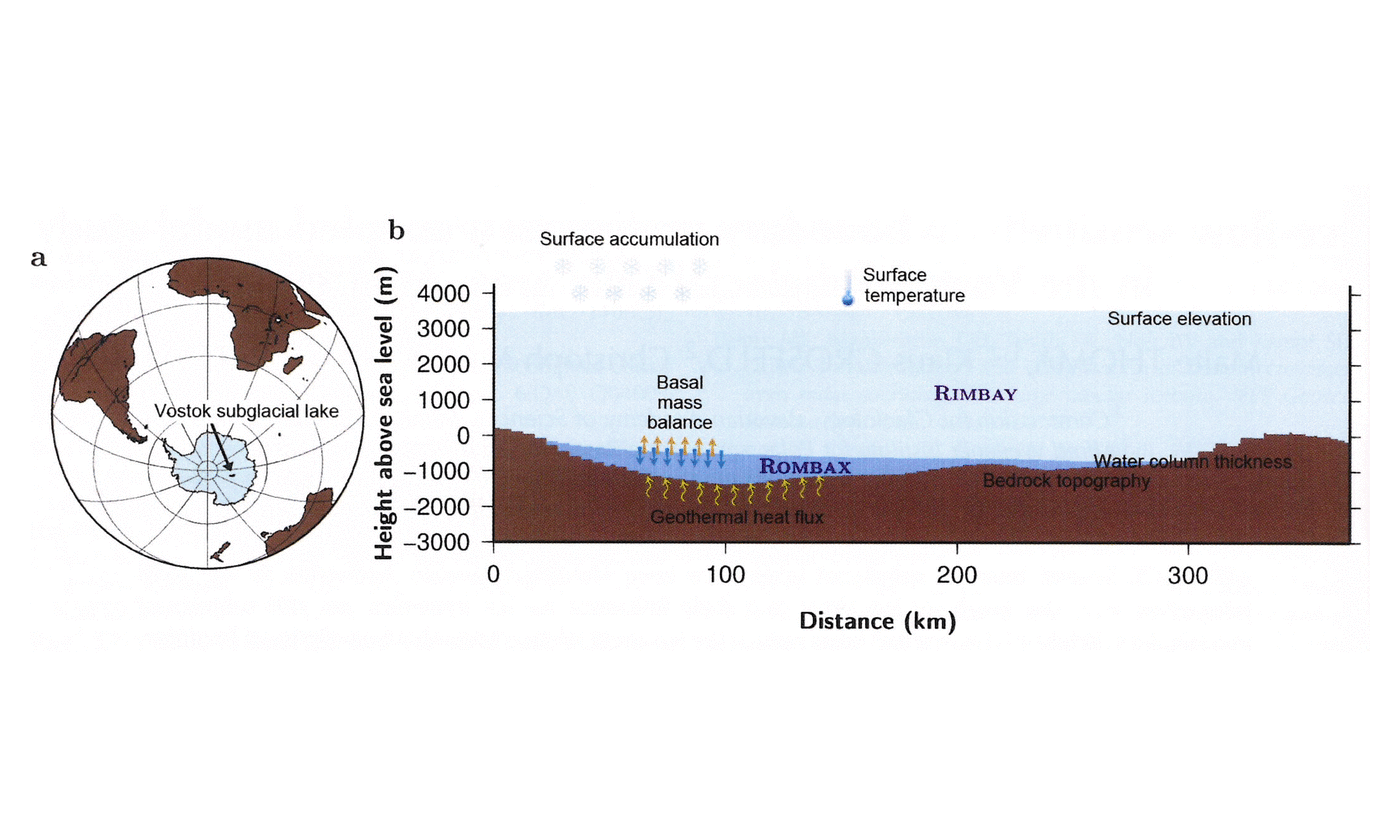
Subglacial lakes are common and widespread beneath the Antarctic ice sheet. More than 370 of these lakes have been identified so far (Reference Wright, Siegert, Siegert, Kennicutt and BindschadlerWright and Siegert, 2011), but just 72 exceed an area of 10 km2. The largest one, Vostok Subglacial Lake (official name according to the US Board on Geographic Names; Antarctica ID: 18528), located in East Antarctica (Fig. 1a),measures 16 000 km2 (Reference Studinger, Bell and TikkuStudinger and others, 2004; Reference Filina, Blankenship, Thoma, Lukin, Masolov and SenFilina and others, 2008). Subglacial lakes are identified from satellite images by their surface, which is flat compared to the surrounding ice sheet. These lakes have been isolated from direct exchange with the atmosphere by several kilometers of ice for millions of years and hence provide a unique environment for potential life forms.
Drilling at Vostok station revealed that not only does melting take place at the ice base, but also water refreezes at the lake/ice interface (Reference JouzelJouzel and others, 1999; Reference SiegertSiegert and others, 2001). At Vostok station a 210m thick layer of accreted lake/ice was discovered between the meteoric ice and the lake’s surface. Reference Tikku, Bell, Studinger and ClarkeTikku and others (2004) were able to estimate the distribution of accreted ice by ice-penetrating radar feature tracking. However, until drilling into subglacial lakes (as suggested by Reference WoodwardWoodward and others, 2010) provides in situ information, numerical models are needed to quantify processes at the lake/ice interface (Reference WilliamsWilliams, 2001; Reference Mayer, Grosfeld and SiegertMayer and others, 2003; Reference Thoma, Grosfeld and MayerThoma and others, 2007, 2008a, 2009, 2010a; Reference WoodwardWoodward and others, 2010). According to Reference Bell, Studinger, Shuman, Fahnestock and JoughinBell and others (2007), the storage capacity of subglacial lakes should be considered in ice-sheet mass-balance assessments. The role of these lakes for the subglacial hydrology is still not clear, but there are indications of an active hydrological system munderneath the ice sheet, which affects the general ice dynamics (Reference Wingham, Siegert, Shepherd and MuirWingham and others, 2006; Reference Fricker, Scambos, Bindschadler and PadmanFricker and others, 2007; Reference BellBell and others, 2011) and might trigger the onset of fast-flowing ice streams by basal lubrication (Reference Bell, Studinger, Shuman, Fahnestock and JoughinBell and others, 2007; Reference KohlerKohler, 2007; Reference Stearns, Smith and HamiltonStearns and others, 2008). The ice flow depends on the temperature-dependent viscosity of the ice body. The viscosity is modified by basal melting and freezing, which induce vertical velocities at the ice base on the order of centimeters per year. A coupled modelling approach with an idealized setting has been applied recently in order to investigate the interaction of subglacial lakes with the overlying ice sheet (Reference Thoma, Grosfeld, Mayer and PattynThoma and others, 2010b).
In this study we take a further step and investigate the impact of different forcings, such as surface temperature, basal mass exchange and basal friction, on the ice flow in the area of Vostok Subglacial Lake.
Boundary Conditions and Model Set-Up
In order to investigate the area around Vostok Subglacial Lake in a numerical model study, surface elevation and bedrock for the entire model domain were taken from the BEDMAP dataset (Reference Lythe and VaughanLythe and others, 2001). To acquire a more realistic representation of the Vostok Subglacial Lake domain, we merged the most up-to-date regional bedrock geometry model by Reference Filina, Blankenship, Thoma, Lukin, Masolov and SenFilina and others (2008) into the continental BEDMAP model (Figs 1b and 2a and b).
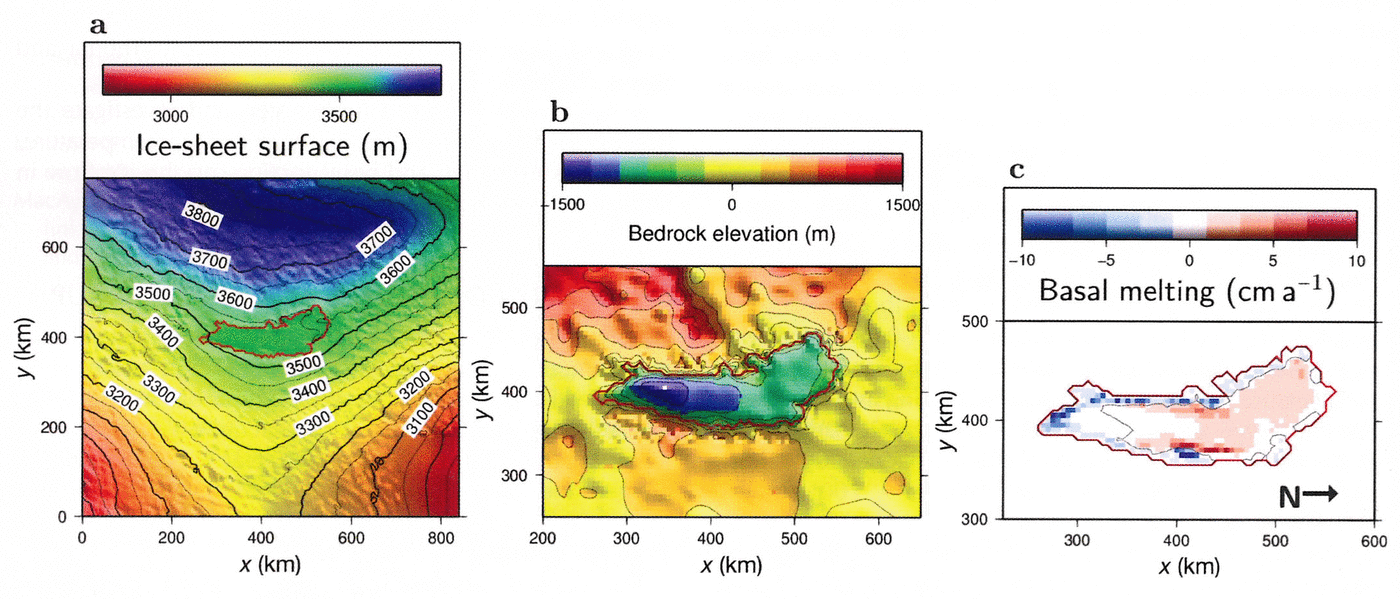
Fig. 2. (a) Ice-sheet surface and (b) bedrock elevation in the Vostok Subglacial Lake area. Data according to Reference Lythe and VaughanLythe and others (2001), improved according to Reference Filina, Blankenship, Thoma, Lukin, Masolov and SenFilina and others (2008). The solid red line indicates the lake’s shoreline, determined by satellite imagery. (c) Applied basal mass balance according to Reference Thoma, Grosfeld, Smith and MayerThoma and others (2010a). Negative values represent basal freezing. The arrow indicates geographic north. The full model domain is shown in (a); (b) and (c) show regions only around the lake to allow details to be distinguished.
The surface accumulation rate is given by Reference Arthern, Winebrenner and VaughanArthern and others (2006). The initial temperature distribution within the ice is calculated according to Reference RobinRobin (1955), based on a spatially varying surface temperature and the basal pressure-dependent freezing point of the ice-sheetbase. Three different surface-temperature fields are applied (Fig. 3): a simple latitude/height parameterization after Reference HuybrechtsHuybrechts (1992), a dataset based on satellite infrared measurements (Reference ComisoComiso, 2000; Reference Le Brocq, Payne and VieliLe Brocq and others, 2010) and a dataset derived from borehole measurements (Reference Wang and HouWang and Hou, 2009). The basal geothermal heat flux is prescribed according to Reference Shapiro and RitzwollerShapiro and Ritzwoller (2004).
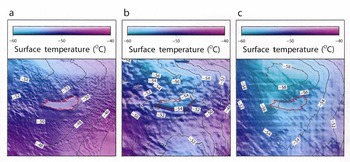
Fig. 3. Applied surface temperatures according to (a) Reference HuybrechtsHuybrechts (1992), (b) Reference ComisoComiso (2000) and (c) Reference Wang and HouWang and Hou (2009).
Ice flow across subglacial lakes and bedrock differs significantly in basal friction and basal mass balance. Basal friction is parameterized by a scalar friction coefficient, β
2 (Reference MacAyealMacAyeal, 1993; Reference PattynPattyn, 2003, Reference Pattyn2008), which relates basal velocity, ![]() , to basal drag:
, to basal drag: ![]() . Above subglacial lakes, a free-slip condition, β
2 = 0, allows sliding. Above bedrock, β
2 = 25 000 Pa am–1 corresponds to a typical basal frictional stress of ~100 kPa (Reference PatersonPaterson, 1994) if a velocity of ~4ma–1
1 is assumed. The basal mass balance (Fig. 2c) is given by the lake-flow model ROMBAX (Revisited Ocean Model based on Bryan and Cox; Reference Thoma, Grosfeld, Smith and MayerThoma and others, 2010a). This general circulation model calculates the water circulation and the melting and freezing rates at the lake/ice boundary considering the pressure-dependent freezing point and conservation of heat according to Reference Holland and JenkinsHolland and Jenkins (1999). All boundary conditions applied to force the ice-flow model RIMBAY (Revised Ice sheet Model Based on frAnk PattYn; Reference Thoma, Grosfeld, Mayer and PattynThoma and others, 2010b) are summarized in Table 1 and indicated in Figure 1.
. Above subglacial lakes, a free-slip condition, β
2 = 0, allows sliding. Above bedrock, β
2 = 25 000 Pa am–1 corresponds to a typical basal frictional stress of ~100 kPa (Reference PatersonPaterson, 1994) if a velocity of ~4ma–1
1 is assumed. The basal mass balance (Fig. 2c) is given by the lake-flow model ROMBAX (Revisited Ocean Model based on Bryan and Cox; Reference Thoma, Grosfeld, Smith and MayerThoma and others, 2010a). This general circulation model calculates the water circulation and the melting and freezing rates at the lake/ice boundary considering the pressure-dependent freezing point and conservation of heat according to Reference Holland and JenkinsHolland and Jenkins (1999). All boundary conditions applied to force the ice-flow model RIMBAY (Revised Ice sheet Model Based on frAnk PattYn; Reference Thoma, Grosfeld, Mayer and PattynThoma and others, 2010b) are summarized in Table 1 and indicated in Figure 1.
Table 1. Summary of applied boundary conditions

The whole model domain is shown in Figure 2a. The ice divide, from where the ice approaches Vostok Subglacial Lake, is included in the model domain, which renders specific lateral boundary conditions unnecessary. The horizontal resolution of RIMBAY is 5 km; in the vertical, 40 terrain-following layers are applied. The time-step is dynamically adjusted according to the Courant–Friedrichs– Lewy (CFL) condition. The initial flow field starts from rest, and the model runs for 200 000 years in a shallow-ice approximation (SIA) mode, until a preliminary steady state of the velocity and temperature field is reached. After an additional 50 000 model years, and the application of full Stokes physics (e.g. Reference PattynPattyn, 2008), the model achieves steady state. For this study the ice model runs in a diagnostic mode, keeping ice thickness, bedrock, lake volume and grounding-line position constant.
Results
General flow and temperature regime above Vostok Subglacial Lake
Our modelled surface flow field across Vostok Subglacial Lake (Fig. 4a) is in agreement with the modelling results of Reference Pattyn, De Smedt and SouchezPattyn and others (2004). It shows a consistent pattern, with flow directions similar to those indicated by the radar-image feature tracking of Reference Tikku, Bell, Studinger and ClarkeTikku and others (2004) and a Vostok flowline modelled by Reference Salamatin, Tsyganova, Popov, Lipenkov and HondohSalamatin and others (2009). Our modelled ice-flow velocity at Vostok station of ~4.0ma–1 fits within the ice-flow velocities observed (1.9–4.2ma–1) by Reference Kwok, Siegert and CarseyKwok and others (2000), Reference Bell, Studinger, Tikku, Clarke, Gutner and MeertensBell and others (2002), Reference Tikku, Bell, Studinger and ClarkeTikku and others (2004) and Reference WendtWendt and others (2005). Therefore, we consider the model realistic enough to investigate the impact of different boundary forcings with respect to the flow field.
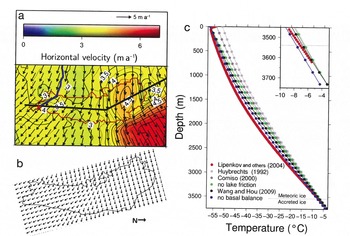
Fig. 4. (a) Modelled averaged horizontal velocities for surface temperatures according to Reference Wang and HouWang and Hou (2009). The red line indicates the lake boundary, the blue line the Vostok flowline of Reference Salamatin, Tsyganova, Popov, Lipenkov and HondohSalamatin and others (2009) ending at Vostok station (red star). The black line is the position of a temperature cross section. (b) Flow field direction according to Reference Tikku, Bell, Studinger and ClarkeTikku and others (2004). (c) Observed (Reference Lipenkov, Shibayev, Salamatin, Ekaykin, Vostretsov and PreobrazhenzkayaLipenkov and others, 2004) and modelled vertical temperature profiles according to different forcings near Vostok station.
Upstream of the lake, the modelled velocity ranges from ~3.0 to 3.5 ma–1. Across the lake, the frictionless bottom results in a general velocity acceleration. In the lake’s center, only a slight increase to ~3.6ma–1 is modelled, but in the northern and southern parts of the lake the velocity increases to up to 4.6 and 4.1 ma–1, respectively, are significant. The ice flow over Vostok Subglacial Lake diverges. In particular, at the southern tip of the lake the flow is significantly diverted southward. These deflections correspond to the increased velocities at both ends of the lake. However, the reasons for these velocity increases are different. In the south, where freezing is strongest (Fig. 2c), ascending isotherms result in warmer ice (Fig. 5) and hence in a reduced viscosity. Therefore, velocities are increased at the southern end of the lake. Beyond the lake, without basal freezing, the basal temperature cools down again and hence the velocities decrease to their former magnitude. In contrast, the increased ice-surface gradient northeast of the lake (Fig. 2a) results in a significant flow acceleration downstream of the lake, to velocities of up to 6.5 ma–1 This flow is channelled by a subglacial trough in this area (Fig. 2b). The absence of basal friction over the lake results in ice-shelf-like flow in this area whereby ice over the northern part of the lake is dragged by the fast-flowing ice beyond the lake. These findings are consistent with those of Reference Bell, Studinger, Shuman, Fahnestock and JoughinBell and others (2007), who concluded that subglacial lakes initiate and maintain rapid ice flow through either active modification of the basal thermal regime of the ice sheet by lake accretion or through scouring bedrock channels in periodic drainage events.
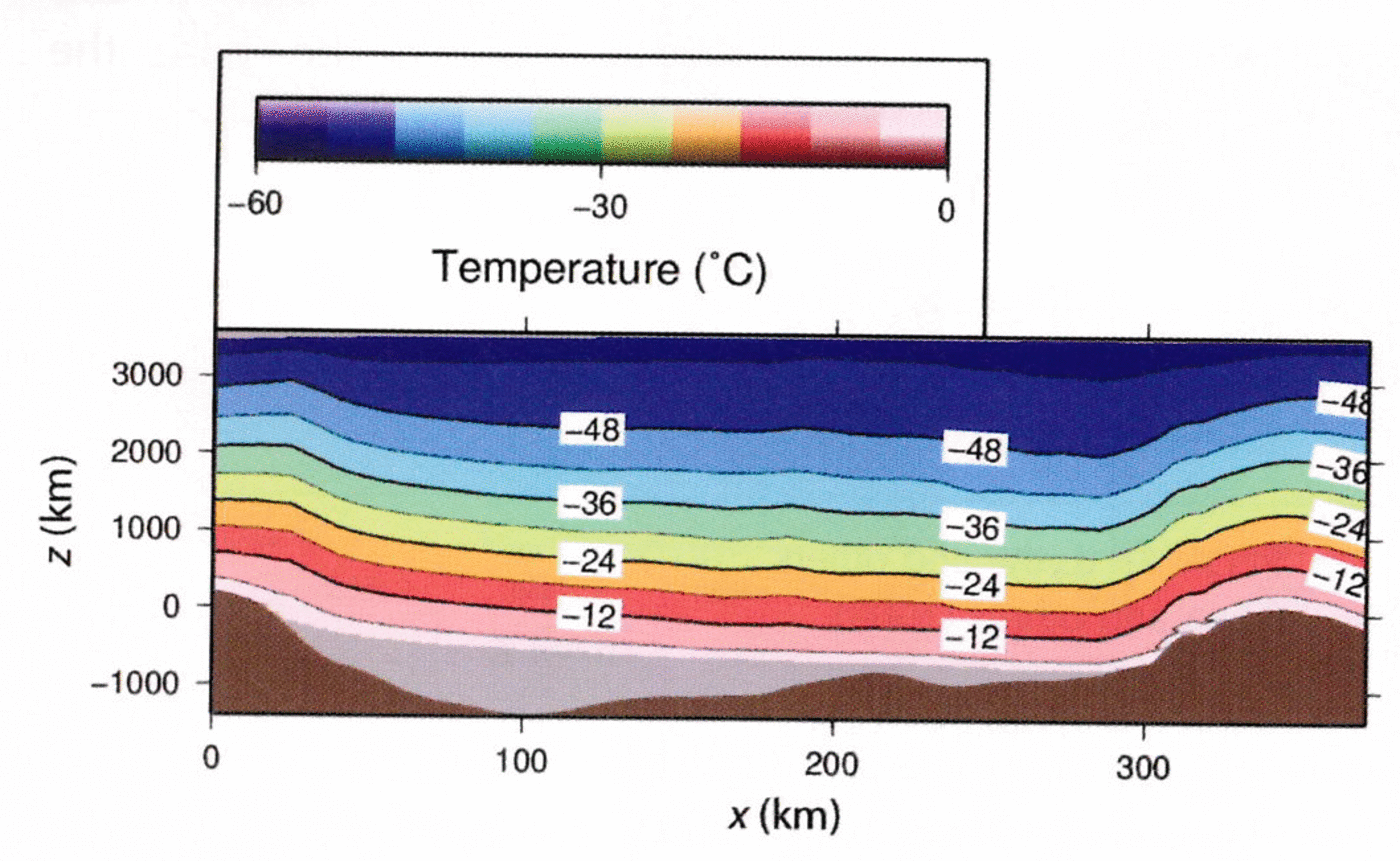
Fig. 5. Temperature cross section along the track shown in Figure 4a. modelled flow- and temperature distribution sufficient under constant surface boundary conditions.
Additional validation of the model results can be achieved by comparing the vertical temperature profile in the southern part of the lake with measurements from the Vostok station borehole (e.g. Reference Salamatin, Lipenkov and BlinovSalamatin and others, 1994; Reference Lipenkov, Shibayev, Salamatin, Ekaykin, Vostretsov and PreobrazhenzkayaLipenkov and others, 2004). According to our modelling, only the surface temperature forcing of Reference Wang and HouWang and Hou (2009) is able to reproduce the observed temperatures in the upper part of the ice sheet. The two other available surface temperature datasets (Reference HuybrechtsHuybrechts, 1992; Reference ComisoComiso, 2000) result in too warm ice in the upper ice column. At the base the pressure-dependent melting point defines the basal temperature. Although measurements do not reach down to the lake/ice interface, the model results agree well with the available profile. In ~2000m depth the modelled temperature (forced with the surface-temperature data of Reference Wang and HouWang and Hou, 2009) is up to 2°C above the in situ temperature. This deviation may result from uncertainties of the modelled flow field, the assumed upstream surface temperatures and/or accumulation rate, or variations in the history of these parameters. Based on an assumed average ice-flow velocity of 2 ma–1 and a distance of 200 km from the ice divide (Figs 2a and 4a), variations of the surface boundary conditions during the last 100 000 years would be necessary to model a more realistic temperature profile. However, for the scope of this study we consider the
Impact of different forcings
We investigate the sensitivity of the ice flow above Vostok Subglacial Lake according to the impact of different boundary conditions, namely surface temperature, basal mass balance and basal sliding. All parameters have significant impact on the ice-flow regime. The impact of other boundary conditions (e.g. geothermal heat flux and accumulation) on the ice dynamics is not investigated in this study.
Surface temperature
A modified surface temperature field has a significant impact on the velocity, in particular in the already fast-flowing areas of the northern and southern part of the lake itself, as well as northeast of the lake (Figs 6a and b and 7a and b). Compared to the reference forcing (Reference Wang and HouWang and Hou, 2009), the surface temperatures according to Reference HuybrechtsHuybrechts (1992) and Reference ComisoComiso (2000) are ~5° and 2° warmer, respectively (Fig. 7a and b). Hence the temperature-dependent viscosity decreases, which corresponds to a velocity increase of up to 20% for these warmer surface temperature forcings. In addition, both warmer surface forcings induce a stronger southward deflection of the flow over the lake.
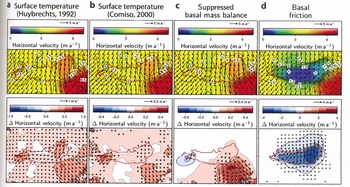
Fig. 6. (Top) Modelled mean horizontal velocities and (bottom) differences between this and the reference models of Figure 4 for surface temperature forcings according to (a) Reference HuybrechtsHuybrechts (1992) and (b) Reference ComisoComiso (2000); also for (c) a model with suppressed basal mass balance at the lake/ice interface and (d) a model with basal friction at the lake/ice interface.

Fig. 7. Modelled temperature profile along the track indicated in Figure 4a across Vostok Subglacial Lake (upper panel) and differences between this and the reference model (lower panel; Fig. 4c) for the same model forcings as in Figure 6a–d.
Basal mass balance
To investigate the influence of the basal mass balance on the flow regime, we present results with neglected basal melting and freezing above the lake in Figures 6c and 7c. The spatially varying basal mass balance has a heterogeneous impact on the flow. Basal freezing in the south (Fig. 2c) induces upward vertical velocities. Hence the ice is warmer in regions of freezing. In contrast, basal melting in the north results in downward advection of colder surface ice; consequently the ice is colder in this region compared to the control run. Note that for consistency Figures 6c and 7c indicate the effect of the ignored basal mass balance; hence the effect of the varying basal mass balance itself has the opposite sign. The modelled velocity (Fig. 6c) is again closely linked to the temperature-dependent viscosity. Therefore, freezing in the south increases the velocity and intensifies the southward deflection of the flow. In contrast, the extended melting in the north reduces the horizontal velocity. Both effects have a significant impact on the downstream flow far beyond the lake’s edge. In summary, the spatially varying basal-mass-balance pattern intensifies the flow divergence above Vostok Subglacial Lake.
Basal sliding
If basal sliding at the lake/ice interface is ignored, the reduced surface gradient over the lake significantly decreases the flow velocity (Fig. 6d) in this diagnostic model set-up. However, this effect is not limited to the lake itself. In particular, a significant (>0.5ma–1) velocity decrease is modelled upstream. We conclude that subglacial lakes influence the ice flow in the order of the lake’s dimension. The reduced horizontal flow results in a longer transition time of the ice across the lake. This explains the twofold impact on the temperature (Fig. 7d). First, basal freezing (in the south) and melting (in the north) modifies the vertical velocity. This results in advection of warmer ice upwards and colder ice downwards, as discussed above. Second, the relatively higher surface temperatures (compared to upstream) give rise to a slight warming of the upper part of the ice column even in the north. This warming counteracts the freezing-induced cooling of the lower part of the ice column.
Impact of a coupled ice-sheet/lake system
The basal-mass-balance boundary condition (Fig. 2c) is derived from the model output of the lake-flow model ROMBAX, which is partly forced by the heat flux into the overlying ice sheet. Until now this was assumed to be constant, 33 mWm–2, where ice melts and zero where ice freezes (Reference Thoma, Mayer and GrosfeldThoma and others, 2008b). However, coupling ROMBAX with the ice-flow model RIMBAY allows modelling of the exchange parameters heat flux into the ice and basal mass balance between both numerical models in a consistent way. From the modelled temperature profile within the ice above Vostok Subglacial Lake (Fig. 5) the heat flux into the ice can be estimated according to Q ice = cp dT /dh, with the thermal conductivity of ice cp = 2.1WK–1 m–1 (Reference PatersonPaterson, 1994) and the temperature gradient at the ice base. This results in a spatially varying heat-flux pattern with an average of 38.9 mWm–2 as input for ROMBAX (Fig. 8a), and subsequently in a refined basal mass balance as input for RIMBAY (Fig. 8b and c). A detailed description of the coupling procedure is presented by Reference Thoma, Mayer and GrosfeldThoma and others (2010b)..
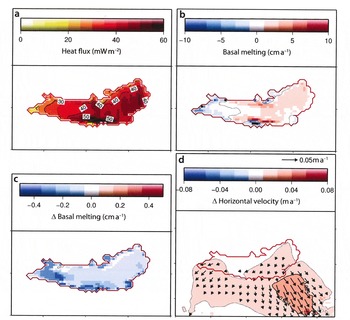
Fig. 8. (a) Heat flux into the ice sheet, according to the output of the ice-flow model RIMBAY, applied as an input boundary condition for the lake-flow model ROMBAX. (b) Basal-mass-balance boundary condition for RIMBAY according to the coupled system and (c) difference between Figures 2c and 8b. (d) Difference between the vertically averaged horizontal flow of the uncoupled (Fig. 4a) and coupled models (slightly extended map to demonstrate the downstream effect).
In general, the increased heat flux into the ice results in a decrease of the melting area by 7% (from ~ 1.15 × 10⁴ km2 to 1.07 × 10⁴ km2) and an increase of the freezing area by 35% (from 5.28 × 10³ km2 to 7.12 × 10³ km2) (Fig. 8b and c). Consequently, the total basal melting reduces from 0.0910 km3 a–1 to 0.0177 km3 a–1, leading to slightly warmer basal ice. However, the flow field changes only slightly with the interactive coupling of the ice- and lake-flow models. The ice flow increases by less than ~0.5% (Fig. 8d) above the lake and in its vicinity.
Discussion
The recent view of basal processes at the base of the Antarctic ice sheet suggests a widespread occurrence of liquid water (e.g. Reference PattynPattyn, 2010; Reference BellBell and others, 2011). This water drains into subglacial topographic depressions, indicated by more than 370 subglacial lakes. With our coupled modelling approach, we explicitly calculate the response of the ice flow on melting and freezing in the area of Vostok Subglacial Lake. The interaction between subglacial lakes and the Antarctic ice sheet has clear consequences for the ice dynamics. The increased flow velocity due to lubrication at the bed and the impact of melting and freezing on the thermodynamics are of great importance. Our model results indicate that the ice-flow velocity is also significantly increased downstream of the lake. In general, basal freezing increases the ice temperature by the upward advection of accreted ice at the pressure-melting point. Compared to regions of no basal freezing, this warming results in a significant decrease of the ice viscosity. According to Reference PatersonPaterson (1994, p. 97), the flow parameter, A, is modified by ~25% if we assume an average temperature of T ≈ –30°C and a deviation of ΔT ≈ 2°C. Hence the ice flow in warmer areas is slightly more decoupled from the surrounding flow field, and the local surface gradient gains more relevance for the flow direction. However, ice-sheet models, which neglect basal processes, misinterpret the impact of basal temperature because basal melting cools the ice while basal freezing leads to higher ice temperatures. We strongly recommend improving the treatment of subglacial hydrology in further model investigations. A prognostic version of the presented model might indicate that only the consideration of the complex basal-mass-balance pattern at the lake/ice interface is able to maintain the observed southward surface slope across Vostok Subglacial Lake, which would otherwise level (Reference Pattyn, De Smedt and SouchezPattyn and others, 2004). Interaction of ice sheets with subglacial water systems is not limited to subglacial lakes; in the transition zone between ice sheets and ice shelves (the grounding line), this interaction also plays a crucial role (e.g. Reference Vieli and PayneVieli and Payne, 2005; Reference SchoofSchoof, 2007; Reference Docquier, Perichon and PattynDocquier and others, 2011; Reference Favier, Gagliardini, Durand and ZwingerFavier and others, 2011). In future work we will expand our model to address these effects at the grounding line and over ice shelves and ice rises.
Acknowledgements
This work was funded by the German Research Foundation (DFG) through grant MA3347/2-1. This work was supported by funding from the ice2sea programme from the European Union 7th Framework Programme, grant No. 226375. This is ice2sea contribution No. 040. We thank Roland Warner, Heinrich Miller and Jürgen Determann for helpful discussions, Yetang Wang for providing his surface temperature data, Andrey Salamatin for providing the data of the Vostok station flowline track, Vladimir Lipenkov for providing measured temperature profiles, and Andrea Bleyer and Stefanie Klebe for proofreading.


