Introduction
Despite its significant role in both the global climate system and the regional monsoon circulation system, relatively little is known about climate over the Tibetan (Qinghai-Xizang) Plateau, largely because of the limited number of meteorological stations and the plateau’s unique topographic setting. A further problem is that the longest instrumental records from the region date back only to AD 1935. The sparsity of information about recent climate change over the Tibetan Plateau contrasts with our understanding of the general global increase in surface air temperature over the last few decades (Reference Jones, Raper, Bradley, Diaz, Kelly and WigleyJones and others, 1986; Reference Hansen and LebedeffHansen and Lebedeff, 1988), the general increase in precipitation over recent decades in the mid- and high latitudes and the decrease in precipitation in the subtropics (Reference Bradley, Diaz, Eischeid, Jones, Kelly and GoodessBradley and others, 1987; Reference Folland, Karl, Vinnikov, Houghton, Jenkins and EphraumsFolland and others, 1990). Clearly, more and longer records of both precipitation and temperature in this region are required in order to understand the plateau’s role in the global to regional climate system and to predict future climate for this region.
Ice cores recovered from the high mountains of Asia provide some of the best records of past climate in the region (Reference Mayewski, Lyons, Ahmad, Smith and PourchetMayewski and others, 1984; Reference Thompson, Xiaoling, Mosley-Thompson and ZichuThompson and others, 1988, Reference Thompson1989, Reference Thompson1995, Reference Thompson1997; Reference Yao and ThompsonYao and others, 1992, Reference Yao, Thompson, Keqin, Mosley-Thompson and Zhihong1995; Reference Hou, Dahe, Wake and MayewskiHou and others, 1999a). Interpretation of these records has been enhanced by spatially distributed, high-resolution studies of air, snow and ice throughout Asia (Reference WushikiWushiki, 1977; Reference Mayewski, Lyons and AhmadMayewski and others, 1981; Reference Mayewski, Lyons and AhmadMayewski and Lyons, 1983; Reference Wake, Mayewski and SpencerWake and others, 1990, Reference Wake, Mayewski, Zichu, Wang and Li1993; Reference Lyons, Wake, Mayewski, Davies, Tranter and JonesLyons and others, 1991; Reference Rozanski, Araguás-Araguas and GonfiantiniRozanski and others, 1992; Reference Wake and StiévenardWake and Stievenard, 1995; Reference Yao, Thompson, Mosley-Thompson, Zhihong, Xinping and Ping-NanYao and others, 1996; Reference HouHou and others 1999b). These studies were used as a guide to understanding the ice-core record of recent climate change in this work.
While the isotopic content of precipitation in polar regions is dominated by the temperature effect (Reference DansgaardDansgaard, 1964; Reference JouzelJouzel and others, 1987; Reference DansgaardDansgaard and others, 1993), there exists a strong inverse relationship between the δ 18O values in precipitation and the amount of precipitation in the tropics (Reference DansgaardDansgaard, 1964; Reference Rozanski, Araguás-Araguas, Gonfiantini, Swart, Lohmann, McKenzie and SavinRozanski and others, 1993). Furthermore, at tropical stations in monsoon climates (e.g. New Delhi and Hong Kong) mean monthly δ180 is inversely correlated with monthly temperature, confirming the dominant role of the amount effect in controlling the observed seasonal variations of δ18O in precipitation (Reference Rozanski, Araguás-Araguas, Gonfiantini, Swart, Lohmann, McKenzie and SavinRozanski and others, 1993). In southern regions of the Tibetan Plateau and the Himalaya, the amount effect dominates over the influence of variations of monthly mean «5180 in precipitation (Reference WushikiWushiki, 1977; Reference Wake and StiévenardWake and Stievenard, 1995), while in the northeastern regions of the plateau the moisture source is a major factor in the spatial distribution of δ18O, and air temperature is also a controlling factor on temporal fluctuations of δ18O (Reference Yao, Thompson, Mosley-Thompson, Zhihong, Xinping and Ping-NanYao and others, 1996).
The Glacier Retreat on Mount Everest
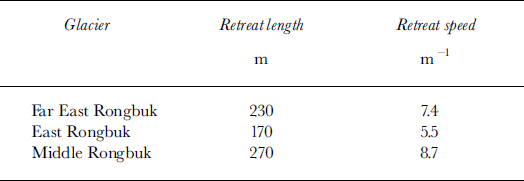
During the Sino-American Expedition to Mount Everest in 1997, Middle Rongbuk Glacier, East Rongbuk Glacier and Far East Rongbuk (FER) Glacier were investigated and their terminus locations were measured using global positioning system techniques (Reference Renjiawen and ZhefanRen and others, 1998). In 1966, locations of glaciers on Mount Everest were investigated using terrestrial stereoscopic photography. Comparison of the 1997 with the 1966 measurements shows that in the past 30 years the glacier has retreated 170–270 m, equivalent to a retreat speed of 5.5–8.7 ma–1 (Table 1). Other studies also show a general decrease in glacier extent over the Himalaya and the Tibetan Plateau (Reference Mayewski and JeschkeMayewski and Jeschke, 1979; Reference Rothlisberger and GeyhRothlisberger and Geyh, 1985; Reference Shi and JiawenShi and Ren, 1990; Reference Kadota and AgetaKadota and Ageta, 1992; Reference YamadaYamada and others, 1992; Reference Fujita, Nakawo, Fujii and PaudyalFujita and others, 1997). This suggests that climate in the region has generally been warming since the early 20th century.
Table 1. Fluctuations of the glacier terminus (serac area) in the northern Mount Everest region, 1966–97
Monsoon-Signal Records
During summer 1997, a 15.6 m firn core was recovered from a relatively flat part of Dasuopu glacier (28°23’N, 85°44’E; 7000 m a.s.l.) on the northwest margin of Xixabangma Feng in the central Himalaya (Fig. 1). The core was drilled using a Polar Ice Coring Office (PICO) shallow drill. Samples were collected at intervals of 5 cm (equivalent to about 30 samples per year) in a clean cold room. A total of 305 samples were obtained from the core. Oxygen-isotope analysis of all samples was performed using a Finnigan MAT-252 Spectrometer (accuracy 0.5%) in the Laboratory of Ice Core and Cold Regions Environment, Lanzhou, China.
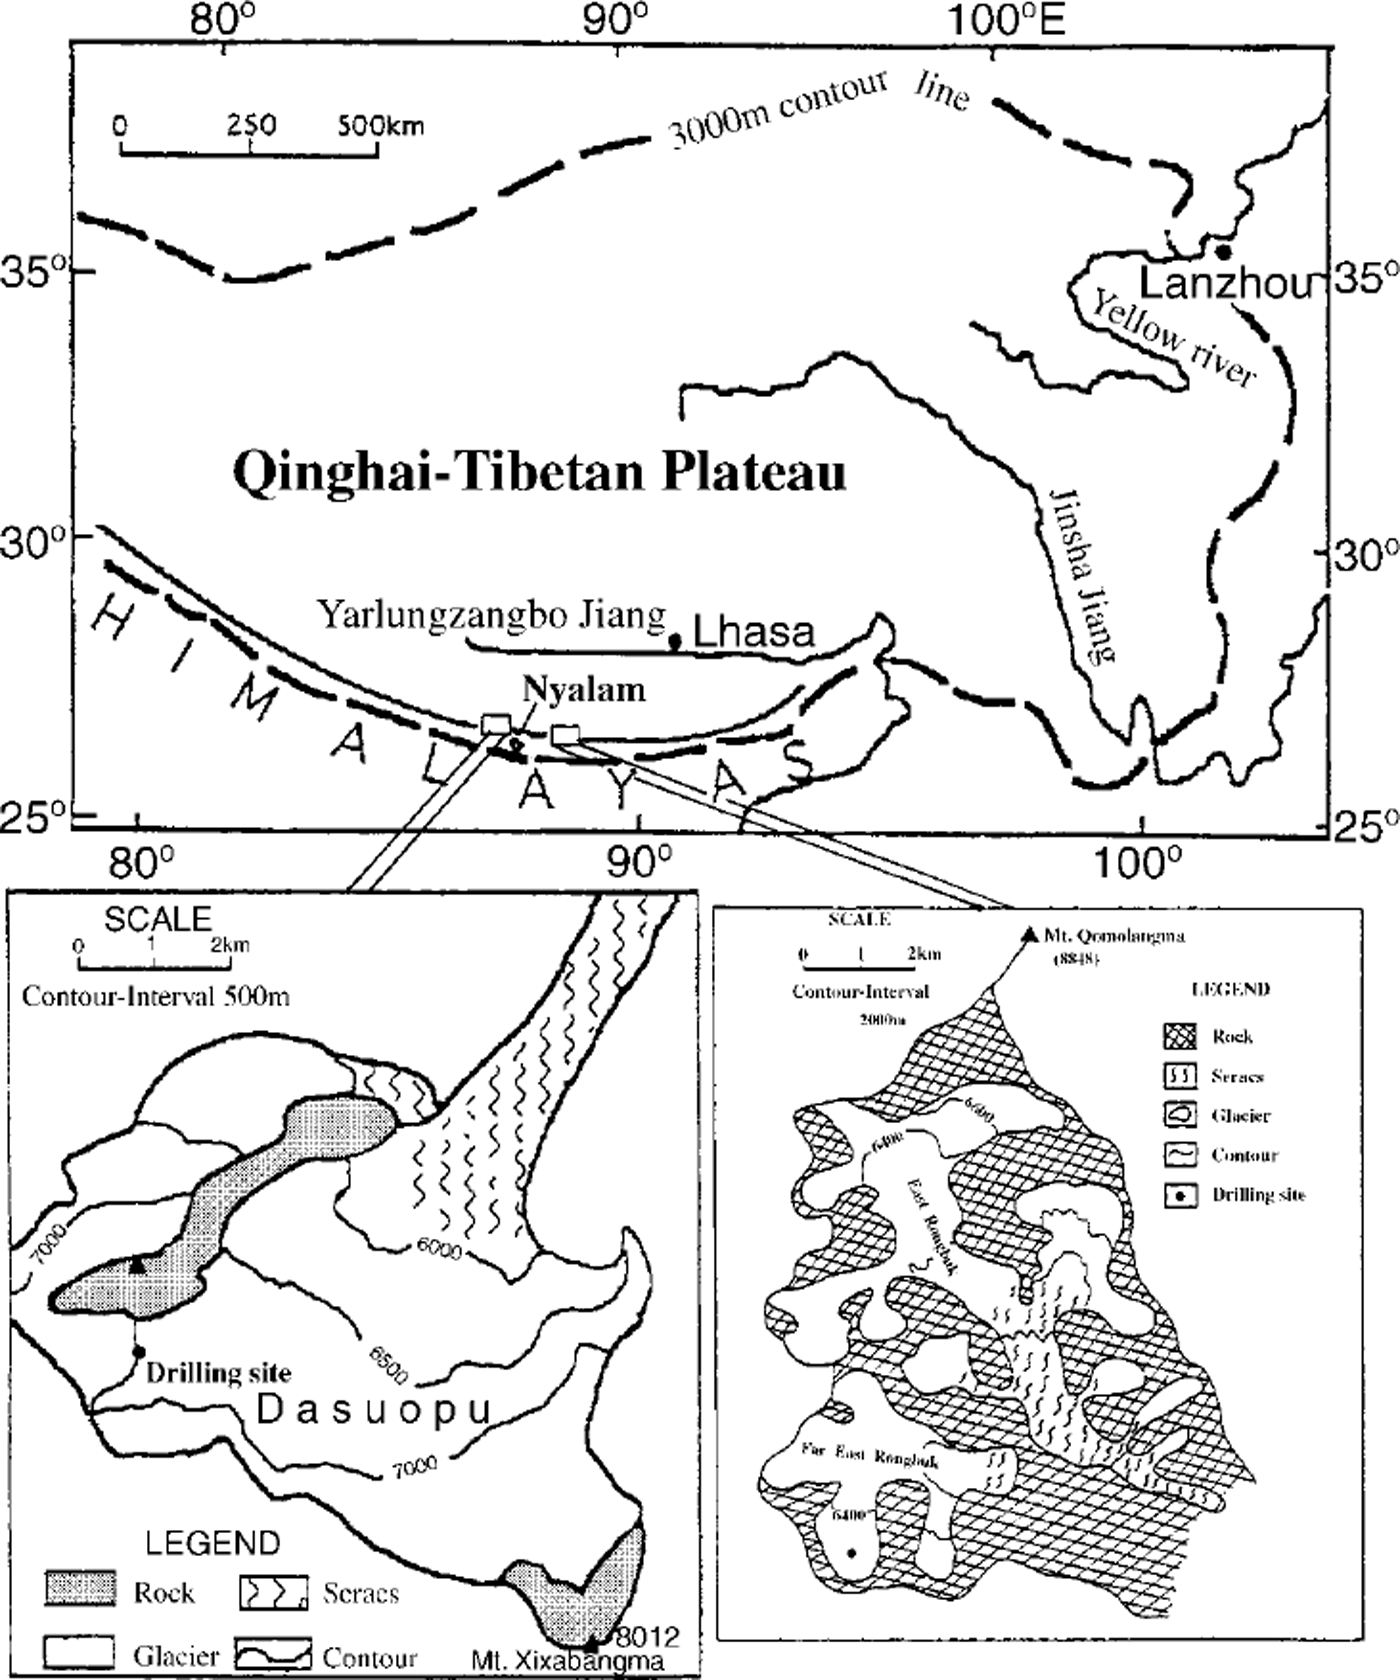
Fig. 1. Locations of ice cores in the central Himalaya.
This section focuses on the seasonal variation of δ 18O values. Profiles of δ180 values with depth are shown in Figure 2. The core was dated down to summer 1988 by counting annual peaks of δ180 values. Average annual accumulation rate in the past decade is 0.75 mwe. The 8 years for which there exists a complete annual record of δ18O values were used to study seasonal variability. Instrumental data from the closest meteorological station, Nyalam station (28°11’N, 85°58’ E; 3810 m a.s.l; 20 km southeast of the drill site), were compared with the core data. In order to compare seasonal signals in the firn core with meteorological data, δ18O values for each year (defined by the depth-age relationship) were assigned to 12 groups, with each group representing 1/12 of the annual accumulation. The time period of snow accumulation represented by each group was then calculated using the average seasonal distribution of annual precipitation at Nyalam station.
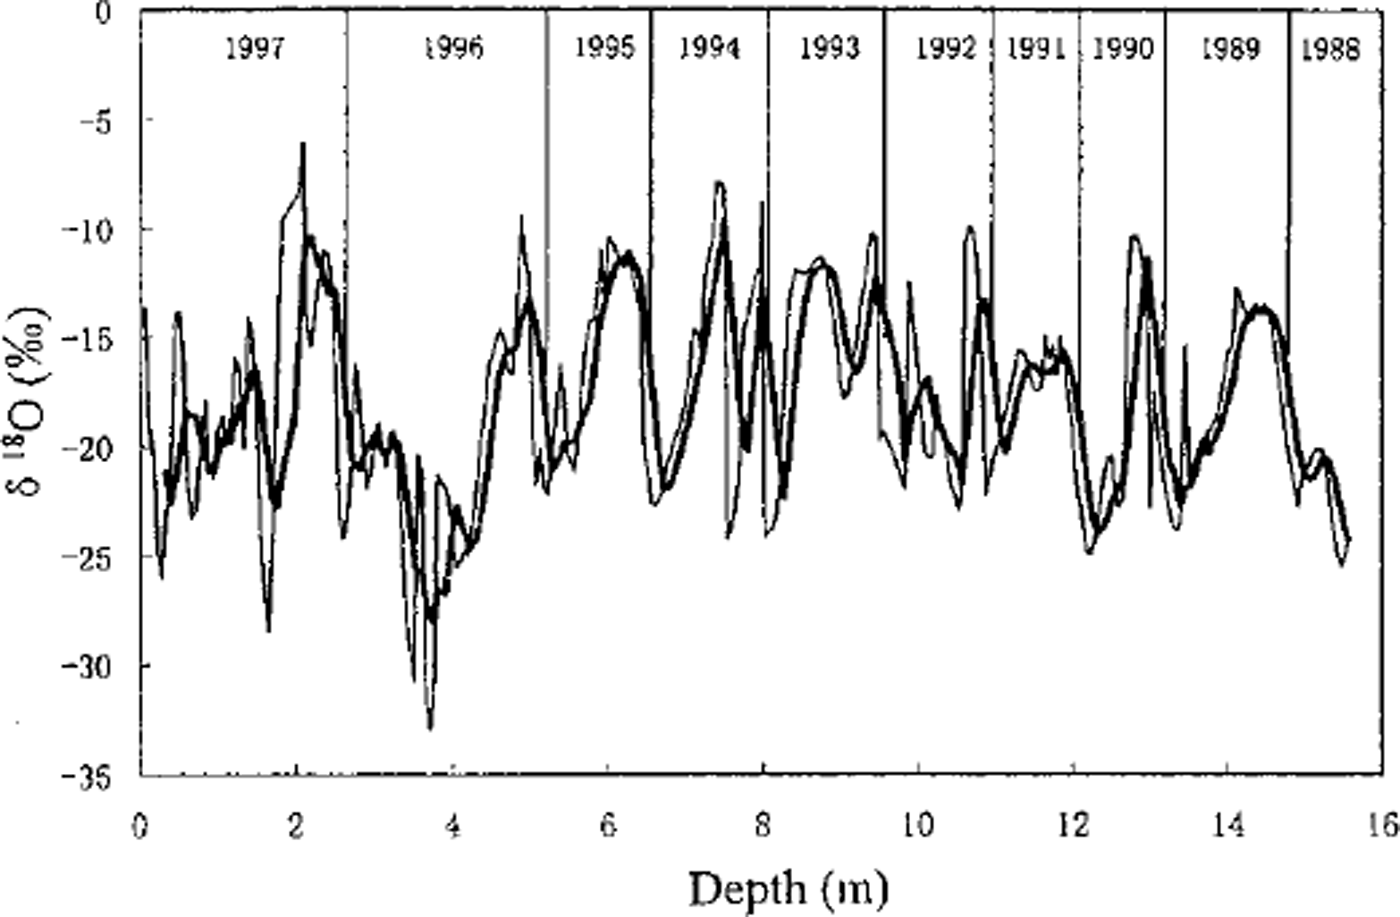
Fig. 2. Profile of δ180 with depth in Dasuopu6 firn core. Dating was performed by counting annual peaks of δ 18O values. The coarse line shows the smoothing trend using weighted smoothing (five points smoothing).
The most distinctive characteristic of the seasonal variations of δ18O is the low values that occur during the summer monsoon season (Fig. 3). In summer and early autumn, there is a strong inverse relationship between δ18O values and monthly precipitation at Nyalam station. The lowest δ18O value corresponds to the highest precipitation, indicating that the amount effect is dominant at 7000 ma.s.l. in Xixabangma region during the monsoon season. This agrees with other studies (Reference WushikiWushiki, 1977; Reference Grootes, Stuiver, Thompson and Mosley-ThompsonGrootes and others, 1989; Reference Rozanski, Araguás-Araguas, Gonfiantini, Swart, Lohmann, McKenzie and SavinRozanski and others, 1993; Reference Wake and StiévenardWake and Stievenard, 1995). From late winter to mid-spring, both δ18O and mean monthly temperature at Nyalam station increase, suggesting that δ18O values reflect air temperature during this period. Comparing seasonal variations of δ18O in Dasuopu core with those of δD in precipitation at Lhajung station located on the southern slope of the Himalayas (Reference WushikiWushiki, 1977), the same seasonal variation can be seen, the only difference being that the lowest δD value appears a little earlier at Lhajung than does the lowest δ18O value at Dasuopu.
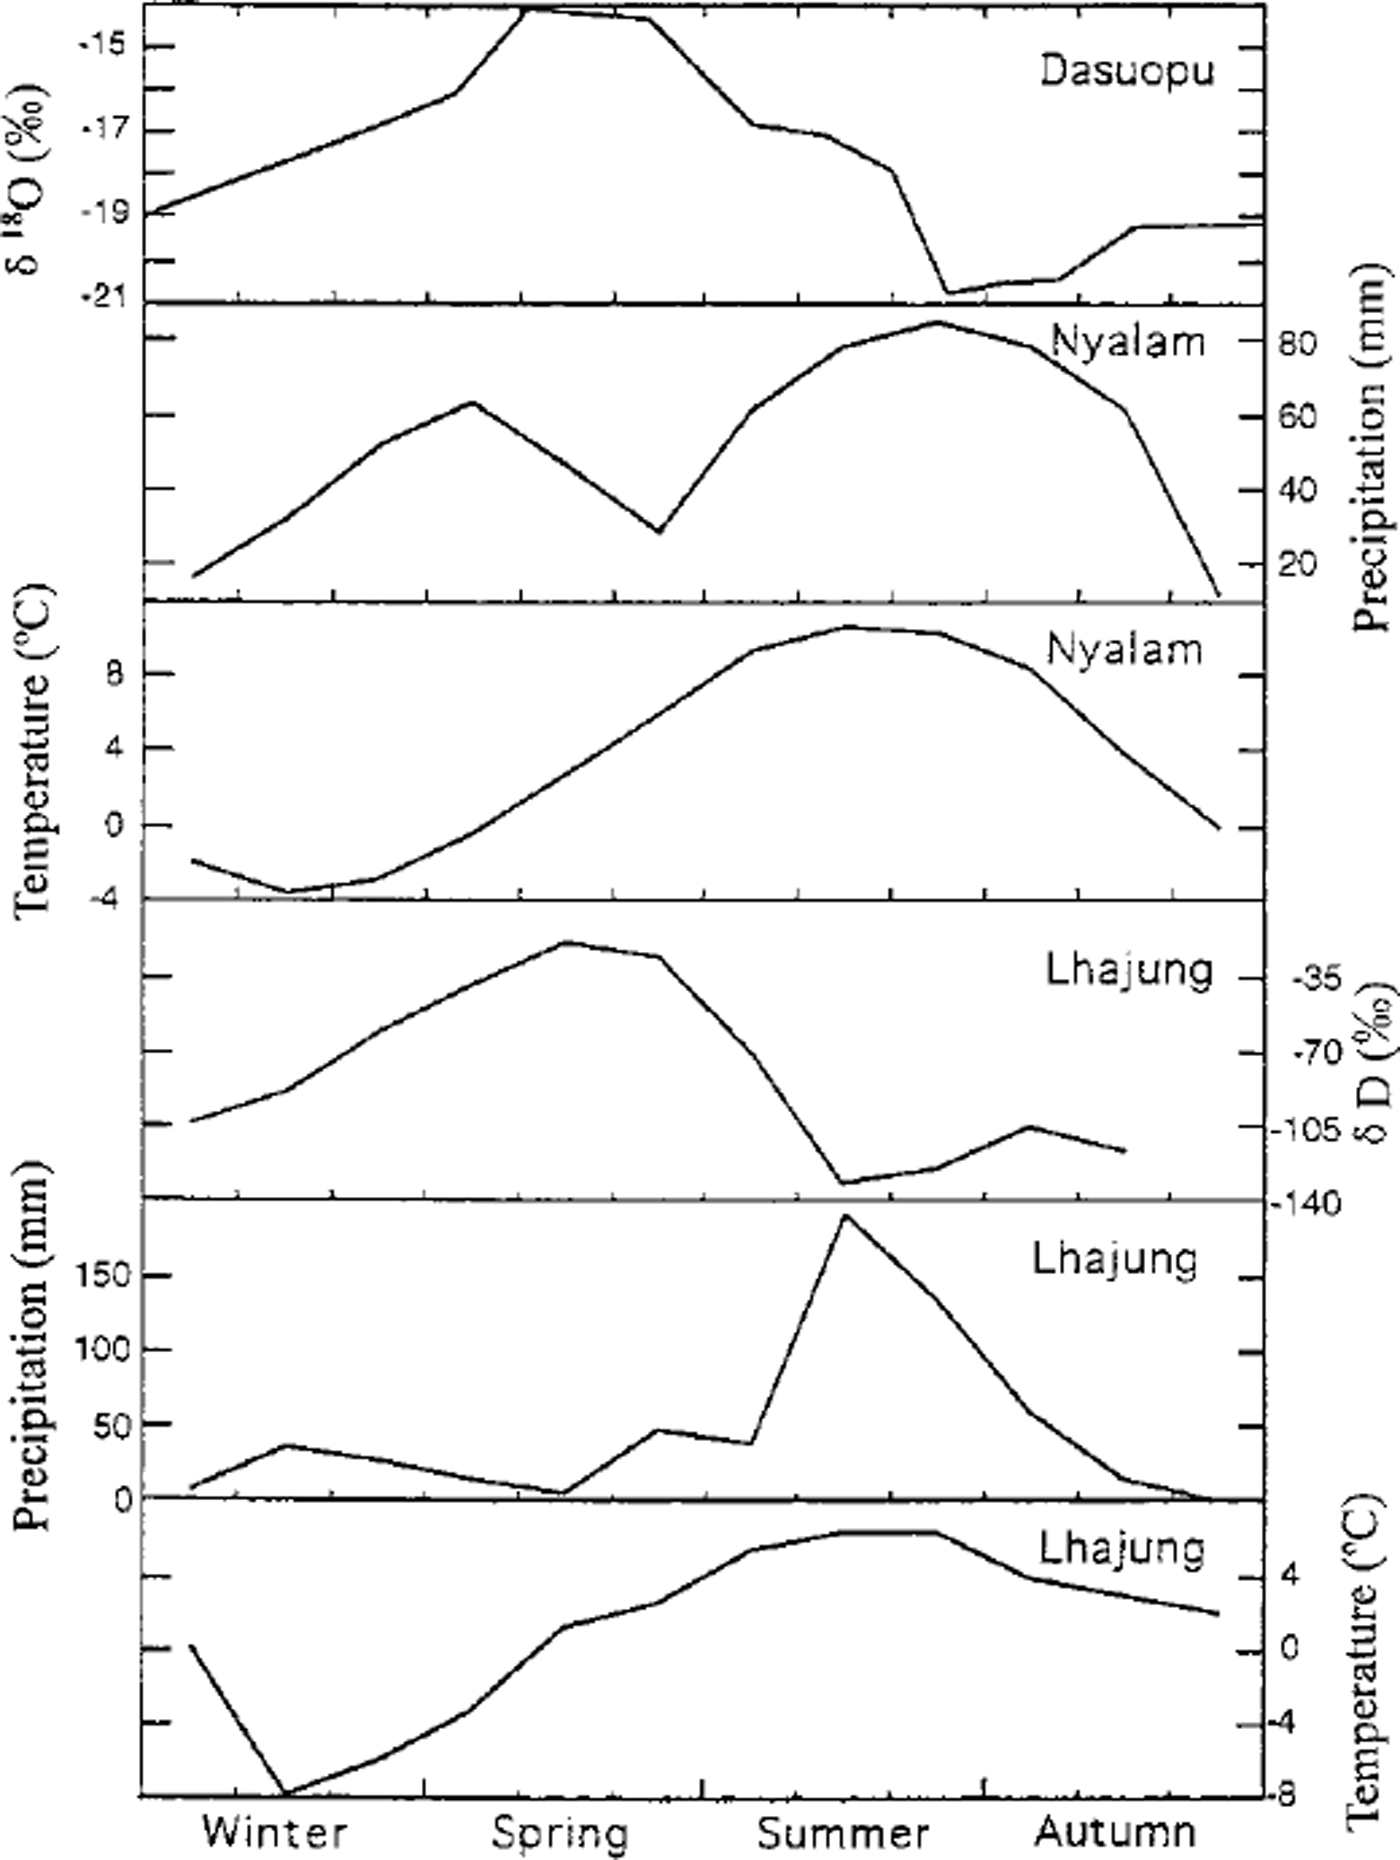
Fig. 3. Seasonal variations of ω518 0 in Dasuopu6 firn core, compared with monthly air temperature and precipitation at Nyalam meteorological station, and monthly SD, air temperature and precipitation at Lhajung meteorological station, April 1974–March 1975.
As in many tropical and subtropical locations, the more isotopically depleted snowfall (lower 5180 values) atDasuopu glacier occurs during the summer monsoon period due to the strong removal of the heavy-isotopic component during the intense monsoon rains spreading from the Indian coast to the Himalaya (Reference WushikiWushiki, 1977; Reference Rozanski, Araguás-Araguas, Gonfiantini, Swart, Lohmann, McKenzie and SavinRozanski and others, 1993). In the pre-monsoon period (spring), higher 5180 values in precipitation may be attributed to the direct transportation of water vapor from the Bay of Bengal almost without rainfall over the southern slope of the Himalaya, and could be dominated by the temperature effect (Reference WushikiWushiki, 1977). In summary, the greatest depletion of 5180 in the firn-core layer which accumulated during the summer monsoon season reflects the amount effect, and this monsoon signal (seasonal 5180 signal) is well preserved in snow and ice layers of the high-elevation Dasuopu glacier.
Climatic Significance of Long-Term 1 80 Record
In May 1997, a 41 m core, covering the period 1815–1997, was drilled at 6500 ma.s.l. on FER Glacier, approximately 13 km north of the peak of Mount Everest (Fig. 1). FER is a valley glacier approximately 9 km long, and about 150 m thick in the accumulation area from measurements at several locations with a portable radio-echo sounding device. The ice core was recovered from a relatively flat part of the accumulation area using a new light drill (Eclipse), and sampled at a resolution of 4 cm (∼5.4 samples per year). Current mean annual temperature (based on 10 m depth temperature) is –7°C Preservation of annual signals in the FER δ18O series (Fig. 4) can be distinguished based on calibration with known bomb horizons (lyear counting error at this level) identified in the well-preserved total /3–activity profile from this core.

Fig. 4. FER ice-core δ 18O series that emphasizes multi-decadal scale variability for AD 1814–1997. The coarse line shows the smoothing trend using weighted smoothing (five points smoothing).
As mentioned above, in the central Himalaya the annual 5180 variation was controlled by precipitation amount in summer and by temperature in winter. To investigate the climatic significance of the long-term FER 5180 record, it is compared with instrumental and summary series of precipitation, regional atmospheric circulation and temperature.
The longest instrumental precipitation records in the Tibetan Plateau come from Lhasa and cover the period 1935–90. Longer, more densely spaced precipitation records are available for India for the period 1871–1991 (Reference Parthasarathy, Sontakke, Monot and KothawaleParthasarathy and others, 1987, Reference Parthasarathy, Rupa Kumar and Kothawale1992). These areas are along paths taken by summer moisture entering the southern margin of the Tibetan Plateau, and are therefore utilized in this study. Empirical orthogonal function (EOF) analyses (Reference Meeker, Mayewski, Bloomfield and DelmasMeeker and others, 1995) of the Indian data reveal significant covariance between the FER 5180 time series and observations from northeast, northwest and southern India. Three representative regional series were selected for use in this study: region 3 for precipitation in northeast India (NE India Summer precipitation), region 13 for precipitation in northwest India (NW India Summer precipitation) and region 34 for precipitation in south India (S India Summer precipitation). A regional atmospheric circulation index that estimates the relative strength of the summer Southeast Asian low (SELMIN) over the period 1899–1997 was developed, based on the work of Reference Trenberth and PaolinoTrenberth and Paolino (1980), by determining the annual summer minima in sea-level pressure within the region 15–60° N, 40–136° E. Regional temperature, for the period 1880–1997 were taken from Reference Hansen and LebedeffHansen and Lebedeff (1988) and Reference Hansen, Ruedy and SatoHansen and others (1996).
To explore the potential influence of changes in temperature on the FER «5180 series during the summer (primary) period of moisture flux to FER Glacier, we use the summer series available from Geographic Information System (GIS) box 21 (Tibetan Plateau Su. tmp.) and GIS box 36 (India Su. tmp.), as well as GIS box 21 annual values (Tibetan Plat. Ann. tmp.). The longest period of overlap for FER ,5180, SELMIN, GIS box temperatures and Indian precipitation is 1899–1991. If Lhasa precipitation is added, the longest period of overlap is 1935–91. Since all of the meteorological values are reported as annual values, FER «5180 was resampled to yield average annual values (Fig. 5a).
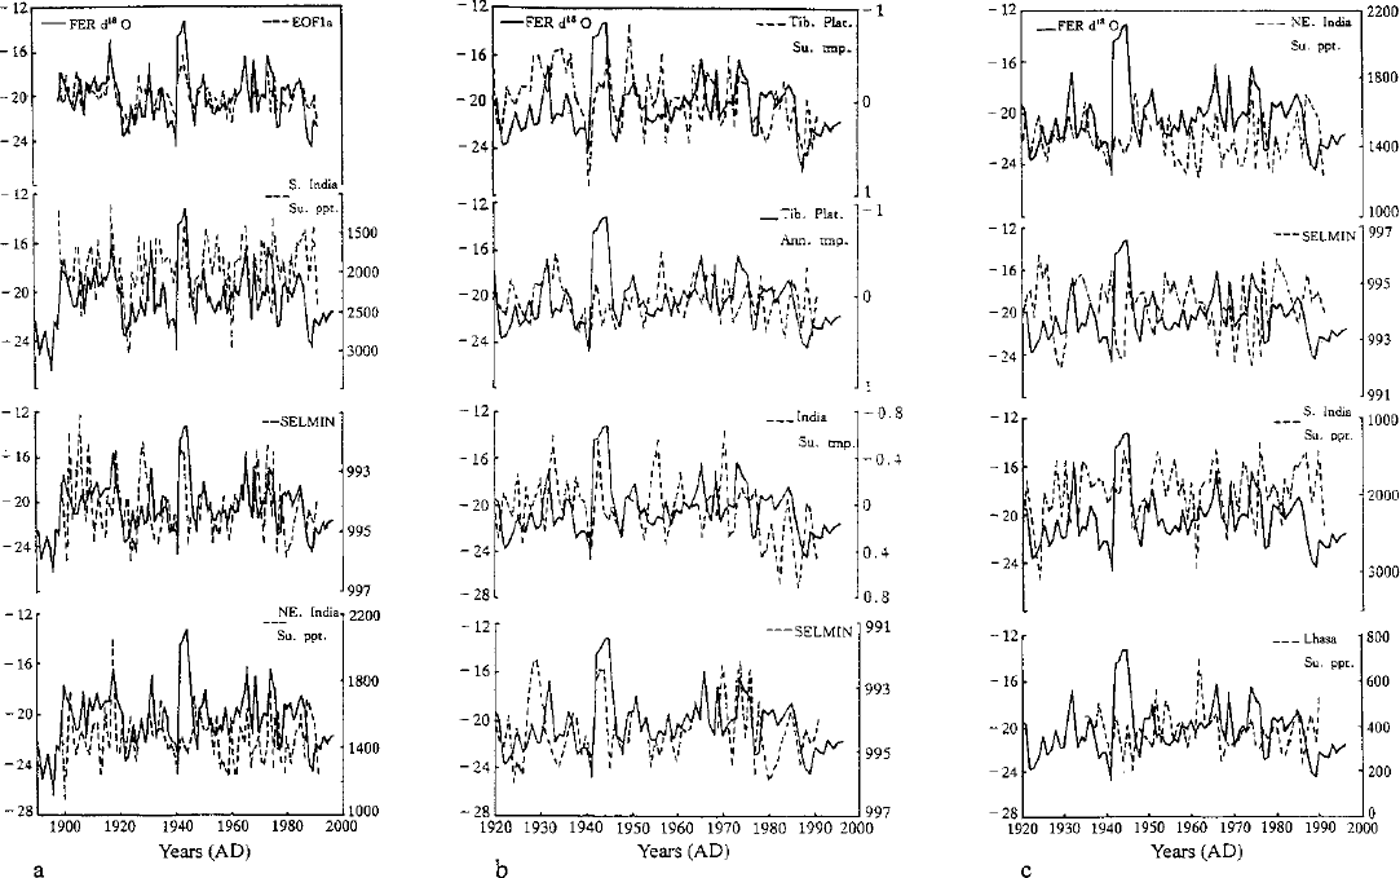
Fig. 5. (a) Annually averaged FER tee-core δ180 series (per mil) compared to EOFla δ18 O series, SELMIN (mbar), ME India Summer precipitation (mm), S India Summer precipitation (mm) and Tibetan Plateau annual temperature (˚–C). (b) Annually averaged FER ice-core δ 18O series (per mil) compared to Tibetan Plateau annual temperature (˚C), SELMIN (mbar) and Lhasa Summer precipitation (mm), (c) Annually averaged FER ice-core δ 18O series (per mil) compared to SELMIN (mbar), NE India Summer precipitation (mm), S India Summer precipitation (mm) and Lkasaprecipitation (mm). All data sources of (a), (b) and (c) are described in text.
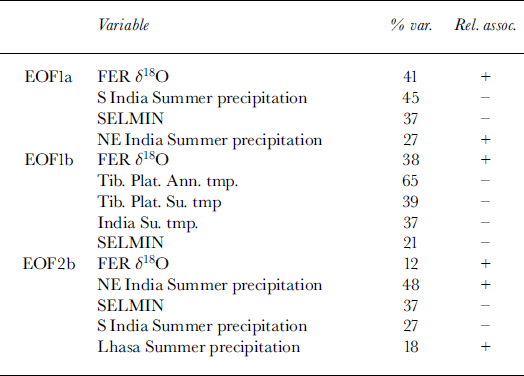
Results of the EOFanalyses for the two time intervals reveal the following associations (see Table 2). For the period AD 1899–1991, EOFla explains a significant amount of the variance in FER 5180, S India Summer precipitation, SELMIN and NE India Summer precipitation. FER δ18O is positively associated with NE India Summer precipitation and negatively associated with SELMIN and s India Summer precipitation. NW India Summer precipitation, Tibetan Plateau temperatures and India summer temperatures have minimal or no association on this EOF (Fig. 5a). Thus FER «5180 variability is strongly associated with precipitation in regions that fall within convergence zones for near-surface, 700 mbar summer atmospheric flow, namely, from S India and NE India to the FER ice-core site. The inverse association between FER δ18O and S India Summer precipitation is to be expected given the influence of precipitation amount on 5180 (Reference WushikiWushiki, 1977; Reference Grootes, Stuiver, Thompson and Mosley-ThompsonGrootes and others, 1989; Reference Rozanski, Araguás-Araguas, Gonfiantini, Swart, Lohmann, McKenzie and SavinRozanski and others, 1993; Reference Wake and StiévenardWake and Stievenard, 1995). It is concluded that the direct relationship between FER 5180 and NE India Summer precipitation reflects the influence of local moisture transport to FER that has undergone minimal isotopic fractionation.
Table 2. EOF associations for time periods a (1899–1991) and b (1935–91)
Several prominent FER 5180 events (e.g. 1942–46) are associated with prominent SELMIN events. Since these covering series are associated inversely, we assume that deeper Southeast Asian lows result in more vigorous transport of moisture to FER. This assumption is consistent with the positive association between NE India Summer precipitation (proximal to FER) and less negative FER 5180 values noted above. In summary, a deeper Southeast Asian low is associated with more vigorous transport to FER, higher precipitation in NE India and less fractionated (less negative) 5180 values at FER. Previous studies have also suggested that changes in atmospheric circulation in the form of stronger (weaker) monsoons are associated with glacier advance (retreat) throughout the Himalaya and the surrounding region (Reference Mayewski and JeschkeMayewski and Jeschke, 1979).
Examination of the relationships among FER δ18O values and meteorological records over the period 1935–91 reveals marked differences with the associations described for the 1899–1991 period. EOFlb explains a significant amount of the variance in the FER δ18O series and is negatively associated with much of the variance inTibetan Plat. Ann. tmp., Tibetan Plat. Su. tmp., India Su. tmp. and SELMIN (Table 2; Fig. 5b). Therefore, the 1935–90 EOFlb analysis reveals that primary associations of FER δ18O with moisture and atmospheric circulation, which dominated from 1899 onwards, have been replaced since approximately the 1940s by an association with temperature and atmospheric circulation (Fig. 5b). Further, the relationship between temperature and FER δ18O revealed by EOFlb is negative (Fig. 5b), in contrast to the classic δ18O-temperature association expected in polar regions and northern Tibet. Thus the general temperature increase noted over India and the Tibetan Plateau since the 1970s (Reference Kang, Tandong, Dahe and YupingKang and others, 1998) is associated with more negative FER δ18O values. As noted in Figure 4, although displaying multi-annual-scale variability the generally more negative δ180 values since 1960 appear to be part of a repeating structure similar to that commencing in 1875 and 1900–20. However, the meteorological associations or controls appear to be different, according to our EOF analysis. We assume that the general temperature increase over this vast region, which is strongly associated with FER δ18O, may have resulted in decreased thermal gradient over the region encompassing India and the Tibetan Plateau. This decrease, when coupled with a weakened Southeast Asian low, would reduce the strength of moisture-bearing circulation entering NE India and the Tibetan Plateau. Thus, the FER ice-core δ180 record provides a proxy for moisture flux to theTibetan Plateau that is consistent with instrumental series from Lhasa. However, the FER δ18O record provides additional spatial detailing, a longer record and evidence of the potential influence of warming on atmospheric circulation in the region.
On a second EOF, EOF2b (orthogonal to EOFlb), the classic, pre-1935, association of FER 5180 with precipitation and atmospheric circulation is evident (Table 2; Fig. 5c). More negative FER «5180 values appear to be associated with a deeper Southeast Asian low, as expected from the pre-1935 portion of the record, and during such events both NE India Summer precipitation and Lhasa Summer precipitation increase while S India Summer precipitation decreases.
Since the mid-1960s, Lhasa Summer precipitation has been variable, but has generally decreased, especially from the 1960s to the 1980s (Table 3) (Reference Kang, Tandong, Dahe and YupingKang and others, 1998). If it is associated with FER 5180, as suggested above, the correlation may not always be evident on an annual basis, although it is clear at the multi-annual scale (Fig. 5c). The complex multiple controls on FER δ18O levels may be averaged out over multi-annual scales, revealing the general trends noted above. We suggest that the current FER 5180/Lhasa Summer precipitation is controlled by changes in atmospheric circulation and temperature. From about 1940 to the 1970s, Southeast Asian low circulation deepened, driving precipitation more vigorously into the Tibetan Plateau. In addition, general cooling during this period may have increased thermal gradients, leading to more vigorous penetration of moisture into the Tibetan Plateau. During the period from the 1970s to about 1990, Southeast Asian low circulation generally weakened andTibetan Plat. tmp. increased, while, as noted earlier, Lhasa Summer precipitation decreased. Temperature increases may lead to changes in atmospheric circulation that are less conducive to penetration of moisture-bearing air masses into theTibetan Plateau.
Table 3. Annual precipitation (mm) over 10year periods at Lhasa meteorological station

Based on the assumption that the amount effect and atmospheric circulation are the primary controls on δ18O in the southern part of the Tibetan Plateau during the pre-1940 period, we examine the full FER δ18O record covering the period 1815–1997 (Fig. 4). The record displays significant decadal-scale variability and a prominent offset in values occurring around 1900. Prior to 1900, δ18O values are generally more negative, and after 1900 generally less negative. If these changes are related to precipitation and atmospheric circulation, as deduced from our study, then δ18O values for the earlier part of the record indicate either decreased transport of moisture into the region or a significant alteration in circulation patterns, both of which yield increased isotopic fractionation (more negative values). Therefore the presence of more advanced glaciers in the Himalaya prior to 1900 was likely a consequence of the preservation of existing moisture through lower temperatures and decreased ablation.
In conclusion, our results have three important implications. First, ice-core stable-isotope records outside of polar regions are not as easy to interpret as those within polar regions. Second, controls on the isotopic fractionation of moisture deposited on the southern margin of the Tibetan Plateau have changed over the last few decades. Third, increases in temperature over the last few decades have led to changes in atmospheric circulation that have resulted in a decrease in moisture flux to the Tibetan Plateau.
Acknowledgements
We wish to thank M. Gerasomov of Icefield Inc. for expert drilling, and Qin Xiang, Longjiangping, Shao Wenzhang, S. Whitlow and others for their hard work in the field. The project is supported by Atmospheric Sciences, the U. S. National Science Foundation, and the Chinese Academy of Sciences (Major Programs KZ951-A1-402 and KZ951–A1–204), the Ministry of Science and Technology (Climbing Projects 95–yu-40 and 95–yu-24) and the National Natural Science Foundation of China (49871022).


