


Introduction
In snowy regions, snowmelt is important for water resources, although it may cause landslides and snowmelt floods. Prediction of snowmelt rates and their distributions in mountain areas is important for watershed management. Predictions can be based upon energy budgets using a physics-based method, though we find some empirical parameters are necessary. Energy budgets of open sites have been discussed in many studies (Reference AndersonAnderson, 1968;Reference Harding Harding, 1986; Reference Gray and LandineGray and Landine, 1988).
Many mountain areas are covered with forests which affect snowmelt rates. Reference Troendle and KingTroendle and King (1985) pointed out that snowmelt runoff from a watershed was increased by forest cutting. Reference ShimizuShimizu (1990) reported that clear-cutting of the forest advanced snowmelt runoff period in a watershed, about 80% of which was covered by deciduous forests. Reference Koike, Takahashi and YoshinoKoike and others (1985) and Reference Ohta, Hashimoto and IshibashiOhta and others (1990) reported that solar radiation and wind speed decreased in forests compared with those at open sites. Reference Hendrie, PriceG, Colbeck and RayHendrie and Price (1979) demonstrated that turbulent heat exchange over a melting snow cover in a leafless deciduous forest could be ignored in predicting snowmelt rates, and that net radiation above a snow cover was an efficient predictor. Reference PricePrice (1988) also showed that the turbulent exchanges were less than 10% of daily melt energy and that net radiation was the major component for snowmelt in a deciduous forest.
As forests affect snowmelt rates, it is important to predict changes of snowmelt runoff characteristics caused by such forest operations as timber cutting. Comparisons of differences between energy balance at an open and a forested site are needed to evaluate effects of forests on snowmelt rates: however, there have been very few such reports. This paper, therefore, considers the influences of a deciduous forest, the major land-cover type in snowy northern Japan, on snowmelt rates by the comparisons of energy budget above snow covers at an open and a forested site.
Sites and Methods
The observation station (Fig. 1) is located at the foot of Mount Iwate (39°50′N, 140°58′ E) at an altitude of 490 m a.s.l. Observations began during winter 1989.
There are two adjacent sites, one flat and open, the other flat, under deciduous forest cover. The average height of trees is about 10 m and stand density is about 80000 trees km−. The canopy is perfectly closed in the summer, but there are no leaves during snowmelt season.
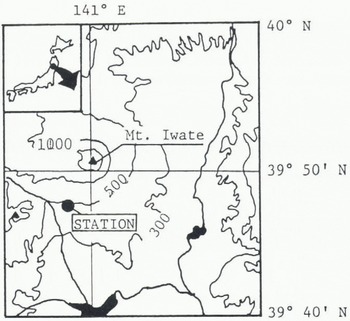
Fig. 1. Location and map of the observation station, Japan.
Snowmelt rates were measured by tipping buckets and lysimeters of area 1 m2, one in the open, and one in the forest. Slits were made in a plastic board of 3 mm thickness to protect the snowmelt waterflow between the snow cover on the lysimeters and that around them. Meteorological elements observed at the two sites were solar radiation, net radiation, temperature, relative humidity and wind speed, integrated or averaged over a period of 1 h. Observation height was about 1.5 m above the snow surface. Precipitation was observed only at the open site.
Measurements
Daily Snowmelt Rates
Differences between the amount of precipitation and the total snowmelt at the two sites were less than 24.1 mm during the snow-covered seasons, which was 6.8% of the amount of precipitation. There was very little snowmelt water transfer between the snow cover on the lysimeters and that around them.
Melting began at both sites on 25 February 1990 and 5 March 1991. Total snow water equivalences in the open and forested site at the start of the 1990 melt season were 157 mm and 167 mm, respectively; in 1991 they were 276 mm and 266 mm. Snow cover disappeared at the forest site nine days later than at the open site in 1990, and four days later in 1991, although snow water equivalences were almost the same at the starts of the thaws. Figure 2 shows the relationship between daily snowmelt rates at the open site and those at the forest site.
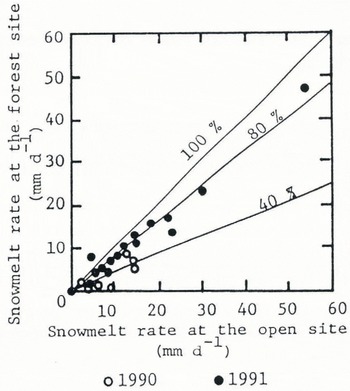
Fig. 2. Relationship between daily snowmelt rates at the open site and the forested site.
Ratios of the snowmelt rates at the forested site to those at the open site were 0.4:0.75 and 0.4:0.85 in 1990 and 1991, respectively. Thus effects of a deciduous forest on snowmelt rates cannot be ignored.
Meteorological Elements
It is hypothesized that the lower snowmelt rates at the forested site were caused by the differences of the meteorological condition between the two sites. Relationships of hourly values for each meteorological element observed at the two sites can be described as a linear relation:
where X f and X o are the meteorological values at the forested site and the open site, and a and b are the coefficients. Units of X o and X f are MJ m−2 h−1 on solar radiation and net radiation, °C on temperature, % on relative humidity and m sec−1 on wind speed. The values of a do not have units and the values of 6 have the same units for each element, a is called the relative ratio in this paper.
Values of α for hourly solar radiation, net radiation and wind speed were, respectively, 0.62, 0.80 and 0.29 during the 1990 melt season, and during the 1991 melt season were 0.70, 0.76 and 0.61. Values of a for temperature and relative humidity were close to 1 during the two melt seasons. Values of b for each element, except net radiation, were very close to zero, but values for net radiation were −2.50MJ m−2h−1 and −2.54 MJ m−2 h−1 during the 1990 and 1991 melt seasons, respectively. The coefficients of correlations were not less than 0.9 for each relationship.
Energy Budget Analysis of Surface Snowmelt
Modeling Snowmelt Rate by the Energy Budget Method
The energy budget on a snow surface can be written as
where Q m is energy for snowmelt or change of snow temperature, R n is net radiation, Η is sensible heat, LE is latent heat, Ρ is energy from rainfall and C is energy conducted through the snow surface layer. Under melting conditions, C is 0. The values of R n in Equation (2) are the values observed at the two sites.
According to the bulk method, Η and LE are described as
where p is the density of the air (kg m−3), C p is the specific heat of the air at constant pressure (MJ kg−1), Tz and T 0 are air temperatures (°C) at observed height z (m) and 0 (m), Uz is the wind speed (m sec−1) at height z, L is the latent heat of vaporization for water (MJ kg−1), P a is the air pressure (mb), ez is the vapor pressure (mb) at height 0 with the snow temperature T 0, and Kh and Ke are bulk coefficients. Values of Kh and Ke are determined by trial and error. Reference Ishikawa, Kobayashi and KojimaIshikawa and others (1982) reported that air temperature was higher than snow surface temperature for many hours in the melting season. The same tendency was recorded in this area, using hand-operated equipment. Therefore, T 0 is calculated by an empirical equation obtained in this area during the melting season, although it is considered that the snow surface temperature is occasionally higher than air temperature. The equations are described as

Ρ in Equation (2) can be written as
where c w is the specific heat of water (MJ kg−1 ) and R is the amount of precipitation in a unit of time (mm). In this region, it has been reported that the frequencies of snowfall occupied about 50% of the precipitation events when Tz was 1.5°–2.0°C (Reference OhtaOhta, 1989). Therefore, it is assumed in this paper that precipitiation is regarded as snowfall when Tz is less than 1.75°C.
During the melt seasons, values of Q m were negative at night in this area and so it is assumed that the snow temperature was sometimes below 0°C during the night. Nocturnal cooling of the snow cover will be due to the energy loss from the snow. Snowmelt will not occur immediately after values of Q m become positive, because it is considered that positive energy is used to increase the snow temperature to 0°C. In this paper, it is assumed that snowmelt flow at the base of the pack will occur after the integrated negative energy becomes zero.
Calculations of hourly snowmelt rates were carried out continuously from the first snowmelt day until the day before the snow cover disappeared. Figure 3 shows the relationships between observed and estimated daily snowmelt rates obtained by integration of hourly values from 1800 h one day to 1800 h the next day. The relative error will be large in a day when snowmelt rates are small, even if the absolute error is small. Values of relative error for the days when the snowmelt rates were not less than 8 mm d−1 were 0.150 and 0.171 at the open site and forested site, respectively. Bulk coefficients in Equations (3) and (4) were 0.002 at both sites and the effects of the forest on the coefficients were not taken into account.
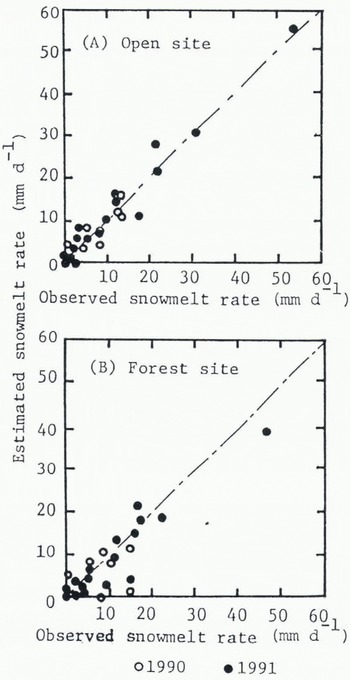
Fig. 3. Relationships between observed and estimated daily snowmelt rates at the two sites.
Energy Balance at the Observation Sites
Rainfall occurred twice, on 4 March 1990 and 20 March 1991, but energy from the rainfall was not more than 1% of daily snowmelt heat. Therefore, this component was ignored in the energy balance discussion.
Figure 4 shows energy budget for daily snowmelt at the two sites in 1991. Net radiation (R n) comprised more than 70% of the daily snowmelt energy over many days and the major energy component was net radiation at both sites. This tendency agreed with the results reported by Hendrie and Reference Hendrie, PriceG, Colbeck and RayPrice (1979) and Reference PricePrice (1988), but the percentages of R n of the snowmelt energy at the sites were less than those of the previously reported results. In this paper, these days are called “usual melting days”.
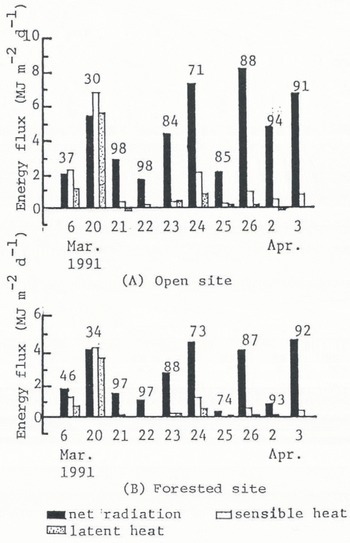
Fig. 4. Energy budget for daily snowmelt rates at the two sites. Numerical values expressed at the tops of the bars are the percentages of Rn of the daily snowmelt heat.
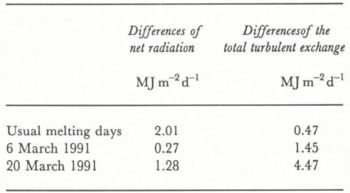
Percentages of R a in snowmelt energy were small on 6 and 20 March 1991. Table 1 shows the average values of the meteorological elements during the daytime, 0600–1800 h, on these two days and usual melting days. Temperature, vapor pressure and wind speed on the two days were greater than those on usual melting days. Table 2 shows the differences between the energy balance components at the open site and the forested site. The difference between R n at the two sites was greater than that of the total turbulent exchange on usual melting days, but opposite tendencies were found on the two days. The extremely large snowmelt rate was caused by very warm, moist and windy conditions, because the total turbulent exchange increased.
Table 1 Mean meteorological conditions during daytime on the two typical energy budgets
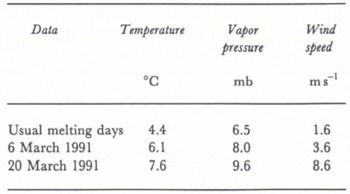
Table 2 Differences of the energy balance components between the open site and the forested site
Relation Between Decrease of Snowmelt Rates at the Forested Site and the Components of Energy Budget
Which component in the energy budget controls the differences between snowmelt rates at the open site and the forested site? Two parameters are used in this discussion. They provide relative decrease of snowmelt energy and of energy budget components, R n, H and LE, at the forested site, normalized by the snowmelt energy at the open site. The former is represented by I 0 and the latter by I. They are described as where Q mo and Q mf are the daily snowmelt energy at the open site and the forested site, and X o and X f are daily values of the energy budget components in Q mo and Q mf. An energy budget component for which values of I and I 0 are the same controls the differences between snowmelt rates at the two sites.
Figure 5 demonstrates the relationships between I 0 and I for the three energy components, R n, H and LE. The dots on R n shown in Figure 5A are distributed along the line which indicates that values of are equal to those of I 0, except the dots 6 and 20 March 1991. Differences of total turbulent exchange were greater than that of R n on the two days, as shown in Table 2, and so the values of I and I 0 on R n on these two days show a great difference when compared with those on other days. On the other hand, gradients of the relationships on H and LE shown in Figure 5B and C are close to zero. Thus the decrease of snowmelt rates at the forested site is strongly affected by the differences of R n between the two sites over many days.
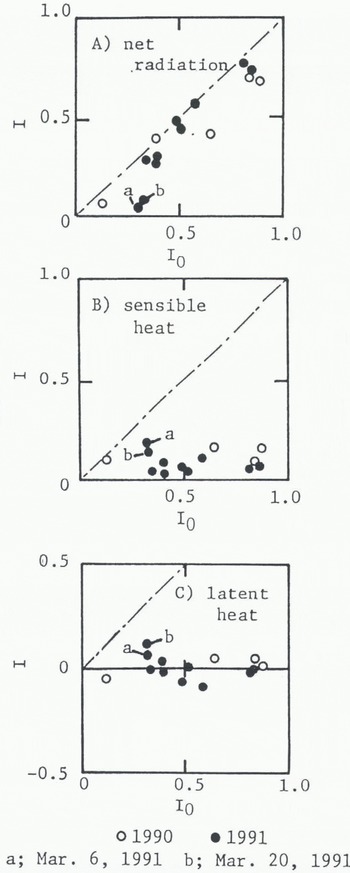
Fig. 5. Relationships between the decrease of the snowmelt energy (I0) and the decrease of the energy budget components (I), normalized by the snowmelt energy at the open site.
Dependency on Net Radiation of Differences Between Snowmelt Rates at the Forested and the Open Site
The decrease of snowmelt rates at the forested site strongly depended on difference of R n between the two sites on usual melting days. The percentages of R n in the snowmelt energy were reduced under the specific condition, as mentioned above. It is supposed that the dependency on net radiation of the differences between snowmelt rates at the two sites under the specific meteorological conditions of high temperature, high humidity and high wind speed is different from that under the usual meteorological conditions. Therefore, we discussed the dependency of R n on the differences between the snowmelt rates at the two sites under fixed meteorological conditions.
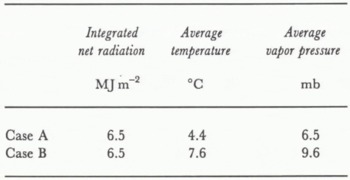
Two average meteorological conditions, except wind speed, are considered at the open site during daytime 0600–1800 h, as shown in Table 3. Case A represents the condition on usual melting days and case Β represents the condition when R n is not the major component. These values are determined from Table 1.
Table 3 Two meteorological conditions for the simulation on the dependency of the decrease of snowmelt rates at a forested site on net radiation
Values of Q m in Equation (2) were positive during daytime over many days in the snowmelt seasons. A part of the positive energy balance is used to increase the snow temperature to 0°C, as mentioned above. The daily snowmelt energy is rewritten as
where subscripts o and f show the values at an open site and a forested site, respectively, Q s is the positive energy during the daytime and C is the nocturnal negative energy emitted from the snow. Average values of C o and C f during the melting seasons were −2. 21 MJ m−2 and −2.06 MJ m−2.
Under the supposition that temperature, humidity and bulk coefficients are the same at open and forested sites, values of Q so and Q sf are described as
where w is equivalent to a for wind speed in Equation (1), c and d are also equivalent to a and b on R n in Equation (1), and c and d are 0.75 and −0.184 MJ m−2, respectively. Values of c and d are determined from the relationship between integrated net radiation during daytime at the two sites.
Net radiation used in daily snowmelt in this analysis is calculated as follows: the percentages of R n in positive energy during daytime (about 71%) and negative energy during night-time (about 77%) at the two sites were almost the same. Therefore, effective values of R n in the daily snowmelt energy are described as
where
Dependency of the differences between the daily snowmelt rates at an open and a forested site on R n is expressed by an index (DP) written as
Values of DP in the observed results were not less than 0.69 except on 6 and 20 March 1991, when the values were 0.19 and 0.21.
Two simulations were carried out by this method. In simulation 1, under the two meteorological conditions at an open site shown in Table 3, changes of DP with wind speed at an open site were investigated, with the value of tu in Equation (12) fixed at 0.6. In simulation 2, under the same meteorological conditions, changes of DP with values of w were discussed, when wind speeds at an open site were fixed on 2, 4, 6 and 8m s−1.
Figure 6 shows the results of simulation 1. The values of DP decreased with the increase of wind speed at the open site for the two cases shown in Table 3. In case A, which represents meteorological conditions on usual melting days, it is considered that the differences of daily snowmelt rates depend on R n when wind speed at an open site is not more than 4.0 ms−1. The lower snowmelt rates at the forested site which were observed by this measurement could be explained by R n, because wind speed at the open site was not so high over many days. But, differences between turbulent heat exchanges at an open and a forested site are more notable as wind speed increases at an open site, because the relationship between wind speed at an open site and a forested site can be represented by a linear relation. Therefore, the dependency of the differences between snowmelt rates at an open and a forested site on R n is decreased with the increase of wind speed at an open site. The results of case Β indicate that this tendency will be notable when it is warm and moist. This result suggests that the dependency of the differences between snowmelt rates in an open and a forested site on R n is changed by wind speed, even if the other meteorological conditions are the same at an open site.
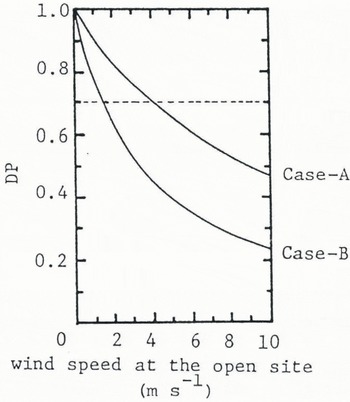
Fig. 6. Changes of DP with wind speed at the open site under a fixed relative ratio for wind speed (simulation 1).
Figure 7 shows the results of simulation 2. Values of DP decrease with decrease of the values of w. It is considered that the dependency of the differences between snowmelt rates at a high-density forest and an open site on R n is less than that at a low-density forest and an open site, because wind speed may be weakened in a high-density forest. Also, the difference between the turbulent transfer at an open site and a high-density forest is greater than that between an open site and a low-density forest.
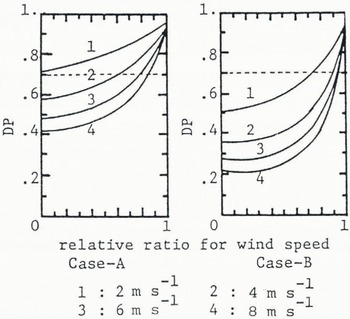
Fig. 7. Changes of DP with relative ratio for wind speed under constant wind speed at the open site (simulation 2).
Conclusions
Observations and analyses in this paper have shown the following:
(1) Solar radiation, net radiation and wind speed were strongly reduced at the forested site and the daily snowmelt rates at the forested site were consequently decreased to 40–85% of those at the open site.
(2) The energy budget method was effective for the prediction of the snowmelt rates at the open site and the forested site. The major energy component for the snowmelt energy was net radiation, and the percentage of net radiation in the daily snowmelt energy was not less than 70% at both sites over many days. However, this percentage was decreased and differences between the total turbulent exchanges at the two sites were greater than that of net radiation, when temperature, humidity and wind speed were high. Extremely large snowmelt rates occurred under these meteorological conditions.
(3) Decrease of daily snowmelt rates at the forested site depended on net radiation over many days. It was shown by a parametric analysis that the dependency of the differences between the snowmelt rates at a forested site and an open site on net radiation was reduced with the increase of wind speed at an open site and that this tendency was notable when it was warm and moist. It was also suggested that tree density affects this dependency on net radiation, because the difference between wind speed at an open and a forested site was influenced by the tree density.
Acknowledgements
This work was aided by two Grants-in-Aid for Scientific Research (No. 02454069, chief: Y. Fukushima; No. 02760086, chief: T. Ohta) from the Ministry of Education, Science and Culture, Japan. The authors would like to acknowledge the kindness of the Resources and Energy Section of Iwate Prefecture and Mr S. Tatesawa, who are owners of the observation station.


