1. Introduction
It is essential to determine the dielectric properties of snow to carry out glaciological research in polar regions. The velocity of electromagnetic waves, which must be known for radio-echo soundings in glaciers, ice sheets and snow cover, can be determined from these properties. Satellite remote sensing also requires knowledge of dielectric properties since these control the reflection, scattering, emission and penetration of the waves in a snow layer. Despite its importance, the dielectric nature of snow has not yet been well understood; it is difficult to understand because of the complexity of snow structure and its spatio-temporal variability. For example, in the case of dry snow, the real part of the relative complex permittivity ε′ (referred to as the permittivity in this paper) is mostly dependent on the volume fraction of ice and air. However, the influence of snow structure on the permittivity is not clearly understood, although the influence has been predicted in theoretical studies.
The dielectric properties of snow have been measured in the field and laboratories using various instruments. For example, Reference Tiuri, Sihvola, Nyfors and HallikainenTiuri and others (1984) used cylindrical cavity resonators to measure the permittivity of snow in Finland. They proposed an empirical relationship between ε′ and snow density in microwave frequencies. Similar relationships have been reported in many studies (e.g. Reference CummingCumming, 1952; Reference Ambach, Denoth and RangoAmbach and Denoth, 1980; Reference Hallikainen, Ulaby and AbdelrazikHallikainen and others, 1986; Reference DenothDenoth, 1989; Reference Kovacs, Gow and MoreyKovacs and others, 1995; Reference MätzlerMätzler, 1996). These studies indicate that ε′ is mostly controlled by the density, and observed density dependence is consistent with dielectric mixture theory (e.g. Reference Polder and van SantenPolder and Van Santen, 1946; Reference TaylorTaylor, 1965; Reference Tinga, Voss and BlosseyTinga and others, 1973). Reference ColbeckColbeck (1982) discussed the influence of snow structure on the permittivity using experimental data. This effect is believed to be important for interpreting dielectric properties obtained for different snow conditions. For example, Reference Lytle and JezekLytle and Jezek (1994) found that the permittivity of firn from Greenland was dependent on the direction of the electric field. They attributed the observed dielectric anisotropy to the snow grains that were elongated in the vertical direction under the influence of thermal gradient near the surface.
In Antarctica, radio-echo soundings and satellite remote sensing are crucial methods for studying the ice sheet. However, very few ground measurements of dielectric properties have been made, especially for surface snow layers in the interior of the continent. Reference Shiraiwa, Shoji, Saito, Yokoyama and WatanabeShiraiwa and others (1996) measured the permittivity and density in the upper 1m at six locations between the Mizuho and Dome F stations in East Antarctica (70.5–74˚S, 43–45˚E; 2250–3350 m a.s.l.). The measured ε′ was not very well correlated with the snow density. Reference Kärkäs, Martma and SonninenKärkäs and others (2005) conducted dielectric measurements in 1–2 m deep snow pits in western Dronning Maud Land (72.5–75˚S, 10–16.5˚W; 2250–3350 m a.s.l.). From data obtained using two different instruments, they found relationships between the permittivity and density, but the correlation coefficients were relatively low (r=0.48 and 0.59). These studies indicate the complexity of dielectric properties of snow and the difficulties in performing these measurements in the field.
To better understand the physical properties of snow in Antarctica, we carried out 1m deep snow-pit measurements during the Japanese–Swedish Antarctic Expedition (JASE) 2007/08. In this paper, we present the results of dielectric measurements conducted in the microwave frequency range. The relationship between the permittivity and snow density was determined using more than 2000 data points collected along the traversed 2800 km inland route. Our data serve as the basis for snow and ice radar measurements and as a reference for satellite remote sensing in Antarctica.
2. Method
2.1. Study site
During the 2007/08 austral summer season, a traverse expedition was carried out by Japanese and Swedish teams in East Antarctica between Japanese inland base S16 (30 km from Syowa station, 69˚03’ S, 40˚04’ E) and Swedish Wasa station (73˚04’ S, 13˚41’ W) (Fig. 1 ; Table 1) (Reference Holmlund, Fujita and ThorénHolmlund and Fujita, 2009). The two teams departed from their home stations in snow vehicles in November 2007 and met at the point 75˚89’ S, 25˚83’ E on 27 December 2007. The distance of the meeting point from each of the starting points was approximately 1400 km. The teams exchanged some of the expedition members and scientific instruments before they began their return trips, so that various research activities could be carried out along the entire stretch from S16 to Wasa (approximately 2800 km).
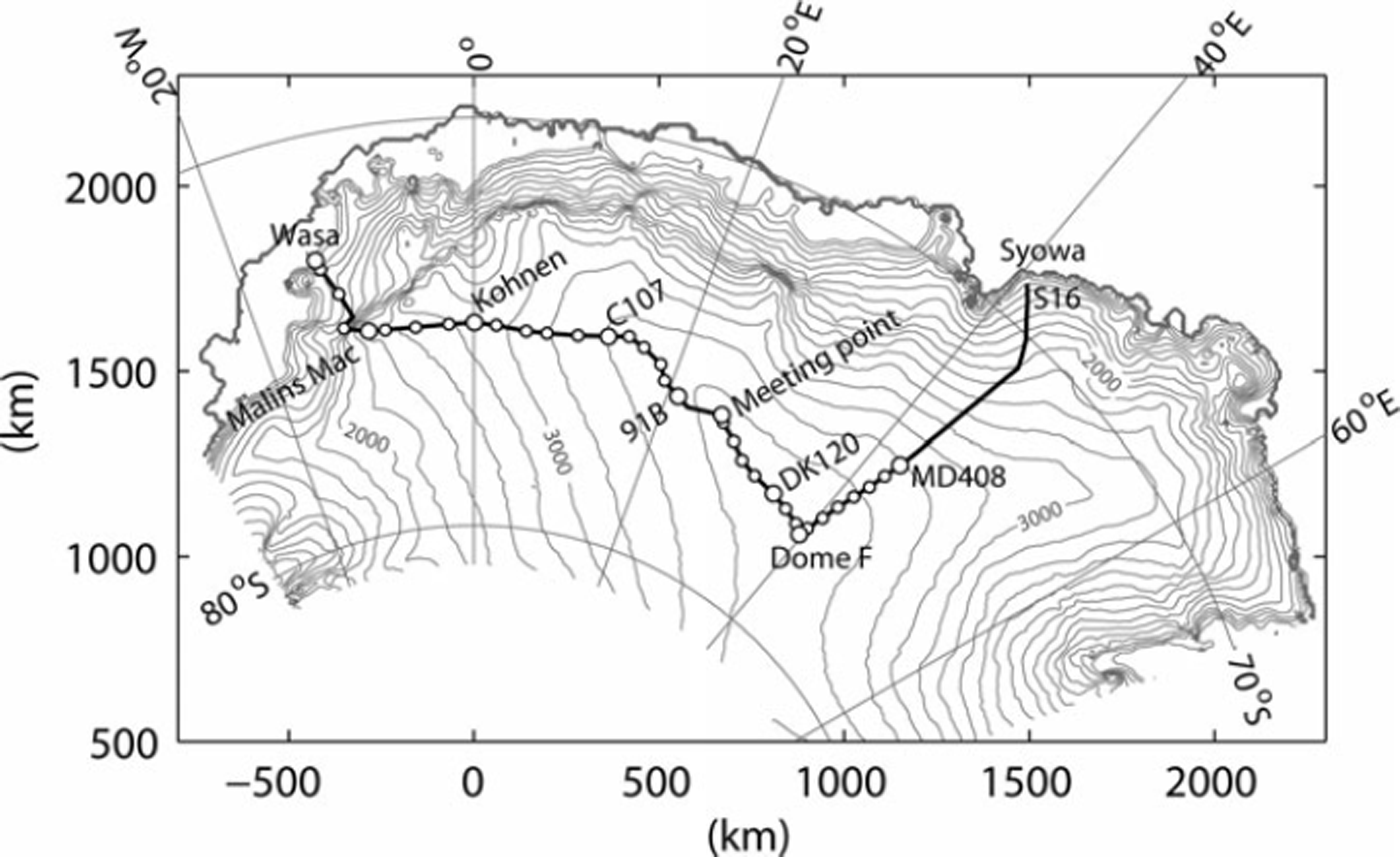
Fig. 1. Map of the studied region of Antarctica along with the route traversed in the JASE 2007/08. Open circles denote the location of the snow-pit measurements. Contour lines represent the surface elevation at intervals of 200m based on Reference Bamber and BindschadlerBamber and Bindschadler (1997).
Table 1. Sites along the expedition route referred to in the text
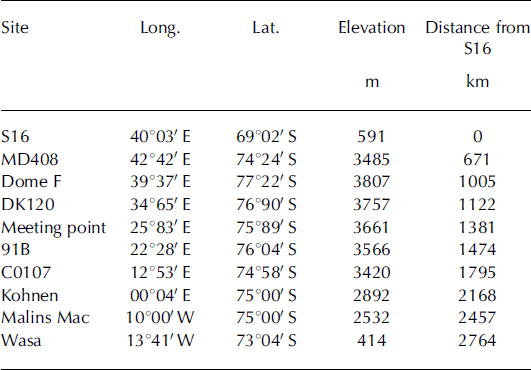
The permittivity and density were measured in the upper 1 m snow layer at 35 locations along the route (Fig. 1 ; Table 1). The first measurement was made 671 km inland from S16 (MD408) on 2 December 2007. We repeated the measurements along the rest of the expedition route at intervals of approximately 20–100km until the final measurement at Wasa station was completed on 28 January 2008. The elevation of the measurement site increased from 3485 m (MD408) to 3807 m (Dome F), and then gradually decreased to 2500 m at a point 290 km west of Kohnen station. From this point, the route descended steeply from the high inland plateau to the coastal region. Annual snow layer thicknesses near the surface are 50–200 mm for the section between MD408 and Dome F (Reference Furukawa, Kamiyama and MaenoFurukawa and others, 1996), 140–250 mm in the vicinity of Kohnen (Reference Oerter, Graf, Wilhelms, Minikin and MillerOerter and others, 1999) and 550 ± 1 1 0 mm for the coastal region near Wasa (Karkas and others, 2005). Thus, the uppermost 1 m of snow cover consists of several to more than ten annual layers.
2.2. Permittivity measurements
The permittivity was measured using Snow Fork model LJ 9902, a microwave resonator probe manufactured by Toikka Engineering Ltd in Finland (Reference Sihvola and TiuriSihvola and Tiuri, 1986). This device measures the resonance spectrum using a parallel-wire transmission-line resonator to determine the complex permittivity in the frequency range 500–900MHz. Its performance was tested and compared with other instruments using Alpine snow (Reference DenothDenoth and others, 1984). The imaginary part of the permittivity can be neglected when the snow is dry, as it is expected to be in the studied region. Thus, we consider only the real part of the permittivity, e0, in this study. The permittivity was calculated from the resonant frequencies measured in air, f a, and snow, f s:

The snow-fork measurement was carried out using a 1 m deep snow-pit wall (Fig. 2). Parallel wires of the resonator, 60mm long and separated by an 18mm distance, were pushed into the snow wall at intervals of 30mm from the surface to 1 m depth. We measured the resonant frequency twice at a fixed depth by positioning the parallel wires of the resonator in horizontal and vertical alignment. In these two measurements, the directions of the electric field induced by the resonator are both in the horizontal plane. Reference measurements were made in air before and after a series of the measurements were completed, and the mean value was used for the calculation of ε′ The total mean of f a was 891.7MHz with a standard deviation of 4.0 MHz, which compares with the ideal value of this instrument (887–888MHz) within the accuracy of the resonant frequency (±5 MHz). The accuracy of ε′ by the snow-fork measurement is reported as ±1.5%, and the possible effect of snow densification due to the insertion of the parallel-wire resonator is +(1.5–3.0)% (Reference Sihvola and TiuriSihvola and Tiuri, 1986).
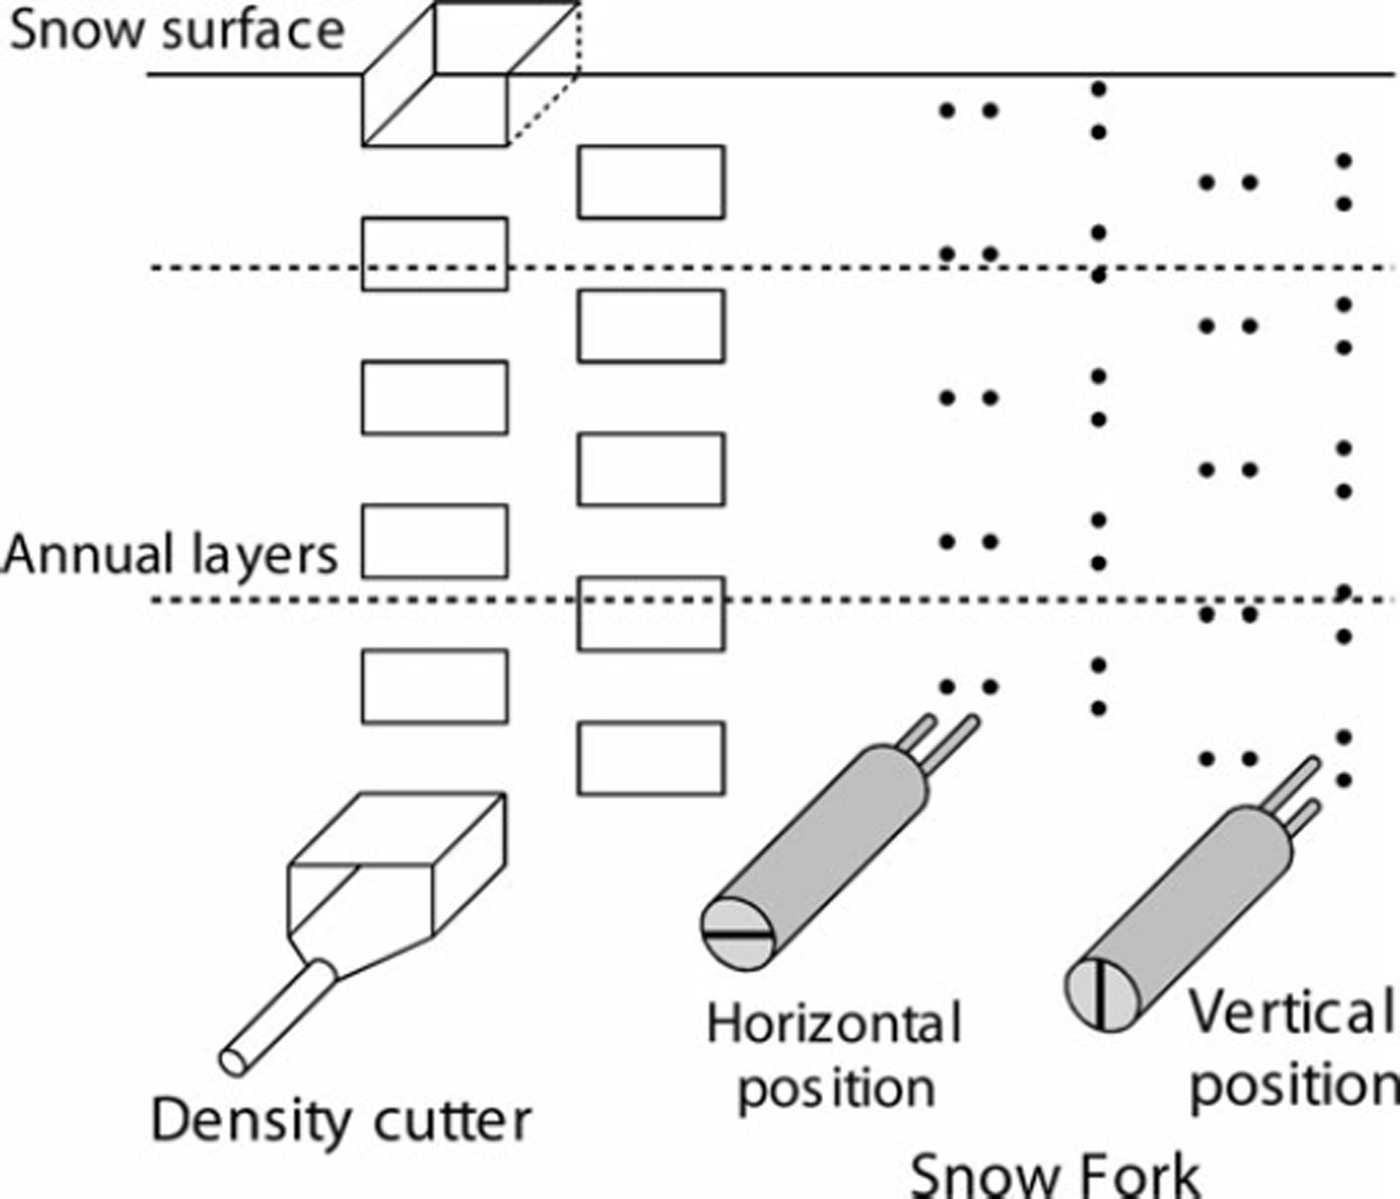
Fig. 2. Schematic diagram showing the permittivity and density measurements. Intervals of the measurements in the vertical direction are 30mm.
2.3. Density measurements
The snow density was measured by sampling a 30 mm thick block using a box-type stainless density cutter (30 mm × 60 mm × 56 mm, Climate Engineering Co.). A digital bench scale (CS200, OHAUS Co.) with a resolution of ±0.1 g was used for weighing the snow block. The accuracy of the density measured using similar devices is reported as ± 4% (Reference Conger and McClungConger and McClung, 2009). The sampling was performed from the surface to 1 m depth at intervals of 30 mm (Fig. 2). The central sampling depth corresponded to the points of the snow-fork measurement, so the density can be compared with the permittivity at the same level. The horizontal distance between the density and snow-fork measurements was within 1 m. Stratigraphical information (snow structure and grain size) was also recorded following the guidelines given by Reference ColbeckColbeck and others (1990).
3. Results
As typical examples of the measurement data, the vertical profiles of the permittivity and density are shown along with snow stratigraphy (Fig. 3). The structure of the snow in the upper 1m snow layer was dominated by faceted crystals (solid-type depth hoar) and depth hoar consisting of medium (0.5–1.0 mm) to coarse (1.0–2.0) grains (Fig. 4a). For simplicity, we refer to both these structures as depth hoar in the remainder of this paper. A very hard compacted snow layer with a thickness of 10–100 mm was also observed. Fine snow grains (0.2–0.5 mm) were bonded tightly, forming a very hard and relatively dense layer (Fig. 4b). Crust layers with a thickness of several millimeters were also commonly observed.
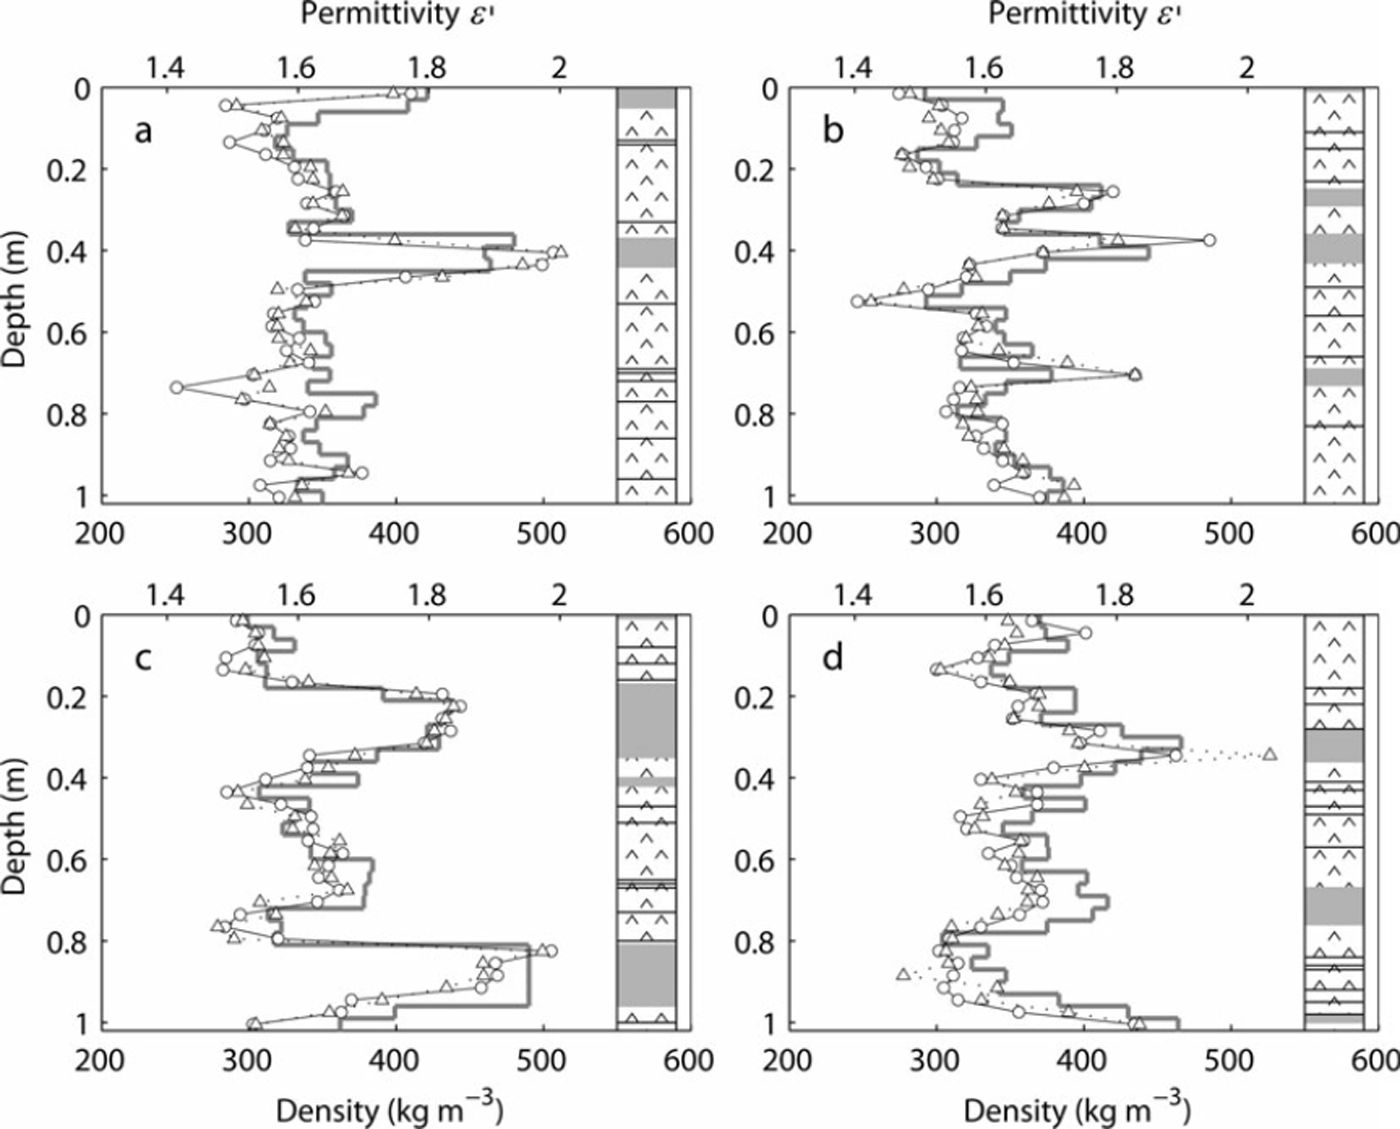
Fig. 3. Permittivity (o, A), density (grey line) and stratigraphy measured at (a) DK120 (76˚90’S, 34˚65’E), (b) 91B (76˚04’S, 22˚28’E), (c) C0107 (74˚58’S, 12˚53’ E) and (d) Malins Mac (75˚00’S, 10˚00’W) (Fig. 1; Table 1). The permittivity was measured when the resonator was horizontally (o) and vertically (A) positioned. The snow structures are classified as faceted crystals and depth hoar (A), compacted snow (grey) and a crust layer (solid line).
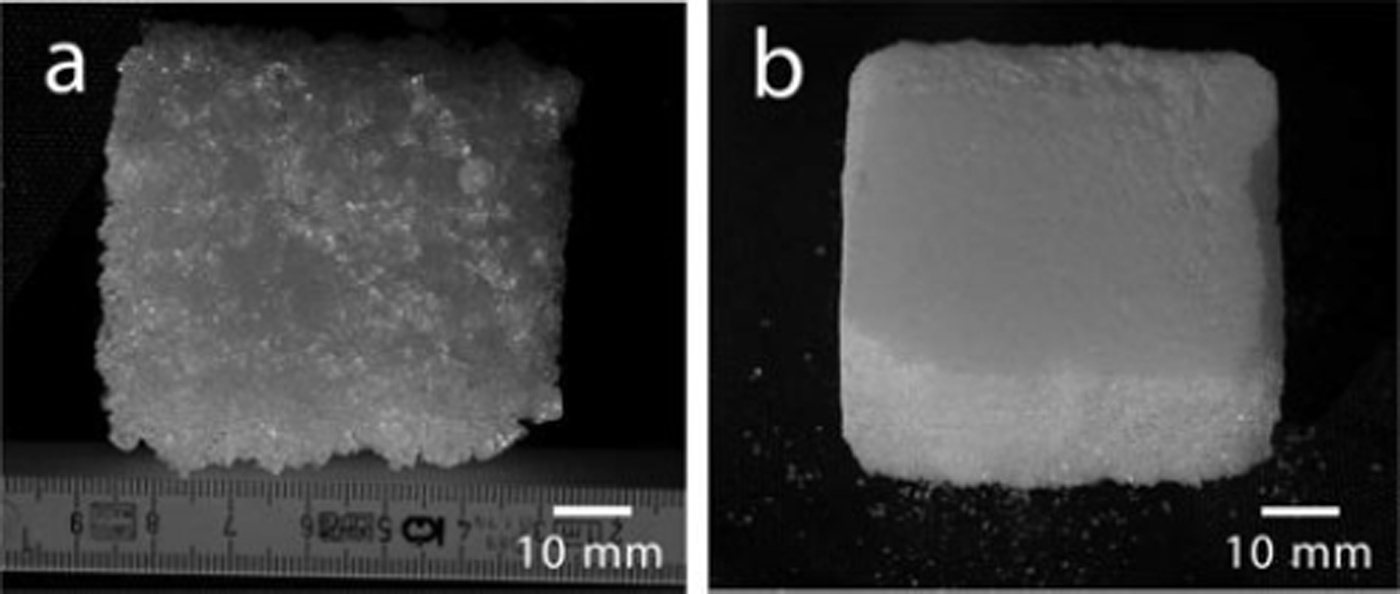
Fig. 4. Photographs of snow samples used for the density measurement: (a) depth hoar and (b) very hard compacted snow.
The vertical profiles show that the permittivity is correlated with the density. The high-density compacted snow layers coincide with the permittivity peaks, as observed for 0.4 m in Figure 3a. The difference between the measurements obtained when the snow fork is horizontally positioned and those obtained when it is vertically positioned is not clear. Discrepancies between the two methods are observed at the sharp peaks for the high-density layers, but the deviations are not consistent with each other. For example, at 0.4 m in Figure 3b the permittivity is greater when the resonator is horizontally positioned, whereas at 0.35 m in Figure 3d it is greater when the resonator is vertically positioned.
Figure 5 shows the permittivity measurements at the 35 sites; for clarity, only the results from the horizontal positioning of the resonator are shown. The permittivity varies within the range 1.361–2.001, with a total mean of 1.644 and a standard deviation σ = 0.102. The mean value at each sampling site ranges from 1.567 to 1.781, with σ = 0.058.
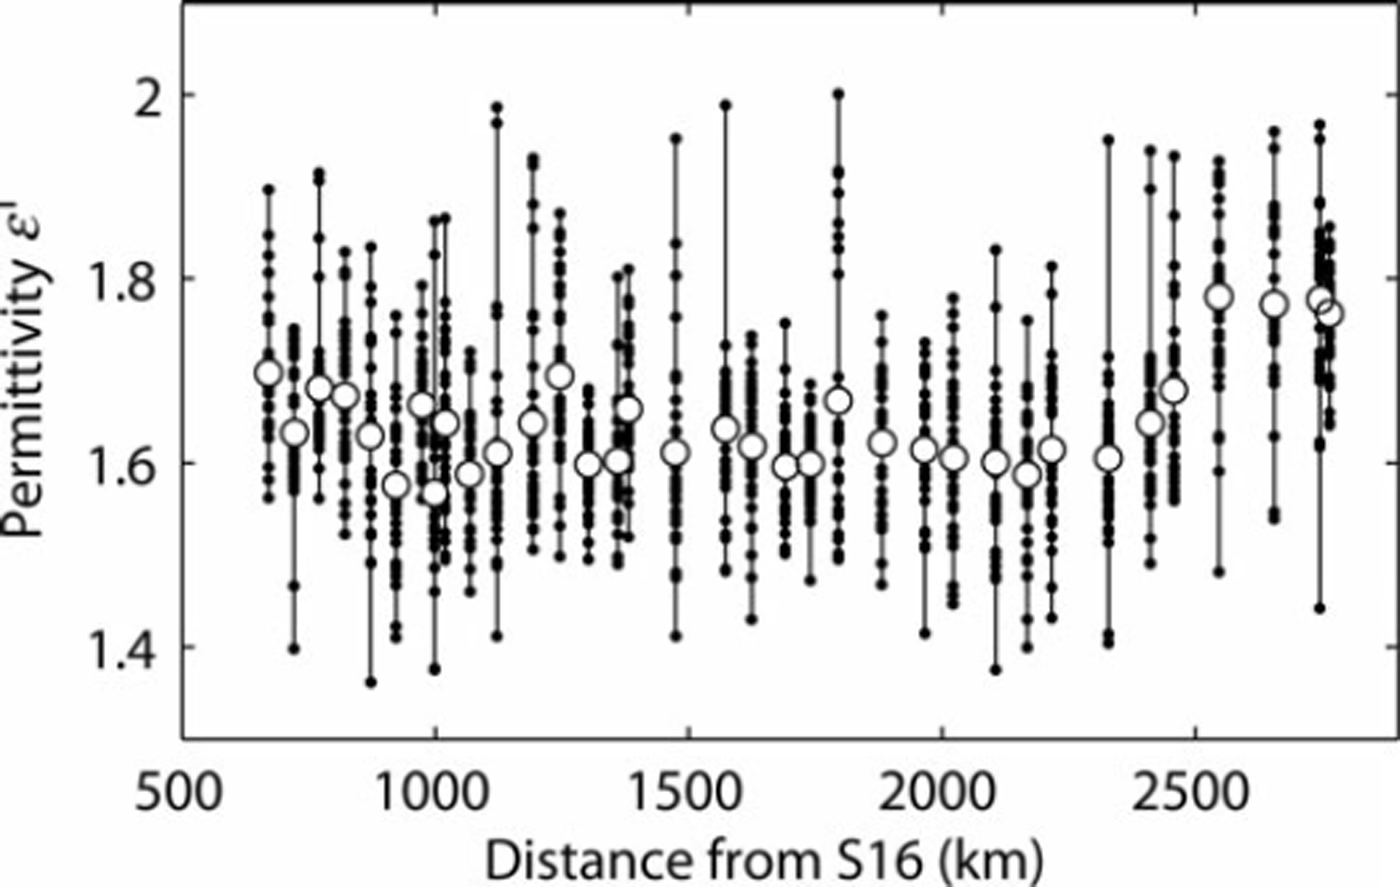
Fig. 5. Permittivity measured along the expedition route. The permittivity was measured with the resonator positioned horizontally. The individual measurements and the mean value for each site are denoted by (•) and (o), respectively.
The correlation of the permittivity ε′ with the density ρ (kgm−3) measured at the same depth was investigated using all the data obtained in this study (Fig. 6). Least-squares linear regression gives the coefficients of the relationship

Fig. 6. Plots of all the data on the permittivity vs snow density: the permittivity was measured when the resonator was positioned horizontally (+) and vertically (o). The lines correspond to the linear regression of the two datasets (solid and bold grey lines) and the equation proposed by Reference Tiuri, Sihvola, Nyfors and HallikainenTiuri and others (1984) (dashed line). The error bars indicate ±1.5% and ±4% errors expected in the permittivity and density measurements, respectively.
as a = 0.00178 kg−1 m3 (95% confidence interval (0.00169, 0.00186)) and b = 0.997 (0.965, 1.029) with correlation coefficient r = 0.76 for the horizontal resonator setting, and a = 0.00176 (0.00168, 0.00184) and b =1.010 (0.979, 1.040) with r = 0.77 for the vertical setting. Reference Tiuri, Sihvola, Nyfors and HallikainenTiuri and others (1984) proposed an empirical relationship with a = 0.002 and b = 1. This equation is plotted in Figure 6 for comparison, as it is based on the measurements of various types of snow. Our relationships give a smaller permittivity than Tiuri’s equation, and the discrepancy is 0.04–0.1 (3–5%) in the density range 200–500kgm−3.
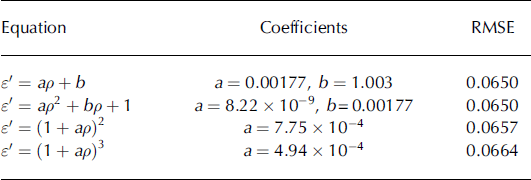
Regression was also performed for non-linear equations used in previous studies (Table 2). Fitting a second-order polynomial to the data (e.g. Reference DenothDenoth, 1989) gives a relationship very similar to the linear regression, and the error increases in the cases of refraction-type (e.g. Reference Kovacs, Gow and MoreyKovacs and others, 1995) and Looyenga-type equations (Reference Glen and ParenGlen and Paren, 1975).
Table 2. Least-squares regression coefficients and root-mean-square errors (RMSE) determined for the permittivity measured with the resonator positioned horizontally and vertically
4. Discussion
The permittivity of snow measured in this study was correlated with the density, and the relationship ε′ could be approximated by a linear function, as reported in previous studies. The regression lines are essentially identical when the resonator is horizontally and vertically positioned. Thus, we conclude that there is no influence of the measurement method on the relationship between ε′ and ρ when the number of measurements is sufficiently large. The measurement was dependent on the resonator position in the vicinity of the high-density layers. This was probably because the permittivity is measured at an exact depth by the horizontally positioned resonator, whereas the mean of an 18 mm thick layer is measured in the vertical position.
In an interesting observation, the ε′ values along the expedition route were smaller than those reported previously for the same density. Previously obtained relationships for dry snow are summarized in Table 3. Except for that obtained by Reference Shiraiwa, Shoji, Saito, Yokoyama and WatanabeShiraiwa and others (1996) for dry compacted snow in Japan, the ε′ given by these equations is greater than that given by the relationship determined by this study.
Table 3. Empirical relationships between permittivity ε′ and density ρ (kgm 3) proposed for dry snow. The relationship in this study was obtained for the permittivity measured with the resonator positioned horizontally and vertically

The permittivity of dry snow is virtually independent of the microwave frequency in a range that extends up to at least 10 GHz (e.g. Reference MätzlerMätzler, 1996). The temperature dependence of ε′ for polycrystalline ice is very small (5 × 10⁻⁴˚C−1; e.g. Reference Fujita, Shiraishi, Mae, Maeno and HondohFujita and others, 1992), and the influence of a quasi-liquid layer occurring at the snow particle surface at temperatures above –10˚C (Reference PetrenkoPetrenko, 1994) is negligible under the temperature conditions in this study. The effect of dielectric anisotropy of ice crystals (e.g. Reference Matsuoka, Fujita, Morishima and MaeMatsuoka and others, 1997) under the consideration of dielectric mixture theory (e.g. Reference Polder and van SantenPolder and Van Santen, 1946) is <1%. Thus, it is likely that ε′ was dependent on the volume fraction of ice and the snow structure. The structural dependence of ε′ has been discussed in many studies (e.g. Reference ColbeckColbeck, 1982; Reference DenothDenoth, 1982; Reference Sihvola, Nyfors and TiuriSihvola and others, 1985; Reference Kovacs, Gow and MoreyKovacs and others, 1995), but little observational evidence has been reported thus far. The structural dependence is hard to prove, as accurate measurements of ε′ and ρ in the field are difficult to obtain, and expected difference in ε′ is small. Moreover, it is hard to acquire sufficient data for different types of snow structures. By using the large number of data obtained for relatively simple snow structures, we discuss the possible influence of snow structure on the relationship between ε′ and ρ
Dry snow can be regarded as a dielectric mixture of ice and air. Applying multiphase dielectric mixture theory, Reference Tinga, Voss and BlosseyTinga and others (1973) derived the permittivity of a two-phase mixture with spherical inclusions as follows:

where ε 1 and ε 2 are the permittivity of the host and guest (spherical inclusions) materials, respectively, and V 2/V 1 is the volume fraction of the two materials. By assuming the permittivity of ice to be 3.15 (e.g. Reference CummingCumming, 1952; Reference KohKoh, 1992; Reference Fujita, Matsuoka, Ishida, Matsuoka, Mae and HondohFujita and others, 2000), Equation (3) gives the relationships between ε′ and ρ for two extreme cases: spherical ice particles surrounded by air and ice containing spherical air bubbles (dashed and solid lines in Fig. 7a). A linear correlation is expected when ice plates are aligned along an electric field (dash-dotted line in Fig. 7a). The bubbly ice has a greater ε′ than the spherical ice particles (Δε′ = 0.136 at ρ = 400kg m−3) and the majority of our data points lie between the two lines that show these relationships (Fig. 7b). The two structures can be distinguished by the bonding of ice particles. The mixture theory suggests that ε′ is larger when the bonding between the snow grains is greater. In our study, the dominant snow structure was the depth hoar, which is characterized by weak bonding of the grains. Therefore, the smaller ε′ obtained in our study is possibly due to the snow structure that is characteristic of interior Antarctica. This hypothesis can be understood by considering an analogy with a sintered material. The highly compressed powder has a lower permittivity than the material obtained after a sintering process (Reference Polder and van SantenPolder and Van Santen, 1946).

Fig. 7. (a) Plots of the permittivity vs snow density: the dashed, solid and dash-dotted lines represent the relationship given by Equation (3) for the snow structures illustrated by the insets, where ice and air are indicated by grey and white, respectively. The permittivity was measured with the resonator positioned horizontally. (b) Same plot as (a) for the region indicated by the grey box. The contour lines show the data-point density.
Among the data obtained when the resonator was horizontally positioned, those measured in the depth hoar and in the firmly compacted snow are plotted in Figure 8. The linear regression of the two datasets shows that the ε′(ρ) obtained for depth hoar is smaller than that obtained for compacted snow for the same density. The common regression performed for all data (model 1) was compared with the regression performed separately for depth hoar and compacted snow (model 2); the comparison was made by using the F test, a standard statistical method (Reference WeisbergWeisberg, 1985). F test of model 1 against model 2 gave a significance level much lower than 0.01, which supports the effectiveness of model 2. The compacted snow layer was very hard, indicating that the grains were tightly bonded. Thus, the regression of the two different snow structures agrees with the hypothesis that the smaller ε′ obtained in this study was due to the weak bonding of depth hoar.

Fig. 8. Plots of the permittivity measured in depth hoar (o) and compacted snow (•) vs snow density. The lines correspond to the linear regression of the two datasets (grey bold and solid lines) and the equation proposed by Reference Tiuri, Sihvola, Nyfors and HallikainenTiuri and others (1984) (dash-dotted line). The permittivity was measured with the resonator positioned horizontally.
Our data also imply structural anisotropy of the snow. Polar firn tends to have weaker grain bonding in the horizontal direction than in the vertical, i.e. the grains are elongated in the vertical direction, as a result of crystal growth in the extremely low-temperature condition. In such structures, the permittivity is expected to be greatest when the electric field is in the vertical direction. Dielectric anisotropy reported for firn in Greenland (Reference Lytle and JezekLytle and Jezek, 1994) and in Antarctica (Reference Fujita, Okuyama, Hori and HondohFujita and others, 2009) is consistent with this assumption. Since the snow-fork measurements in this study used the electric field directed parallel to the horizon, our data imply that the bonding of snow grains in the horizontal direction is very weak in the inland of Antarctica.
5. Conclusion
The real part of the complex permittivity ε′ was measured for the upper 1 m snow layer along the route traversed in the JASE 2007/08. The result was compared with the snow density ρ to find a relationship between ε′ and ρ. The relationship was determined as ε′ = 0.00177 ρ + 1.003 on the basis of more than 2000 data points obtained for 35 locations. This result is independent of the horizontal and vertical positions of a parallel-wire resonator of the measurement device. The values of ε′ given by this equation are 3–5% smaller than those reported previously in the density range 200–500 kg m−3. The smaller permittivity suggests the effect of snow structure on the dielectric properties. A majority of the measurements were made in the depth hoar that is characterized by the weak bonding of snow grains. According to the dielectric mixture theory, the permittivity of such structures is smaller than that of snow consisting of tightly bonded grains.
Acknowledgements
We thank the members of the JASE 2007/08 for their help in the field. The field activity was a part of the 48th and 49th Japanese Antarctic Research Expedition and supported by the National Institute of Polar Research, Tokyo, and the Swedish Polar Research Secretariat. The snow fork was kindly loaned by K. Fujita of Nagoya University. The surface elevation data used for the map were provided by the US National Snow and Ice Data Center. We thank two anonymous referees for providing careful reviews, and the scientific editor A.M. Smith for handling the paper. This study was funded by the Japanese Ministry of Education, Science, Sports and Culture, Grant-in-Aid for Scientific Research (A), 20241007, 2008–2010.


