Introduction
Large amounts of volcanic ash and gases are emitted to the upper troposphere and stratosphere during explosive volcanic eruptions. The volcanic gases are converted into aerosols of sulfuric acid, and these acidic components mix with fine ash and are globally distributed. They eventually fall to the Earth’s surface through complex physico-chemical processes. Ice cores drilled from the polar ice sheets can provide key information about the mechanism of global circulation of these volcanic products. They also provide a detailed record of local and distal volcanic eruptions as acidity peaks due to high concentrations of H2SO4, HCl and HF (e.g. Reference Hammer, Clausen and DansgaardHammer and others, 1980) and/or as visible ash layers. The ash layers have been found in ice cores from Byrd (Reference Gow and WilliamsonGow and Williamson, 1971; Reference Kyle and JezekKyle and Jezek, 1978; Reference Kyle, Jezek, Mosley-Thompson and ThompsonKyle and others, 1981; Reference PalaisPalais, 1985), Dome C (Reference Kyle, Jezek, Mosley-Thompson and ThompsonKyle and others, 1981) and Vostok (Reference Kyle, Palais and ThomasKyle and others, 1984; Reference Palais, Mosley-Thompson and ThomasPalais and others, 1987, Reference Palais, Kirchner and Delmas1989a, Reference Palais, Petit, Lorius and Korotkevichb, Reference Palais, Kirchner and Delmas1990; Reference Basile, Petit, Touron, Grousset and BarkovBasile and others, 2001) in Antarctica.
Chemical composition of the tephra in those cores has been used to estimate their source volcanic regions or, in some cases, source volcanoes (e.g. Reference Cole-Dai, Mosley-Thompson and ThompsonCole-Dai and others, 1997). Genetic information on the tephras can play a role in (1) constructing the past history of explosive volcanic eruptions, (2) providing key beds for correlating not only Antarctic ice cores but also sea sediment cores around Antarctica, and possibly dating these cores, and (3) clarifying the relation between the past volcanism and climate change.
Twenty-six ash layers were found in a 2503 m deep ice core from Dome Fuji station (77˚19'01" S, 39˚42'12" E; 3810 ma.s.l.; Reference FujiiFujii and others, 1999; Fig. 1), which was obtained by the 36th to 37th Japanese Antarctic Research Expeditions in 1995 and 1996, located at the summit of the inland plateau in Dronning Maud Land, East Antarctica (Dome-F Deep Coring Group, 1998). In order to investigate the source regions of the tephra found in the ash layers, the abundances of major and, in one case, trace elements for the tephra particles were measured by means of electron-probe microanalyzer (EPMA) and laser-ablation inductively coupled plasma mass spectrometer (LA-ICP-MS), respectively.
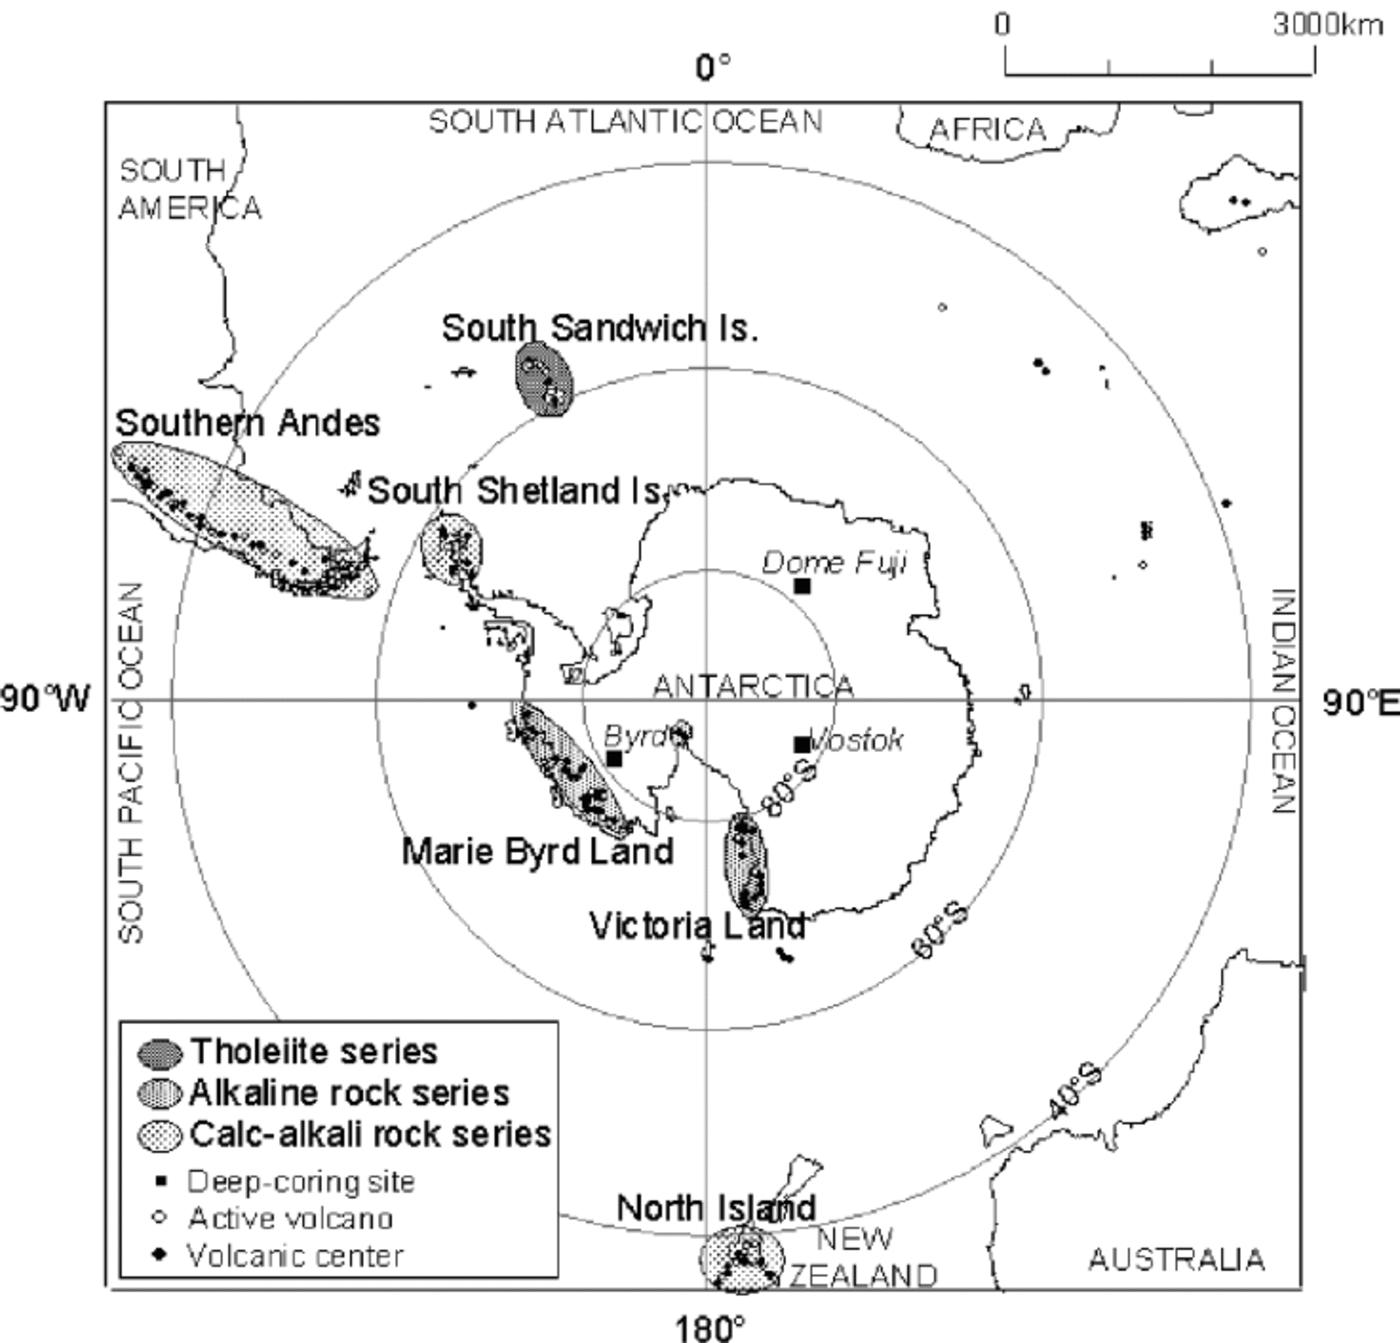
Fig. 1. Location of Dome Fuji and other deep ice-coring sites in Antarctica. The late Cenozoic volcanoes and active volcanoes are indicated by solid and open circles, respectively. Shaded areas are labeled by dominant rock series.
The chemical and isotopic composition of volcanic ash found in an ice core from Vostok was reported in Reference Basile, Petit, Touron, Grousset and BarkovBasile and others (2001). They determined the origin of fourteen ash layers as follows: nine from the South Sandwich Islands, Southern Ocean, three from southern South America, one from the Antarctic Peninsula and one from Marie Byrd Land, Antarctica. In order to correlate between the Dome Fuji and Vostok cores, Reference FujiiFujii and others (1999) compared the positions of all of the respective tephra layers on profiles of isotopic ratios: δ18O of the Dome Fuji core and δD of the Vostok core (Fig. 2), which are linearly related with a slope close to eight (Reference Vimeux, Cuffey and JouzelVimeux and others, 2002). They found that eight layers were correlated as the following depths of Dome Fuji and Vostok ash layers, respectively: 505–369 m, 1128 or 1129 m to 988 m, 1361–1280 m, 1568–1508 m, 1849 or 1852 m to 1991 or 1995 m, 2026–2325 m, 2117–2501 m and 2170– 2586 m. Hence, we have verified that tephra layers are coeval based on the chemical abundances of their tephras found in the two cores.
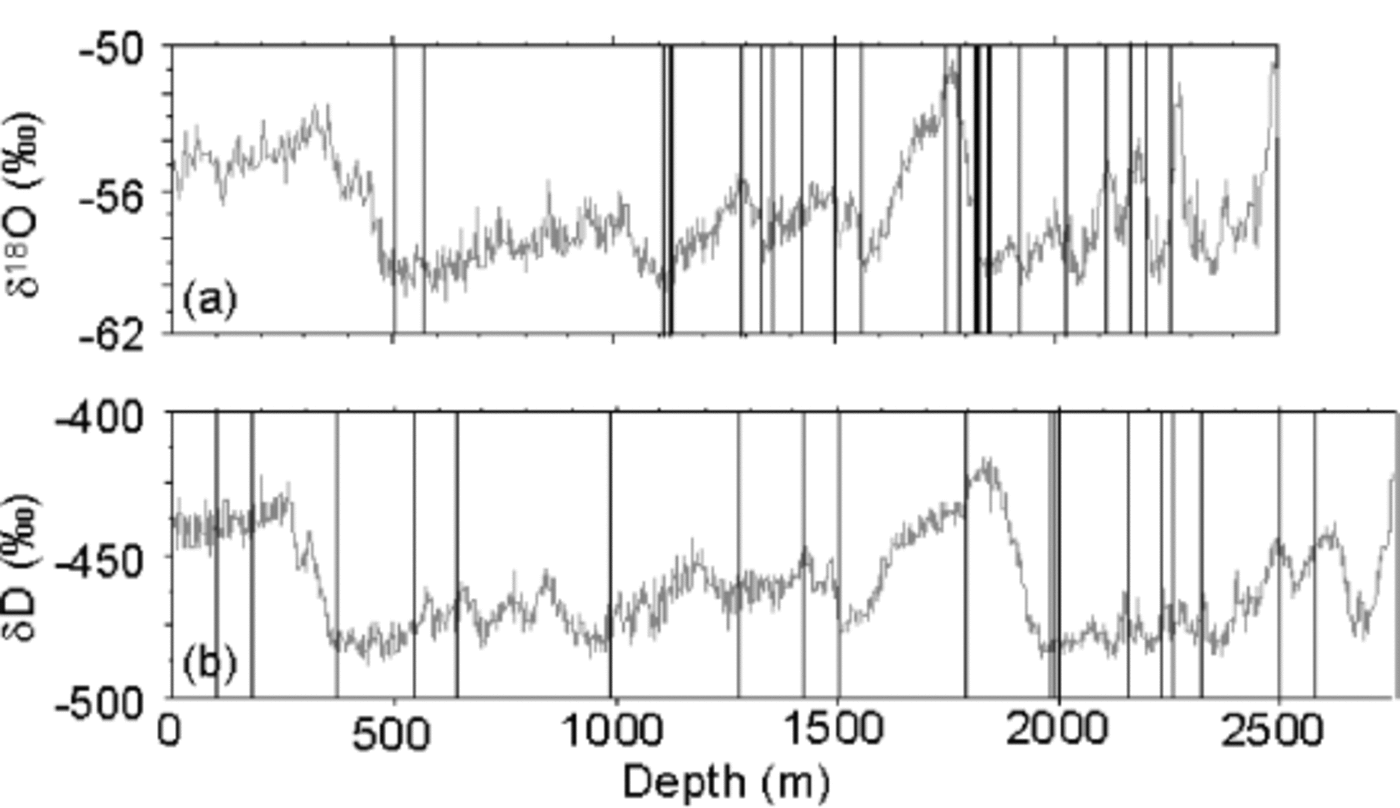
Fig. 2. Correlation of tephra layers found in both Dome Fuji (a) and Vostok (b) ice cores, based on δ18O and δD profiles, respectively (Reference FujiiFujii and others, 1999). a mean chemical composition of groundmass without microphenocrysts. The intensity of sodium Kα X-rays decreased by about 25% during the first 10 s when the beam diameter was set at 5 μm. Therefore, counting time for sodium was reduced by 2 s in order to minimize loss of the sodium Kα X-ray. To obtain the mean composition of a single tephra particle, one to three points were analyzed.
Samples
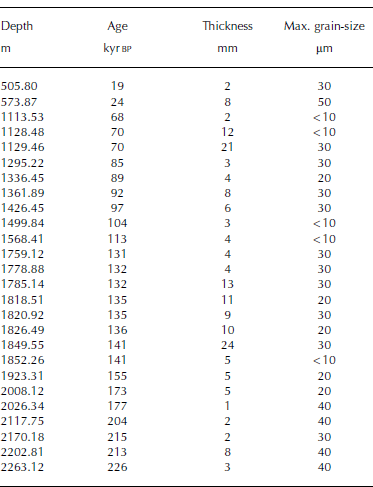
The 26 ash layers found in the Dome Fuji core have distinct boundaries and are light gray to yellow in color (Reference FujiiFujii and others, 1999; Table 1). The ages of the ice containing the ash layers were determined based on the relation between the annual-layer thickness and δ18O values, combined with a simple steady-state ice-flow model (Reference Dansgaard and JohnsenDansgaard and Johnsen, 1969) by Reference WatanabeWatanabe and others (2003). The tephra-containing layers were 1–24mm thick, suggesting that the duration of ash fallout ranges from a few months to 5 years on the basis of the preceding model. The long duration of the tephra fallout implies that the fine tephras were intermittently ejected from the source to the upper troposphere and/or stratosphere and suspended there for long periods.
Table 1 Ash layers found in Dome Fuji ice core
Analytical Procedure
Sample preparation
A small piece of ice (10–100 mg) was collected from the ash layer with a small stainless-steel chisel. The ice was placed on a thin quartz-glass on a hot plate and evaporated to dryness at 50˚C. All these procedures were carried out in a clean bench in a low-temperature room at –20˚C.
The ash on the glass was covered with a drop of Petropoxy Resin #154 (Palouse Petro Products), which was then allowed to solidify on the hot plate at a temperature of ~150˚C for 3 hours in a clean bench in a class 10 000 clean room. The resin containing the ash was polished until the tephra section was exposed.
The surface of the resin section was coated with carbon to make it conducting. Grain texture and size were investigated using a scanning electron microprobe (SEM; JSM-5200, JEOL) in order to determine analytical points in the tephra grains.
Major-elements analysis
Analysis of major-element oxides (SiO2, TiO2, Al2O3, FeO, MnO, MgO, CaO, N2O and K2O) in glassy parts of the tephra samples was carried out using a wavelength-dispersive EPMA (JXA-8800, Japanese Electron Optics Limited) equipped with five detectors at the National Institute of Polar Research, Tokyo, Japan, using the ZAF correction method (Reference Duncumb and ReedDuncumb and Reed, 1968). The glass was analyzed with an accelerating voltage of 15 keV and an electron-beam current of 12 nA. The electron-beam diameter was set at >5 μm in order to minimize migration of sodium and potassium during the analyses of aphyric groundmass. Devitrified tephra was, however, analyzed with a broader electron beam (10–20 μm), in order to obtain
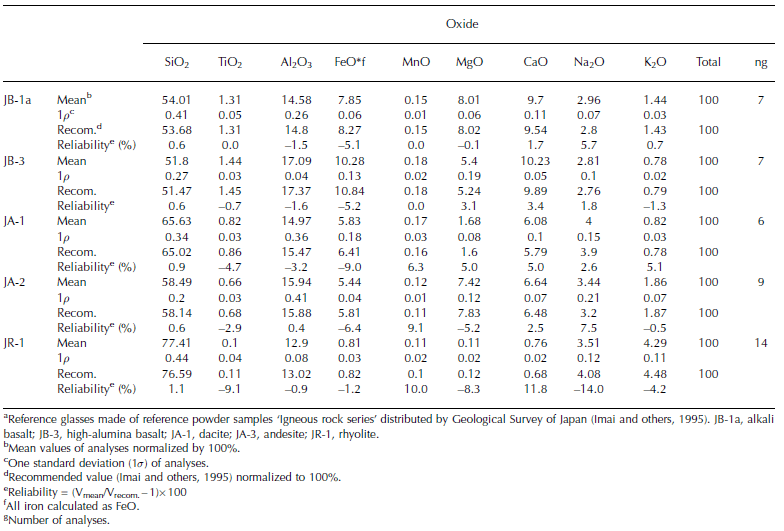
Uncertainties of the measurements were tested by duplicate analysis of reference glasses under the same analytical conditions, but only for a beam diameter of 5 μm. The reference glasses were made of powder samples of natural igneous rock whose compositions had been precisely determined (Reference Imai, Terashima, Ito and AndoImai and others, 1995). Rock types of the powder samples ‘Igneous rock series’ provided by the Geological Survey of Japan were alkaline basalt (JB-1), high-alumina basalt (JB-3), dacite (JA-1), andesite (JA-3) and rhyolite (JR-1). Table 2 summarizes the reliability and precision (1 standard deviation (1σ)) of our electron microprobe analyses and recommended values of the powder rock samples (Reference Imai, Terashima, Ito and AndoImai and others, 1995). Differences in resulting abundance data between reported data and present data were within ±5% for JB-1 and JB-3, ±9% for JA-1 and JA-3, and ±10% for JR-1, except for Na2O of JR-1 (–14%).
Table 2 Test analyses of major element abundances (wt.%) of reference glassesa using EPMA
Trace-elements analysis
Abundances of 14 trace elements (rare-earth elements (REEs): La, Ce, Pr, Nd, Sm, Eu, Gd, Tb, Dy, Ho, Er, Tm, Yb and Lu) were measured by an ICP-MS (VG PlasmaQuad 2 Omega, ThermoElectron) equipped with an ArF Excimer laser ablation system (GeoLAS 200CQ, MicroLas) at Tokyo Institute of Technology. The advantages of using the laser ICP-MS system, compared with a solution nebulization system, are that (1) it can analyze solid tephra samples without prior digestion, (2) it requires a smaller amount of sample and (3) it can analyze a single tephra particle.
Helium gas, instead of Ar, was flushed into the sample cell in order to increase sample transport efficiency and reduce deposition of sample around the ablation pit (Reference Eggins, Kinsley and ShelleyEggins and others, 1998). Instrumental sensitivities thus achieved were >2000 Hz μg g–1 for Pb and U on NIST glass standard reference material 610 (NIST SRM 610 provided by US National Institute of Standards Technology) from a pit diameter of 16 μm ablated at 5 Hz repetition rate with an output pulse energy of 140 mJ (Reference HirataHirata, 2003). The spatial resolution (6.4 μm) achieved by the current LA-ICP-MS system was high enough to measure 14 trace elements in a single tephra grain. For precise and reliable abundance data, however, it was important to prepare homogeneous and matrix-matched standard reference materials. In this study, the NIST SRM 610 was used as a calibration standard, because the homogeneity of the NIST SRM 610 was well established through rigorous testing by many research groups over an extended period (Reference PearcePearce and others, 1996). The matrix of the NIST SRM 610 is 72% SiO2, 12% CaO, 14% Na2O and 2% Al2O3.
aReference glasses made of reference powder samples ‘Igneous rock series’ distributed by Geological Survey of Japan (Reference Imai, Terashima, Ito and AndoImai and others, 1995). JB-1a, alkali
basalt; JB-3, high-alumina basalt; JA-1, dacite; JA-3, andesite; JR-1, rhyolite.
bMean values of analyses normalized by 100%.
cOne standard deviation (1σ) of analyses.
dRecommended value (Reference Imai, Terashima, Ito and AndoImai and others, 1995) normalized to 100%.
eReliability = (Vmean/Vrecom.–1)×100
fAll iron calculated as FeO.
gNumber of analyses.
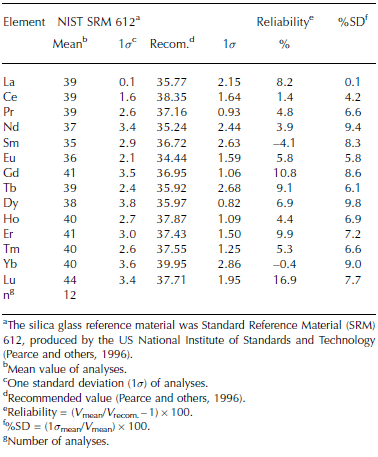
The reliability and precision of our LA-ICP-MS analyses were tested by analyzing the trace-element abundances in NIST SRM 612 (similar in major composition to the SRM 610; abundances of trace elements are almost one-tenth the level of the NIST SRM 610). The abundance values for trace elements reported by Reference PearcePearce and others (1996) are also summarized in Table 3. Differences in resultant abundance data between reported data and data of the present study were within ±10%, except for Lu (±17%). This level of precision of the measurement is enough to distinguish the difference in chemical composition of trace elements in tephras having different sources.
Table 3 Test analyses of trace-element abundances (ppm) of a reference glass using LA-ICPMS
Resultant REE abundances were normalized to those of chondrites having the composition of the Earth’s primitive mantle. Thereby, the fractionation of REE abundances through various geochemical processes can be recognized, because the terrestrial REE abundances are characterized as follows: elements having even atomic numbers are more abundant than their immediate neighbors with odd atomic numbers (e.g. Reference Anders and EbiharaAnders and Ebihara, 1982).
Results and Discussion
Particle size and texture
Particles found in the ash layers were mainly groundmass glass fragments (glass shards), having angular edges and showing curved and smooth surfaces. Maximum sizes of tephras were < 50 μm as determined by SEM observation. Particles found in five layers at depths of 1113, 1128, 1499, 1568 and 1852 m were < 5 μm.
SEM observation revealed that the tephras found in layers at 573, 1426 and 1826 mwere strongly devitrified and poorly vesiculated. They are mostly composed of euhedral microphenocrysts and euhedral to subhedral microlites with a minor quantity of interstitial glasses. Part of the microlites and the glasses in them were analyzed with a broad beam at 10– 20 μm. Vitreous tephras were found at depths of 1336, 1361, 1785, 1818, 2008, 2202 and 2263 m. They were moderately vesiculated and some of them showed well-developed elongate vesicles. The tephras found in the other layers were composed of both devitrified and vitreous matrix glasses. These vitreous tephras were analyzed with a beam at 5 μm.
Tephras found in the 21 layers with particle sizes of a few tens of μm, except for the five layers at depths of 1113, 1128, 1499, 1568 and 1852 m, were derived from source volcanoes not very far from Dome Fuji, probably in the Antarctic region (Fig. 1). In sharp contrast, the tephra particles with sizes of < 5 μm collected from those five layers were likely transported over longer distances, from
aThe silica glass reference material was Standard Reference Material (SRM) 612, produced by the US National Institute of Standards and Technology (Reference PearcePearce and others, 1996).
bMean value of analyses.
cOne standard deviation (1σ) of analyses.
dRecommended value (Reference PearcePearce and others, 1996).
eReliability = (V mean/V recom.–1)×100.
f%SD = (1σ mean/V mean)×100.
gNumber of analyses.
volcanoes located in more distant regions of the lower latitudes (e.g. Reference Cole-Dai, Mosley-Thompson and ThompsonCole-Dai and others, 1997).
Major-element composition
Volcanic rocks are generally classified into two types based on the relation between total alkalis (Na2O+K2O) and silica (SiO2) contents, namely, the alkaline and non-alkaline rock series. The contents of total alkali and silica have been widely used for the chemical classification of igneous rocks (Reference Cox, Bell and PankhurstCox and others, 1979; Fig. 3). The non-alkaline rock series are further classified into two types of rock series based on the proportion of total iron (FeO+ Fe2O3), Na2O+K2O and MgO, namely, the calc-alkaline and tholeiitic rock series. Volcanic rocks obtained from the volcanoes in the Antarctic are classified into these three rock series as shown in Figure 1.
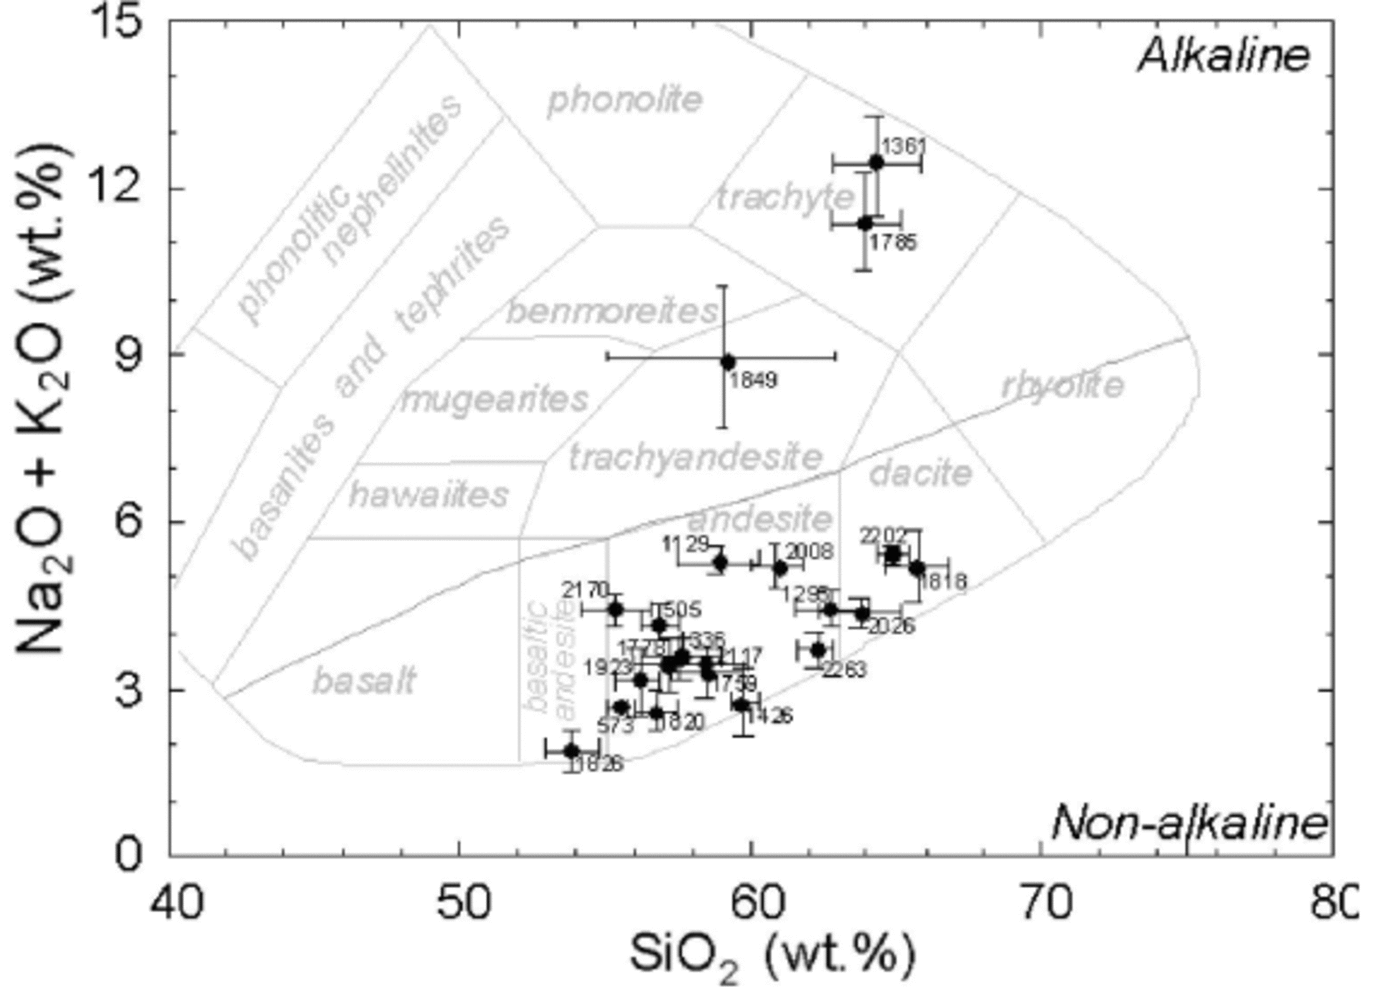
Fig. 3. Diagram of SiO2 vs total alkalis (Na2O+K2O) for analyzed tephras found in the Dome Fuji ice core. Error bars show one standard deviation (1σ) corresponding to variation of analyzed tephra samples. Dashed line indicates a boundary between alkaline and non-alkaline rock fields (Reference MiyashiroMiyashiro, 1978). Nomenclature is cited from Reference Cox, Bell and PankhurstCox and others (1979).
Major-element compositions of the tephras in the 21 layers, except for the 5 layers at depths of 1113, 1128, 1499, 1568 and 1852 m, were determined by the EPMA. The tephras from these 5 layers were smaller than 5 μm, so they could not be polished. The number of analyzed particles ranged from 5 to 27 for each sample. The resultant Na2O+K2O concentrations are plotted against SiO2 concentrations in Figure 3. These tephras were classified into the alkaline (trachyandesite to trachyte) and the non-alkaline (basaltic andesite to dacite) rock series. The tephras found at depths of 1361, 1785 and 1849 m corresponded to trachyandesite and trachyte, indicating that their source regions are Marie Byrd Land and/or Victoria Land, Antarctica (Fig. 1). The non-alkaline tephras were further classified into two groups, tholeiite and calc-alkaline rock series based on the proportion of FeO + Fe2O3, Na2O+K2O and MgO (Fig. 4). The tephras, except for 1129, 2008 and 2170 m tephras, plot within the tholeiite rock field (Reference Naraoka, Yanai and FujitaNaraoka and others, 1991), suggesting that most of the tephras found in the Dome Fuji core originate from the South Sandwich Islands. The other tephras from the three layers at 1129, 2008 and 2170 m were classified as calc-alkaline basaltic andesite to andesite (Fig. 3 and 4). Three source candidates for the volcanic regions which produced the calc-alkaline rock are shown in Figure 1: the South Shetland Islands, the southern part of the Andes, and the North Island of New Zealand. The tephras from the North Island of New Zealand, however, are much more silicic than those from the three layers, making it more likely that the tephras were transported from the South Shetland Islands and/or the southern part of the Andes.
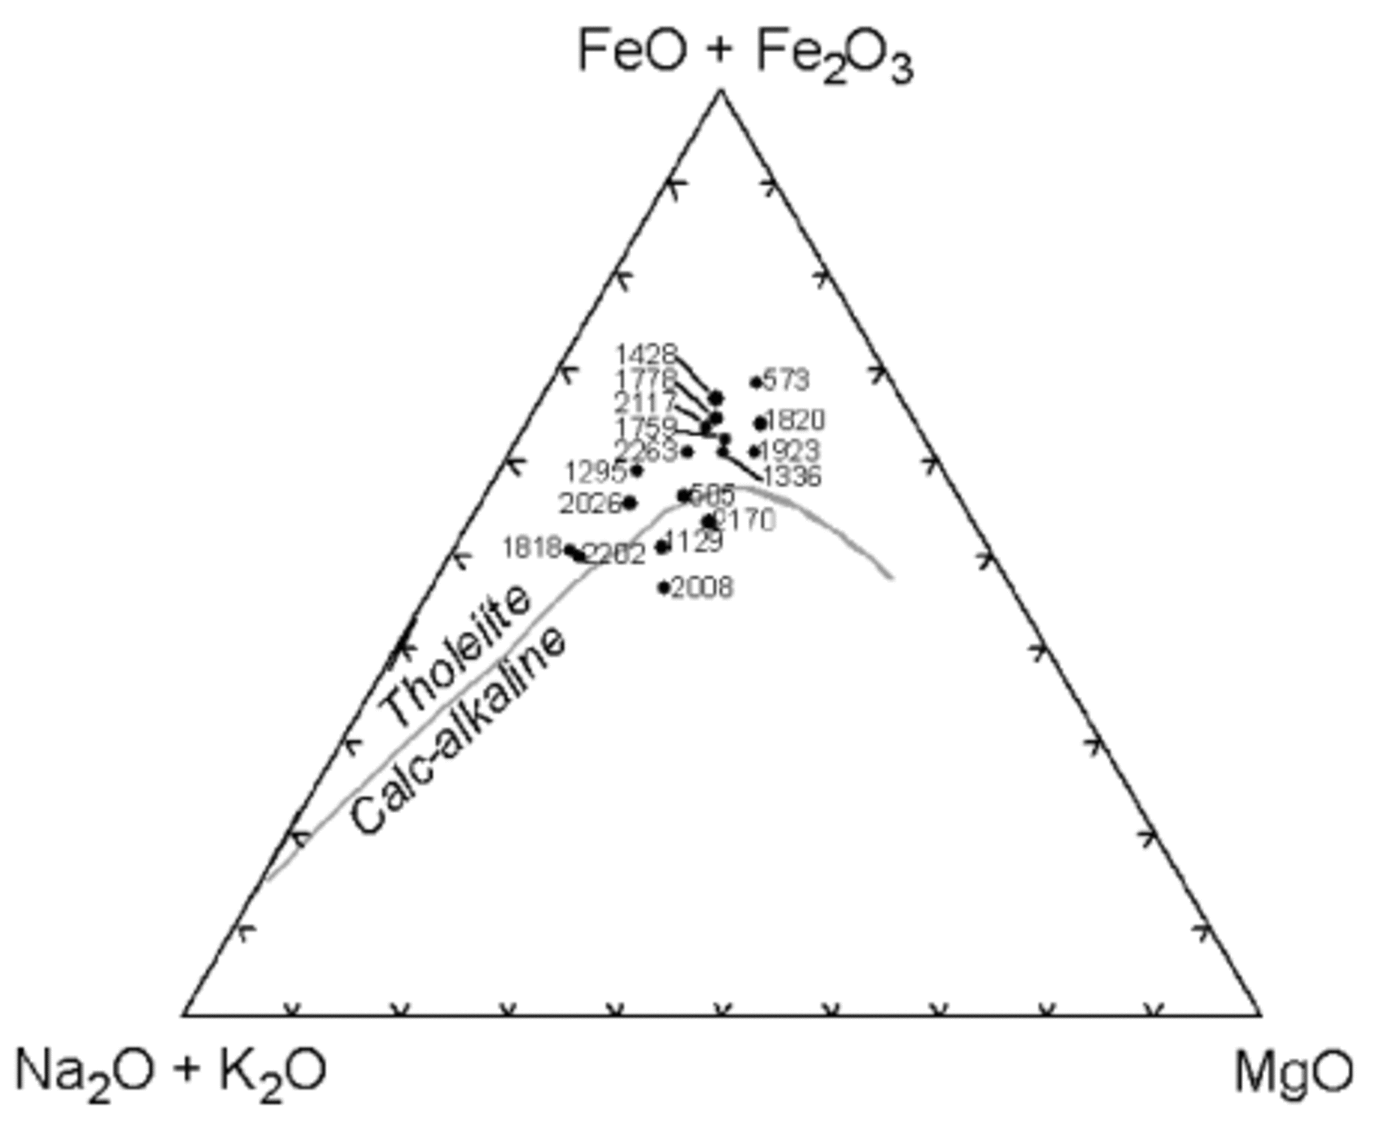
Fig. 4. Diagram of total alkalis (Na2O + K2O)–total iron–MgO for analyzed tephras in the Dome Fuji ice core. Dashed line indicates a boundary between tholeiite and calc-alkaline rock series (e.g. Reference KunoKuno, 1950).
The magnitude of 1σ for SiO2 and Na2O+K2O concentrations of the 1849 m tephra was much higher than that of the other tephras (Fig. 3). Representative variation diagrams of SiO2 vs Na2O+K2O, K2O, FeO and TiO2 for all analyzed tephras from the layer are shown in Figure 5. The data points define a single straight line, probably resulting from compositionally zoned magma following fractional crystallization (e.g. Reference Mandeville, Carey and SigurdssonMandeville and others, 1996).
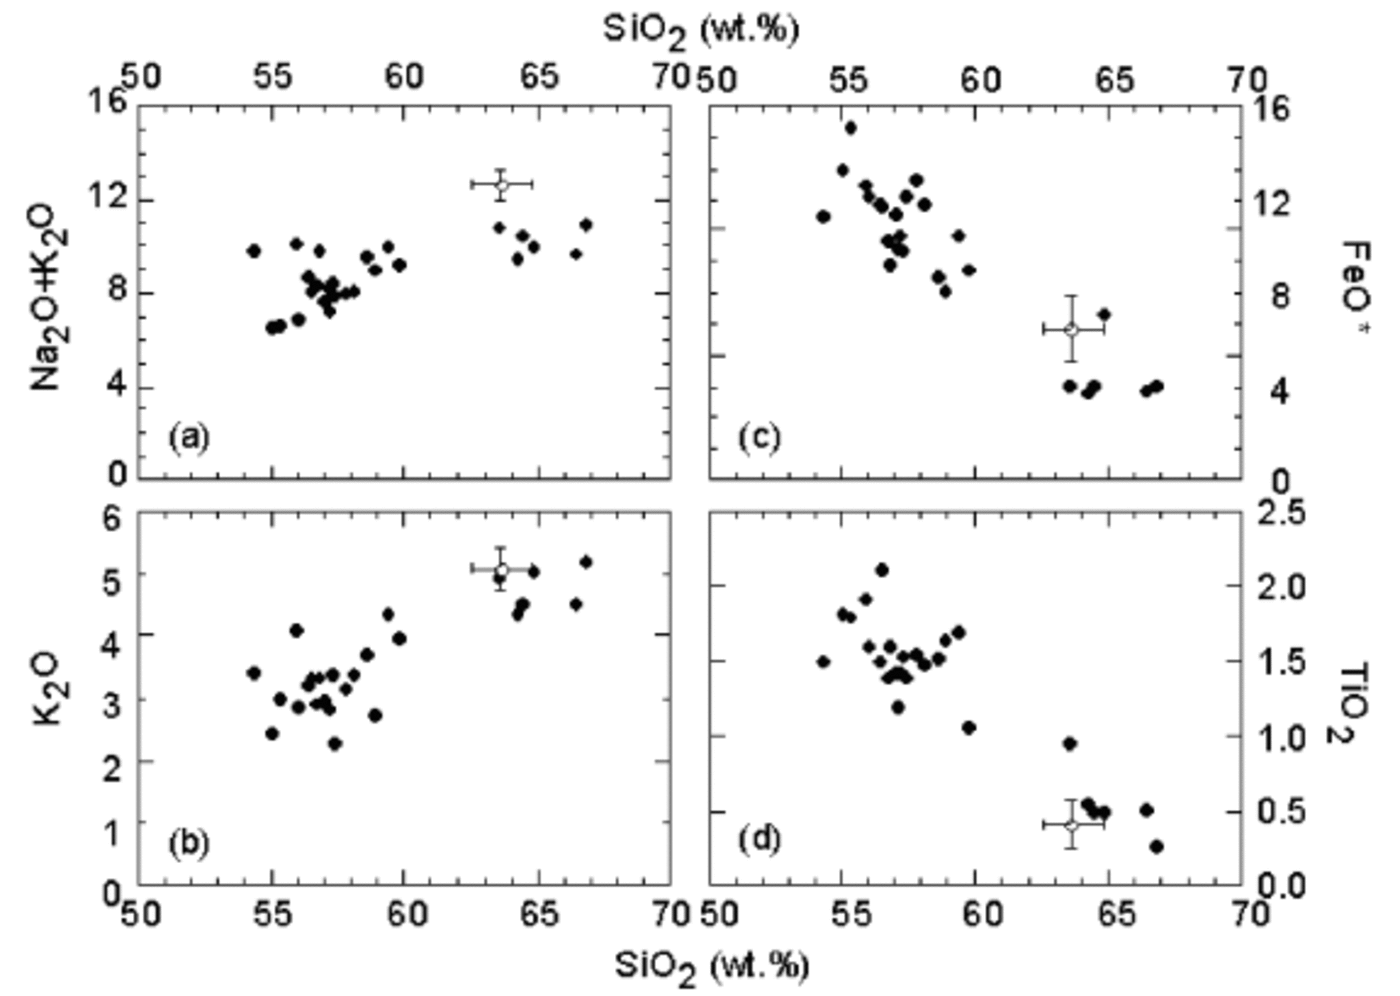
Fig. 5. Variation diagrams of SiO2 vs (a) total alkalis (Na2O + K2O), (b) K2O, (c) FeO and (d) TiO2. Solid and open circles indicate the 1849 m and 1995 m tephras found in Dome Fuji and Vostok ice cores, respectively. The abundances of the 1995 m tephra are a mean value (Reference Basile, Petit, Touron, Grousset and BarkovBasile and others, 2001), and the error bars are the same as in Figure 2.
Trace-element composition
REE abundances were measured to obtain geochemical and petrogenetic information. A chemical property of the trivalent REEs is that their ionic radii systematically vary with atomic numbers, whereas the electronic configurations of their outer electron orbits remain the same. Therefore, the REEs are identical, except for their ionic radii, with regard to partitioning between mineral and melt in magmas. Due to systematic differences in ionic radii (Reference McKayMcKay, 1989), the relative REE abundances would change sensitively through metamorphic events or mineralization processes, and the REE abundance data can be used for identification of source volcanoes (Reference Fukuoka, Arai and NishioFukuoka and others, 1987).
For the 1361 m tephra, which is considered to originate from Marie Byrd Land or Victoria Land based on the major-element abundances, the REE abundances were measured using the LA-ICP-MS technique. Only three particles were analyzed because the LA-ICP-MS analysis required large (>20 μm) and homogeneous samples. The REE abundances of the tephra and the volcanic rocks from the two source regions are shown in Figure 6 (Reference LeMasurier, Kyle and RankinLeMasurier and others, 1976; Reference Rocholl, Stein, Molzahn, Hart and WörnerRocholl and others, 1995). The REE variation pattern of the tephra plots within that of Marie Byrd Land, indicating that the 1361 mtephra originated from a volcano in Marie Byrd Land.
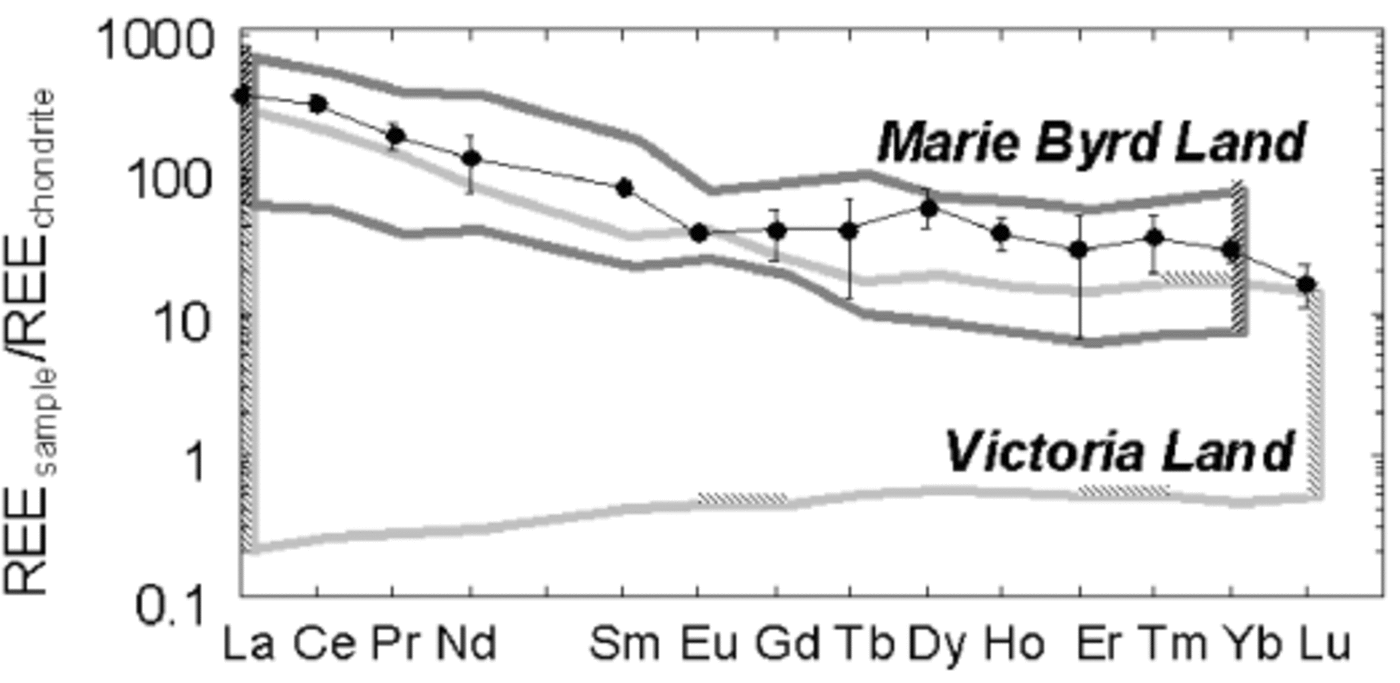
Fig. 6. Variation pattern of REEs of the 1361 m tephra. Fields enclosed by heavy and light broken lines indicate variation ranges of tephras from volcanoes in Marie Byrd Land and Victoria Land, respectively (Reference LeMasurier, Kyle and RankinLeMasurier and others, 1976; Reference Rocholl, Stein, Molzahn, Hart and WörnerRocholl and others, 1995). Error bars are the same as in Figure 2.
Comparison with Vostok tephras
We compared individual major-element abundances of the tephras found in the eight coeval tephra layers between the Dome Fuji and Vostok (Reference Palais, Petit, Lorius and KorotkevichPalais and others, 1989b; Reference Basile, Petit, Touron, Grousset and BarkovBasile and others, 2001) ice cores (Table 4). The major-element abundances of their tephras, except for the 1128, 1568 and 1852 m tephras which were not large enough to analyze, are listed in Table 4.
Table 4 Major-element analyses of glass shards (wt.%) obtained from common layers between the Dome Fuji and Vostok ice cores
The tephra found in the 1361 m deep layer of the Dome Fuji core was classified into the alkaline rock series. Two types of tephra found in a 1280m layer of the Vostok core were classified into the calc-alkaline and tholeiite rock series, indicating that the 1361 m layer of the Dome Fuji core was not coeval with the 1280 m layer of the Vostok core.
The tephra found in the 1849m layer in the Dome Fuji core corresponds to trachyandesite. The tephra found in the 1991 m deep layer of the Vostok core corresponds to basaltic andesite, suggesting that these two layers are not coeval.
We calculated the ‘similarity coefficients’ proposed by Reference Borchardt, Aruscavage and HamiltonBorchardt and others (1972), commonly used for correlating tephras (e.g. Reference Fiacco, Palais, Germani, Zielinski and MayewskiFiacco and others, 1993). This coefficient is expressed as a function of ratios between abundances of each element and relative dispersions. The coefficient is defined as 1 for perfectly identical tephras, and ‘similar’ tephras have >0.85 (Reference ZielinskiZielinski and others, 1995). The similarity coefficient of the compositions of the tephras at depths of 505–369 m, 1129–988 m, 2026–2325 m, 2117– 2501 m and 2170–2586 m ranged from 0.85 to 0.95, except for the tephras at depths of 1361–1280 m and 1849 m to 1991 or 1995 m.
The tephras found in the 1849 m layer of the Dome Fuji core and the 1996 m layer of the Vostok core were classified into the alkaline rock series (Fig. 2; Table 4), although the similarity coefficient (0.73) was much lower than 0.85. Thicknesses of these layers at 1849 m and 1996m are relatively great (24 and 20 mm, respectively). Figure 4 shows that the 1996 m tephra of the Vostok core plots close to the trend of the 1849 m tephra of the Dome Fuji core. This indicates that the 1849 m and 1996m tephras found in the Dome Fuji and Vostok cores, respectively, may be identical, whereas trachyandesitic tephras have not yet been found in the Vostok core.
Consequently, six tephra layers are common to the Dome Fuji and Vostok cores (505–369 m, 1129–988 m, 1849– 1995 m, 2026–2325 m, 2117–2501 m and 2170–2586 m). Each of these tephras may have covered most of the surface of the Antarctic ice sheet at one time. Therefore, these layers have a high potential for being the key correlation beds among deep ice cores from Antarctica.
Conclusions
Major-element abundances of tephras from 21 tephra layers found in the Dome Fuji core were measured using EPMA. In addition, REE abundance of one of these (1361 m) was measured using LA-ICP-MS. We hope that this method, which requires only small amounts of sample, will be a useful tool for correlating tephras preserved in ice cores.
aDepth of an ash layer found in the Vostok ice cores.
bMean values of analyses.
cOne standard deviation (1σ) of analyses.
dAll iron calculated as FeO.
eNumber of analyses.
fSources: 1. Reference Palais, Petit, Lorius and KorotkevichPalais and others (1989b); 2. Reference Basile, Petit, Touron, Grousset and BarkovBasile and others (2001).
Six ash layers were found to be common to the Dome Fuji and Vostok ice cores, on the basis of their abundances of major and trace elements. This indicates the possibility for correlating these particular tephras with those present in other Antarctic ice cores, and possibly in sea sediment cores around Antarctica.
Acknowledgements
We thank T. Iizuka and T. Ohno of the Tokyo Institute of Technology for supporting the LA-ICP-MS analyses, and dust research members of the Dome Fuji project for their help with observing tephra layers. We also acknowledge T. K. Hinkley of the US Geological Survey, and two reviewers, C. U. Hammer of the University of Copenhagen and J. M. Palais of the US National Science Foundation, for valuable comments.


