Introduction
Major explosive volcanic eruptions emit large amounts of gas (mainly SO2) and dust into the stratosphere; they may be an important cause of weather and temperature variations (Reference Hammer, Clausen and DansgaardHammer and others, 1980; Reference Robock and MassRobock and Mass, 1982; Reference LaMarche and HirschboeckLaMarche and Hirschboeck, 1984; Reference Robock and FreeRobock and Free, 1995; Reference Briffa, Jones, Schweingruber and OsbornBriffa and others, 1998). The main effect of the emission of dust into the stratosphere is its heating through the absorption of solar radiation (Reference Baldwin, Pollack, Summers, Toon, Sagan and CampBaldwin and others, 1976; Reference Hansen, Wang and LacisHansen and others, 1978), whereas sulphuric acid particles, coming from oxidation of SO2, scatter the sunlight and produce a cooling of the lower troposphere. Moreover, the sulphate aerosol absorbs longwave radiation, warming the stratosphere. In order to evaluate the volcanic load of the atmosphere in recent years, direct measurements were taken during the Pinatubo, El Chichon and Mount St. Helen eruptions (Reference RobockRobock, 1981; Reference KerrKerr, 1983; Reference Hansen, Lacis, Ruedy and SatoHansen and others, 1992), but for the old eruptions indirect evaluations can be made (Reference Robock and FreeRobock and Free, 1995). Due to the global distribution of volcanic sulphur dioxide, subsequently oxidised to sulphate, which can produce a strong acid signal in ice sheets, a promising ice-core-volcanic index has been suggested (Reference Legrand and DelmasLegrand and Delmas, 1987; Reference Robock and FreeRobock and Free, 1995) for evaluating the global impact of eruptions. The study of these volcanic spikes is important for evaluating the relationship between climate and volcanism. Moreover, volcanic markers are very useful for improving the dating accuracy of ice cores by multiple-parameter analyses.
This paper reports new chemical and isotope data on a firn core (0.5-42.2 m deep) collected at the Hercules Névé plateau (100 km inland and 2960 m a.s.l.), northern Victoria Land (Fig. 1), during the 1994-95 Italian Antarctic Expedition. The core extends back to AD 1770 and provides a record of δ18O data encompassing part of the so-called Little Ice Age (LIA). This "colder" period was reconstructed from Northern Hemisphere temperatures (Reference Groveman and LandsbergGroveman and Landsberg, 1979) and proxy records (Reference GroveGrove, 1988). Reference LambLamb (1977a) placed this episode between AD 1550 and 1850. From a series of proxy data of different origin, Reference Jones, Bradley, Bradley and JonesJones and Bradley (1992) argued that the LIAwas characterised not by a single long-lasting cold period but by a number of colder intervals. Moreover, the coldest periods do not coincide between different geographical regions, and the temporal distribution varies from one area to another. All these considerations on the temporal and spatial variability of this cold event suggest some caution in using the term LIA. The geographical and temporal distribution of this event in Antarctica is still unclear, and new proxy data are needed for a better understanding of its global extent.
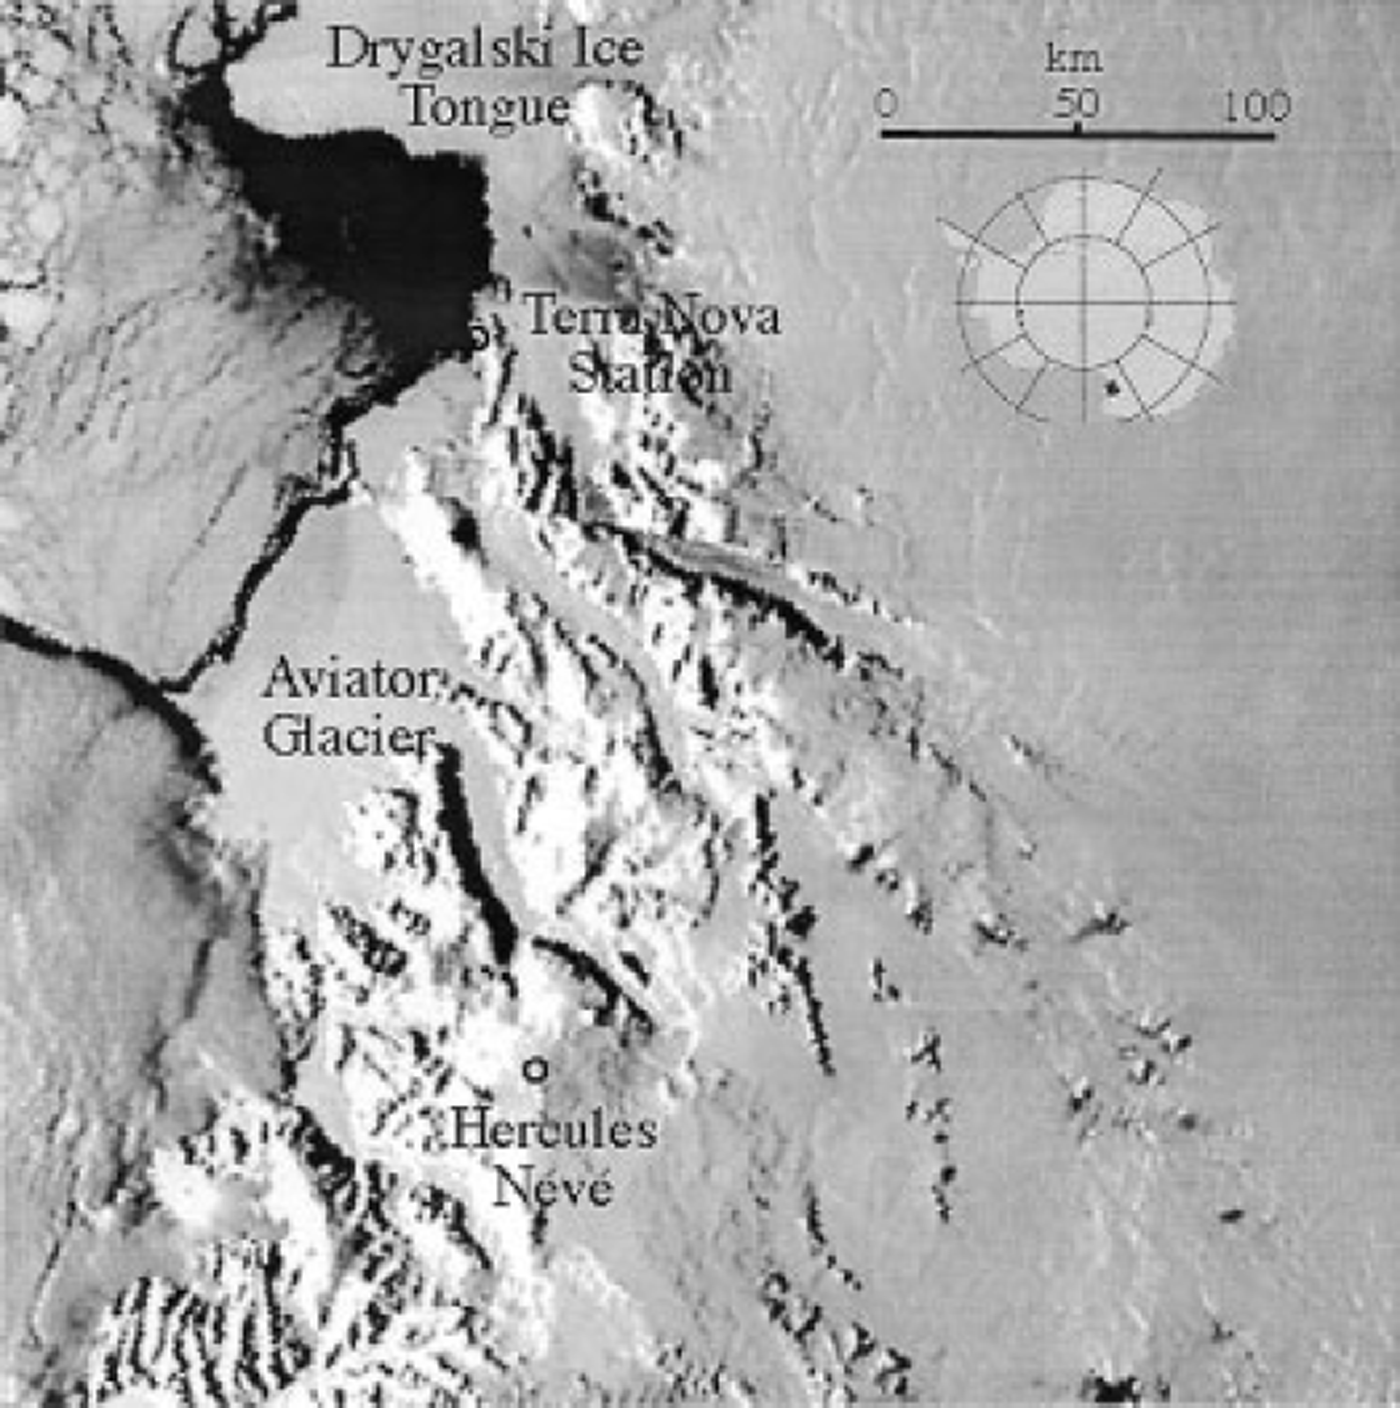
Fig. 1. Location of ice-core site at Hercules Névé, northern Victoria Land.
A comparison between δ180 average values and surface temperatures in Antarctica is possible only for the last decades of the 20th century; the ice-core records are therefore a valuable tool providing detailed information for periods not covered by instrumental weather observations. Furthermore, the study of the past natural variability of the environmental system has attracted fresh attention after the recent observations of anthropogenically induced climate change (Reference Houghton, Filho, Callander, Harris, Kattenberg and MaskellHoughton and others, 1996).
Sampling and Analyses
The core sections, after surface cleaning in a cold room, were subsampled every 3-4 cm. Samples were kept frozen and stored in pre-cleaned (with 18 Mil ultra-pure water) polyethylene containers. The samples were then melted in a clean room prior to chemical analysis. Chemical (GT, NOs-, SO4 2- and H2O2) and isotope (δ180) analyses were performed in order to evaluate the snow-accumulation rate at this site. Tritium measurements were performed in the upper part of the core, between about 4.5 and 11 m, in order to identify the 1965-66 tritium peak due to the 1961-62 thermonuclear atmospheric bomb test (Reference Jouzel, Merlivat, Pourchet and LoriusJouzel and others, 1979). The analytical procedures for the chemical, isotope and tritium measurements are described elsewhere (Reference Gragnani, Smiraglia, Stenni and TorciniGragnam and others, 1998; Reference MaggiMaggi and others, 1998).
Results and Discussion
During the early 1950s and 1960s thermonuclear atmospheric bomb tests emitted large amounts of artificial radionuclides into the Earth’s atmosphere (particularly during 1952-54 and 1961-62). The fallout of radionuclides following these periods produced marked concentration levels of artificial tritium that can be used in the firn as dating markers. Due to the delay between tritium emission and fallout, the 1961 62 tests produced the most important tritium peak at the South Pole in 1966 (Reference Jouzel, Merlivat, Pourchet and LoriusJouzel and others, 1979).
In the Hercules Névé core the tritium concentration ranges between 0 (1027 cm depth) and 33.6 (845 cm depth) TU (tritium unit, 1 TU corresponding to T/H = 10−18), with higher concentrations found at 700-845 cm (Fig. 2). Due to the low sampling frequency for tritium measurements, not allowing any observation of seasonal variations, a second-order polynomial curve was calculated and its apex was chosen as 1966 at about 7.5 m depth. This corresponds perfectly to the year suggested by the seasonal variations of the chemical and isotope parameters.
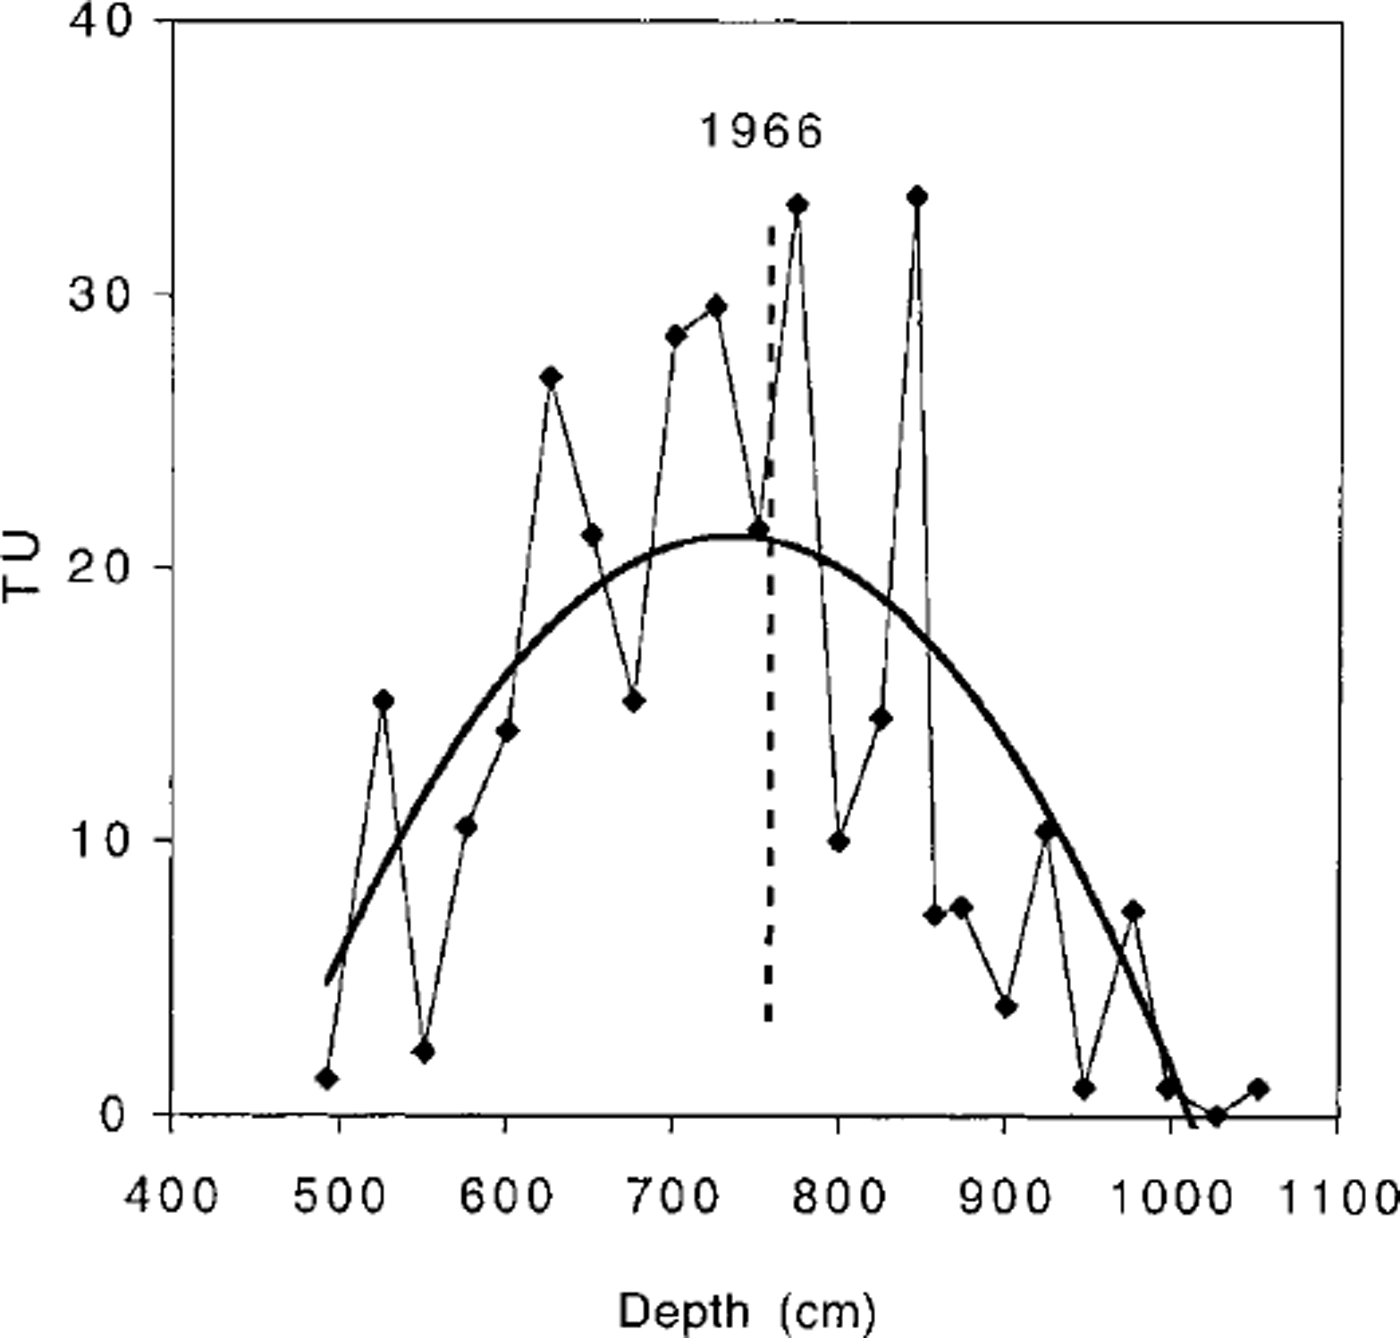
Fig. 2. Tritium content vs depth; the curve in bold represents a second-order polynomial regression fit.
Figure 3 shows the chemical and isotope profiles of the first 6 m of the core.
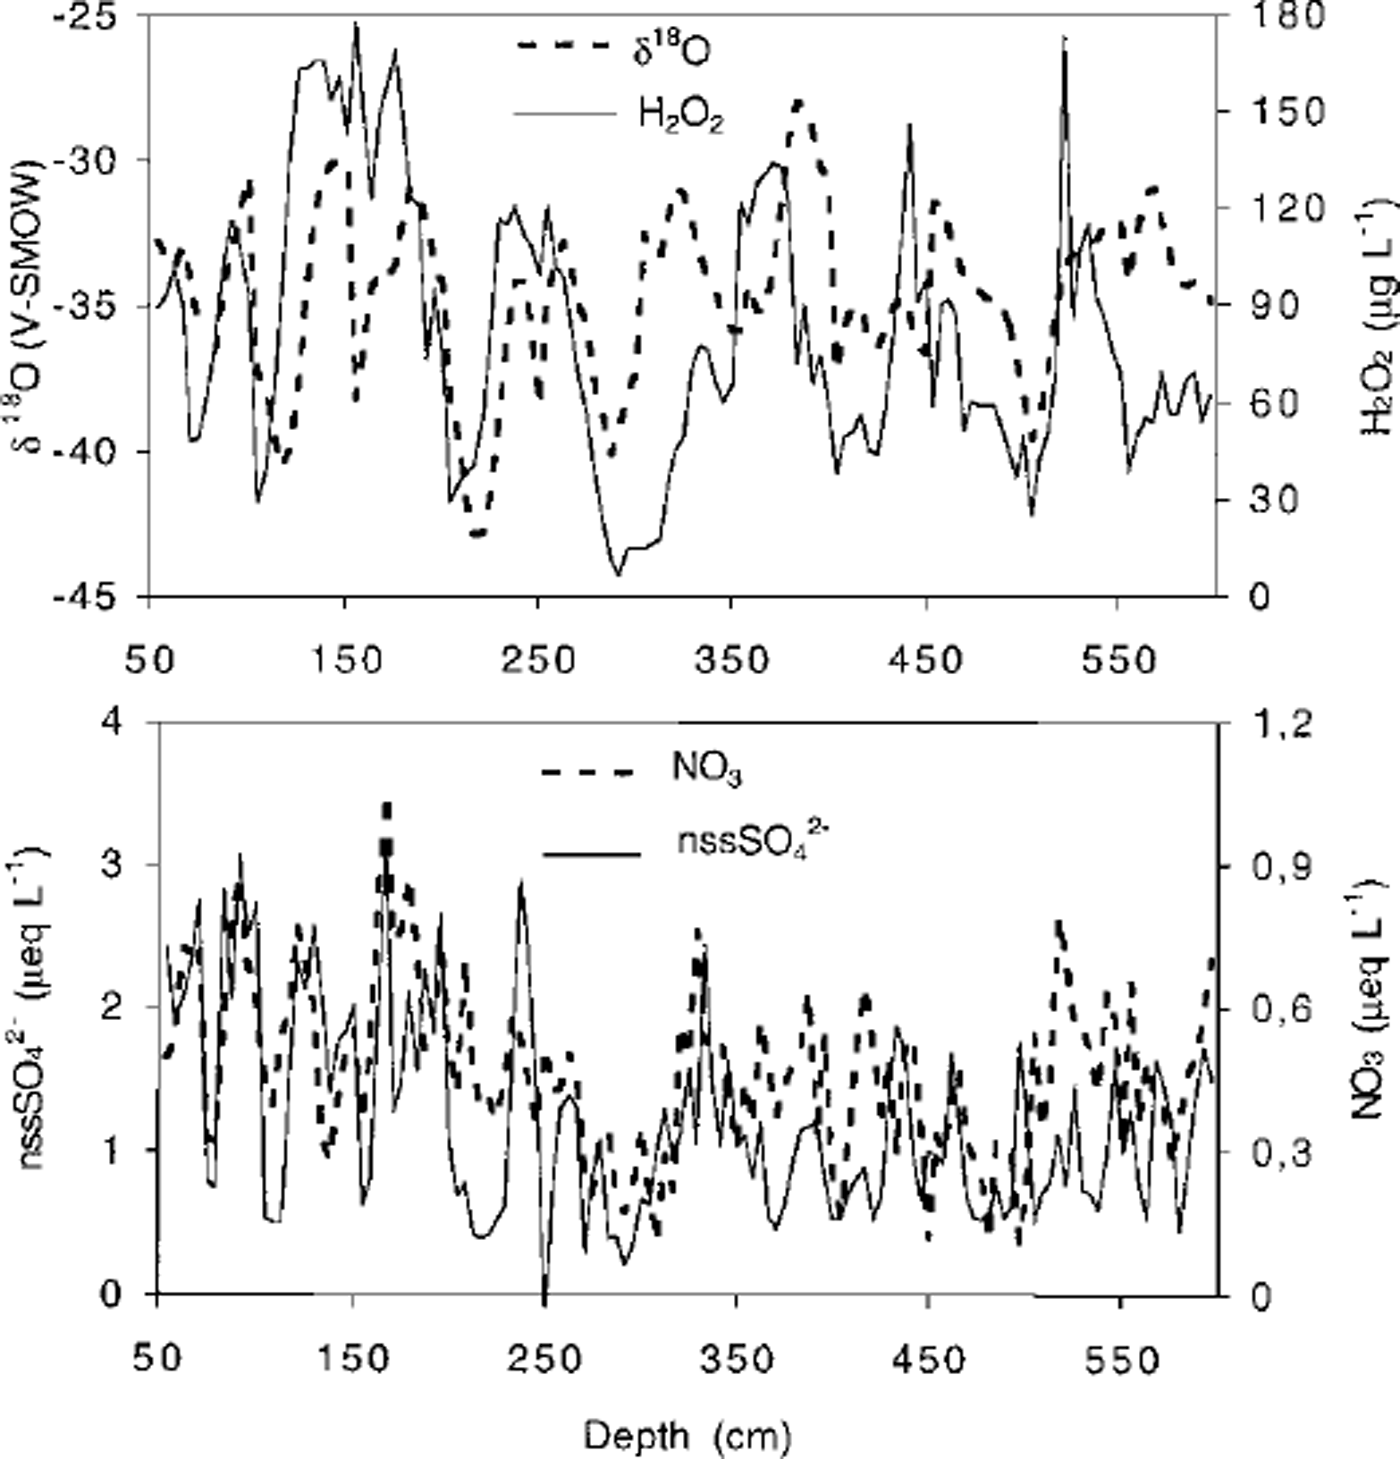
Fig. 3. δ18O, H2Oz nssSO4 2– and NO3 – profiles in the upper part of Hercules Névé core.
The stable-isotope composition of atmospheric precipitation preserved in polar regions mainly reflects condensation temperature (Reference DansgaardDansgaard, 1964) but also reflects changes in moisture sources (Reference Charles, Rind, Jouzel, Koster and FairbanksCharles and others, 1994), variations of sea-ice extent (Reference Bromwich and WeaverBromwich and Weaver, 1983) and seasonal variations in the timing of precipitation events (Reference Steig, Grootes and StuiverSteig and others, 1994). The δ180 values in the upper part of the core range between -42.9‰ and -28.0‰ (Vienna standard mean ocean water), the observed variations being related to seasonal variations of this parameter. The calculated overall mean δ18O value is -35.38‰. The amplitude of the δ180 seasonal variation decreases with depth (Fig. 3) because smoothing processes act more effectively in the firn layers when accumulation rates are quite low (Reference JohnsenJohnsen, 1977).
The atmospheric concentration of hydrogen peroxide is modulated by photochemical processes which reach their maximum intensity during summer. At Hercules Névé the H2O2 concentration shows a median value of 38 μg L−1, with higher concentrations in the upper part of the core, while below 20 m, H 2 0 2 values decrease and the profile is smoothed out. At the South Pole, where the accumulation rate is about 7 gem−2 a−1 (Reference Langway, Osada, Clausen, Hammer and ShojiLangway and others, 1995), a 6m snow pit was studied (Reference Whitlow, Mayewski and DibbWhitlow and others, 1992), but H2O2 was not used as a dating parameter due to the poor relationship with δ180 peaks and a smoothing effect with increasing depth. At sites with higher accumulation rates, the "dramatic" H2O2 smoothing was not observed (Reference Morgan, Wookey, Li, van Ommen, Skinner and FitzpatrickMorgan and others, 1997), and this compound was used as a time-scale parameter. This difference may be related to post-deposition processes that complicate the H2O2 profile, particularly in the case of low accumulation rates. The H2O2 was therefore used as a timescale parameter only in the upper part of the core (0.5-10 m).
The most important sources of Cl- in Antarctica are sea water and volcanic emissions, although near the coast the latter are negligible (Reference Legrand and DelmasLegrand and Delmas, 1988). At Hercules Névé the median value of the Cl- concentration is2.62 μeq L−1 (mean = 5.36 μeq L−1). This is much lower than the value found in the coastal area of Terra Nova Bay (Reference Piccardi, Udisti and CasellaPiccardi and others, 1994; Reference Gragnani, Smiraglia, Stenni and TorciniGragnani and others, 1998) but higher than the value found at other Antarctic sites at lower elevations than Hercules Névé. At Dyer Plateau (about 2000 ma.s.l.) the mean concentration of three cores is 1.09-1.48 μeq L−1 (Reference Cole-Dai, Thompson and Mosley-ThompsonCole-Dai and others, 1995), whereas at Byrd station (about 1530 ma.s.l.) it is 1.52 μeq L−1 (Reference Langway, Osada, Clausen, Hammer, Shoji and MitaniLangway and others, 1994). This confirms that at Hercules Névé the influence of sea spray is significant. Generally, the Cl- concentration increases during the coldest season.
Nitrate is produced by the oxidation of NOx, the main sources of NOx in Antarctica being lightning and transport from the stratosphere-troposphere (Reference HerronHerron, 1982; Reference Legrand and DelmasLegrand and Delmas, 1986). At Hercules Névé the median value is 0.45 μeq L−1, and the rather low standard deviation (0.19) suggests a low variability of the NOx sources. The annual maximum of NC3- concentration generally occurs earlier than δ180 in the upper part of the core. A recognisable NO3- seasonal signal occurs along the whole firn core.
Marine biogenic activity, sea salt and sporadic volcanic events are the main sulphate sources. Non-sea-salt (nss) S04 2- was calculated (μeq L−1) by subtracting the sea-water fraction from total S04 2- according to the equation nssSO42- = SO4 2 – (0.103Cl-). As Na+ was not measured, CF was used as an indicator of sea salt, although a minor percentage of Clean derive from volcanic activity. Negative nssSO42- values corresponding to high CF concentrations are due both to a chemical reaction between NaCl and H2SO4, and to the partition of Na2SO4 and HCl produced in that reaction (Reference Legrand and DelmasLegrand and Delmas, 1988). Especially near the coast, negative nssSO42- values could be related to fractionation processes probably occurring on the sea-ice surface (Reference Hall and WolffHall and Wolff, 1998; Reference WagenbachWagenbach and others, 1998).
In order to evaluate the volcanic contribution of S04 2- we considered the background nss sulphate level corresponding to the mean of the positive values of nssS04 2- (0.93 μeq L−1) plus the standard deviation (0.60 μeq L−1). The probability that the peak has a volcanic origin increases with increasing height and area.
The concentration of nssSO42-, shows well-defined annual cycles in phase with the δ180 profile in the upper part of the core where all chemical species show well-defined annual cycles (Fig. 3) and the highest values correspond to late spring/summer. This relationship between nssSO4 2– and seasonality is confirmed by the significant correlation coefficient between δ180 and nssSO42- (r = 0.38, n = 1027, sig. < 0.001%, if samples corresponding to major volcanic eruptions and negative values of nssSO4 2– are not considered).
As a first step, the core was dated using seasonal variations in δ18O, H2O2, NO3 – and SO4 2- concentrations coupled with the tritium time-marker level; the dating was then fine-tuned, re-examining some doubtful peaks, and using volcanic levels as time markers in order to reduce the error by 2-3%. The overall period of 222 years covers the time interval AD 1770-1992. Figure 4 shows the nssSO42- profile and the peaks corresponding to the dates of some known explosive volcanic eruptions. The highest nssSO42- concentration is found at 34.80-35.15 m. This layer was dated AD 1816-17 and corresponds to theTambora eruption (AD 1815) This vol-came signal has been found in the AD 1816 level of many Antarctic and Greenland cores (Reference Legrand and DelmasLegrand and Delmas, 1987; Reference Clausen and HammerClausen and Hammer, 1988). Another pronounced volcanic signal was found at 35.71-36 m, 6 years before the previous one (Reference Dai, Mosley-Thompson and ThompsonDai and others, 1991), corresponding to the well-known volcanic event in 1809, called "Unknown" since the eruption centre has not yet been discovered. The eruption marker found at 31.81-32.02 m (dated 1836) was correlated to the Coseguina volcanic eruption (AD 1835). The signal of this eruption has been identified at Byrd station (Reference Langway, Osada, Clausen, Hammer, Shoji and MitaniLangway and others, 1994), at Dome C (Reference Legrand and DelmasLegrand and Delmas, 1987) at the South Pole (Reference Langway, Clausen and HammerLangway and others, 1988; Reference Delmas, Kirchner, Palais and PetitDelmas and others, 1992) and at Mizuho Plateau (Reference Moore, Narita and MaenoMoore and others, 1991). The spike found at 27.6 m could be related to the Makjan eruption (AD 1861). The signal of this eruption is not clearly separated from Cotopaxi (AD 1856) either at Dome C or at Mizuho Plateau (Reference Legrand and DelmasLegrand and Delmas, 1987; Reference Moore, Narita and MaenoMoore and others, 1991). The Krakatoa (AD 1883) andTarawera (AD 1886) signals were also identified in many Antarctic cores. The prominent spike at 12.82-13.14 m is dated 1937. A low signal is present in 1937 at the Siple and Dyer ice cores, and this has been tentatively attributed to the Darney Island eruption (South Sandwich Islands) in 1936 (Reference Cole-Dai, Thompson and Mosley-ThompsonCole-Dai and others, 1995). No evident signal was recorded at the South Pole around 1937 (Reference Delmas, Kirchner, Palais and PetitDelmas and others, 1992), whereas at Mizuho Plateau a low peak is present around 1937, but Reference Moore, Narita and MaenoMoore and others (1991) did not record any comment on this peak. Reference LambLamb (1970,Reference Lamb1977b, Reference Lamb1983) reports some eruptions in 1937 characterised by a low dust veil index (DVI), whereas Bradley and Jones (1992) report an eruption of Rabaul in 1937 characterised by a volcanic explosivity index (VEI) of 4. Since at Hercules Névé the magnitude of the 1937 signal is higher than that of some signals corresponding to eruptions with higher DVI, it is possible that this signal reflects more than one event. Other, less prominent spikes may correspond to known volcanic eruptions, as suggested in the caption to Figure 4, while others could be related to unknown events.
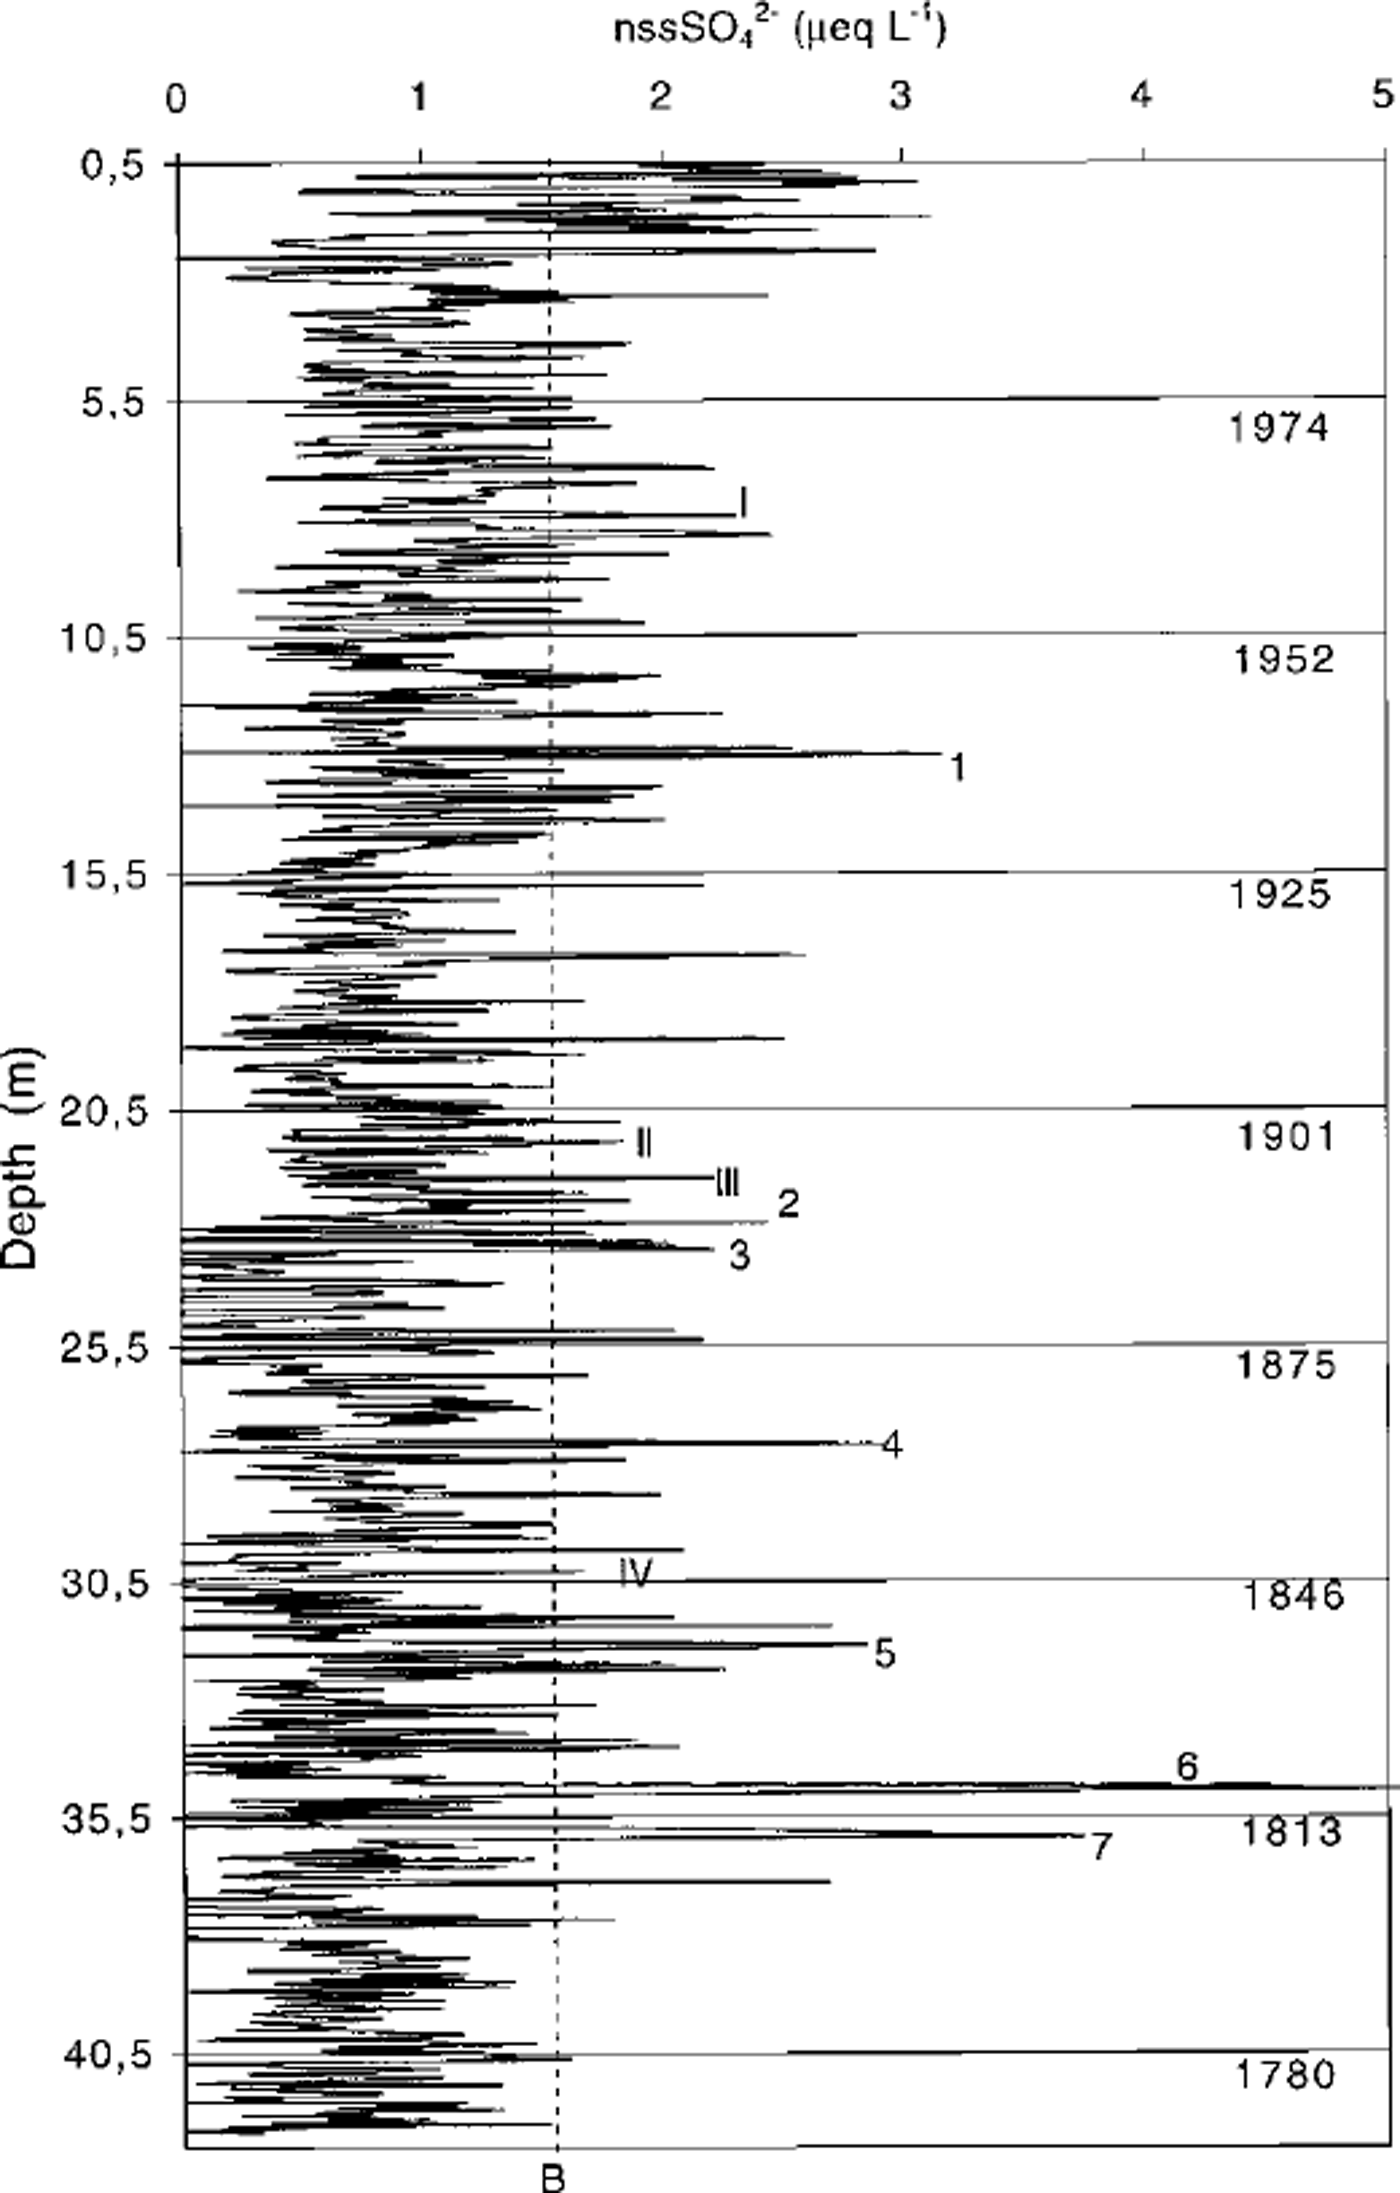
Fig. 4. nssSO4 2– profile at Hercules Névé. Spikes correspond with high probability to the following volcanic eruptions: 1. Rabaul (1937); 2 Tarawera (1886); 3 Krakatoa (1883); 4. Makjan (1861); 5. Coseguina (1835); 6 Tambora (1815); 7. Unknown. Spikes could be referred to: I. Agung; II. Thompson Island (1895); III Awu (1892); IV. Armagura (1846). B, nssSOt background (mean + std dev.).
To compare the magnitude of volcanic events at the same site or at different sites, it is useful to use the SO4 2- volcanic fallout. This has been calculated taking into account the difference between the area of the peak and the area due to the background. The fallout of volcanic products depends upon snow-accumulation rate, latitude and season of eruption. Latitude has an important influence on the distribution of volcanic emissions and the partition between the Southern and Northern Hemispheres. It has been found that eruptions occurring at mid- and high latitudes generally do not contribute to volcanic fallout in the opposite hemisphere. Moreover, the efficiency of the atmospheric transport and removal mechanism may vary seasonally. Due to the variability of these factors the variation of volcanic deposition among different sites is quite high. As a consequence, the deposition differences for any eruption are expected to be high, as reported in Table 1. In order to obtain a better comparison among different events in a single core or among different cores, a relative deposition may be calculated for theTambora eruption. These ratios from Hercules Névé are in good agreement with those observed at the South Pole, at Siple station, Antarctic Peninsula, and at Mizuho Plateau, East Antarctica.
Table 1. Volcanic deposition (φ in kg km-2) at different sites, and relative deposition (r) with respect to Tambora eruption

The mean annual δ180 values, calculated after dating by the multi-parametric approach coupled with stratigraphic time markers, are reported in Figure 5 against time. A smoothed profile (3 year moving average) is also shown in order to reduce the uncertainty due to dating errors and to interannual variability in the 6 profile. Nevertheless, a marked interannual variability was observed in both profiles, the variations being not only related to a temperature effect, due to the large differences in the isotopic composition involved. This pattern has already been observed at other Antarctic sites and may be referred to other factors (apart from the temperature) influencing the isotope composition. These may be the variability of the sea-ice extent (Reference Bromwich and WeaverBromwich and Weaver, 1983), storm frequency, the timing of precipitation events (Reference Steig, Grootes and StuiverSteig and others, 1994), seasonal changes in moisture sources and variations in the ratio of summer to winter accumulation rates: in the event of large seasonal changes, this variation may cause similar changes in the mean annual values (Reference Morgan and van OmmenMorgan and Van Ommen, 1997). The effect of sea-ice extension reflects the increasing distance between source areas and precipitation sites; a northward increase of sea-ice coverage will cause decreasing values in the isotopic composition of precipitations. On the other hand, an increased storm frequency in winter will cause an 18O enrichment in the mean annual δ values. Storms are indeed associated with above-average temperatures advecting warm air to the continent.
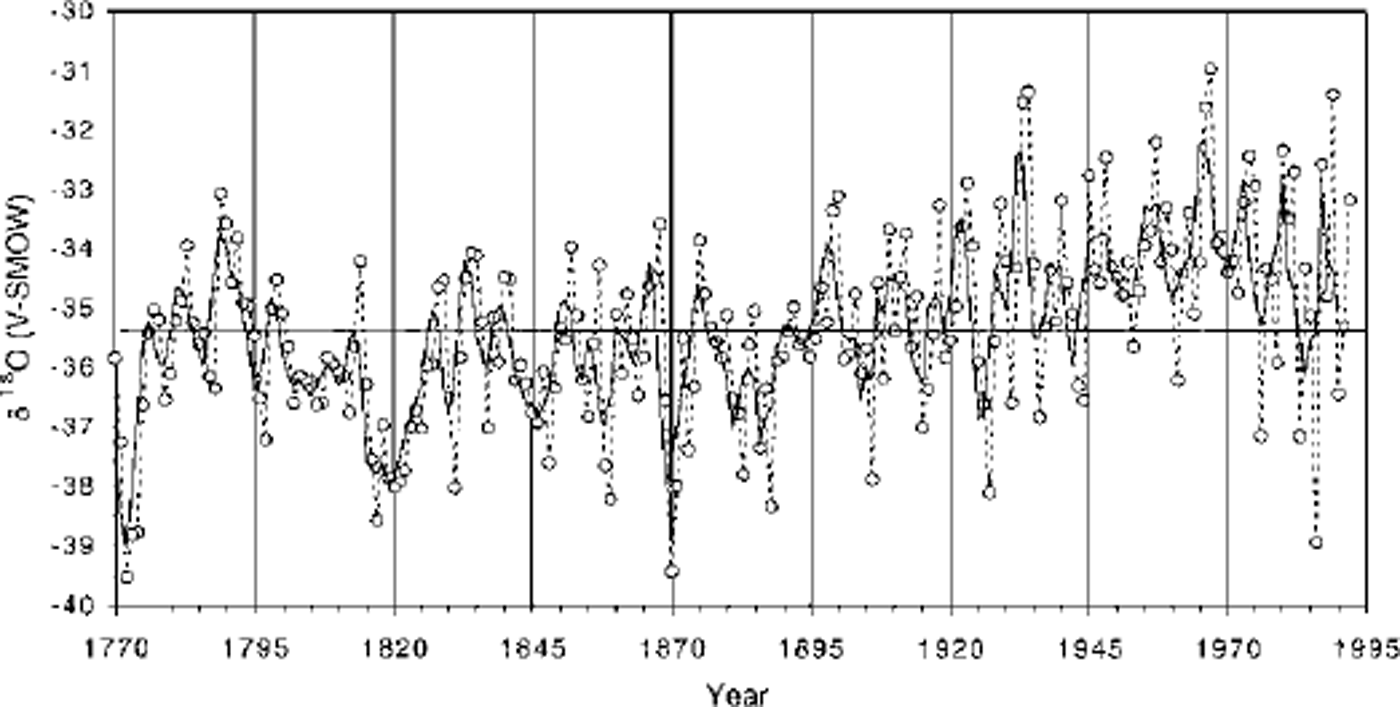
Fig. 5. Mean annual δ18O record (dashed line) and 3 year moving average (thick line) of the firn core. The horizontal line represents the overall mean δ18O value (-35.38‰).
Some observations can be made on the mean annual 6 record reported in Figure 5. An overall increasing trend in the mean annual «5180 values is apparent in recent times, starting at the end of the 19th century; after AD 1967 a slightly decreasing trend may be observed. An increase of 0.023‰ a−1 from AD 1890 to 1967 has been calculated. Although care must be taken in comparing different time periods, a value of 0.039‰ a−1 from AD 1928 to 1993 has been found at this site in a 22 m firn core (Reference MaggiMaggi and others, 1998). Some variance between the two cores may be related to stratigraphic noise due to non-uniform accumulation processes and post-deposition effects. A value of 0.036‰ a−1 (AD 1932-91) has been reported by Reference Isaksson, Karlen, Gundestrup, Mayewski, Whitlow and TwicklerIsaksson and others (1996) at Dronning Maud Land, while for the Antarctic Peninsula a value of 0.046‰ a−1 was calculated for a shorter period (AD 1958-80; Peel, 1992). This increasing trend in the 6 values found in the Hercules Névé core confirms what has been observed in other ice-core records from East Antarctica (for a complete review see Mosley-Thompson, 1992). These data suggest a warming trend since 1850, while an opposite tendency has been reported for the Antarctic Peninsula. Since 1975 this trend seems to have been reversed. Recently, Reference Morgan, Wookey, Li, van Ommen, Skinner and FitzpatrickMorgan and others (1997) reported for the Dome Summit South (DSS) core at Law Dome, East Antarctica, a relatively rapid temperature increase in the last 100 years.
As regards the bottom section of the firn core, the isotope record suggests "colder"environmental conditions (more negative δ18O values) at Hercules Névé for the period AD 1770-1890, the most negative values being centred around AD 1870-71, 1816-22 and 1772-74. This colder period seems to correspond to the above-mentioned cold LIA episode, even though particular care must be taken in using this term with a global meaning.
A better understanding of the climatic significance of the isotope variations recorded in the Hercules Névé core requires a comparison with other Antarctic ice-core records. Previous ice-core records from East Antarctica (Reference Mosley-Thompson, Bradley and JonesMosley-Thompson, 1992), such as Law Dome (Reference MorganMorgan, 1985), Mizuho (Reference Watanabe, Kato, Satow and OkuhiraWatanabe and others, 1978) and the South Pole (Reference Mosley-Thompson, Kruss, Thompson, Pourchet and GrootesMosley-Thompson and others, 1985), suggest similar colder conditions in the time period encompassing the LIA. The smoothed SD record observed in the 905 m ice core drilled at Dome C (Reference Benoist, Jouzel, Lorius, Merlivat and PourchetBenoist and others, 1982) also suggests cooler conditions from AD 1200 to 1800. The Mizuho and Law Dome profiles resemble more closely the Hercules Névé record, with the coldest conditions from AD 1750 to 1850. Reference Morgan, Wookey, Li, van Ommen, Skinner and FitzpatrickMorgan and others (1997) found the lowest Holocene δ18O values at Law Dome (DSS core) around AD 1800 and referred them to the LIA. The records from the Antarctic Peninsula (e.g. Siple Station: Reference Mosley-Thompson, Thompson, Grootes and GundestrupMosley-Thompson and others, 1990)seemtoshowanoppositepattern.
A final consideration concerns the possible link between climate and volcanism. The presence of acid droplets in the stratosphere, reducing atmospheric transmissivity and incoming solar radiation, may cause a temporary decrease of surface temperatures. The relationship between climatic variations and the biggest volcanic eruptions in the past can be investigated by studying the sulphate and the isotope content preserved in ice-core records. For this purpose we considered the Tambora eruption (1815), an event of global importance. There is a long-running debate regarding the climatic effects of this eruption. Reference Angell and KorshoverAngell and Korshover (1985) suggested that the cooling during the decade AD 1810-20 seems to have begun before the Tambora eruption. Reference Dai, Mosley-Thompson and ThompsonDai and others (1991) suggested on the basis of ice-core evidence that the AD 1809 eruption ("Unknown") may have triggered a cooling at the beginning of this period and that the Tambora may have accentuated this tendency. In point of fact, in the Hercules Névé core the most negative 6 values (meaning cooler conditions) are recorded in AD 1816 and 1817 (minimum value). This would seem to suggest a link between surface temperatures and the Tambora eruption, but from the isotope profile reported in Figure 5 it appears that the cooling lasted longer (1815-26). Moreover, no clear relationship between 6 values and volcanic signals can be found in other sections of the core. The Tambora eruption can probably be superimposed on a climatic variation already under way. More direct comparisons between acid spikes and δ values in ice cores are needed in order to evaluate the possibility that the relation between climate and volcamsm could be recorded in this type of archive.
The mean snow-accumulation rate obtained for the whole core is 119 kg m−2 a−1 (std dev. = 36.5). If we take into account the mean value calculated between different marker levels (AD 1966-92 = 129 kg m−2 a−1; AD 1937-65 = 112 kg m-2a-1; AD 1884-1936 = 123 kg m−2 a−1; AD 1862-83 = 126 kg m−2 a−1; AD 1836-61 = 111 kg m−2 a−1; AD 1816-35 = 114 kg m–2a–1; AD 1770-1815 = 111 kg m−2 a−1) the snow-accumulation rate did not change significantly throughout the period investigated (Fig. 6). A high interannual variability has been observed since AD 1840, while a lower variability characterises the preceding period. This corresponds to the low isotope values related to the LIA. Higher accumulation rates have been found in a previous drilling at Hercules Névé (Reference MaggiMaggi and others, 1998). We must take into consideration that the time intervals covered by these two cores are different and that local variations in snow-accumulation patterns (probably due to wind redistribution) may explain this variance.
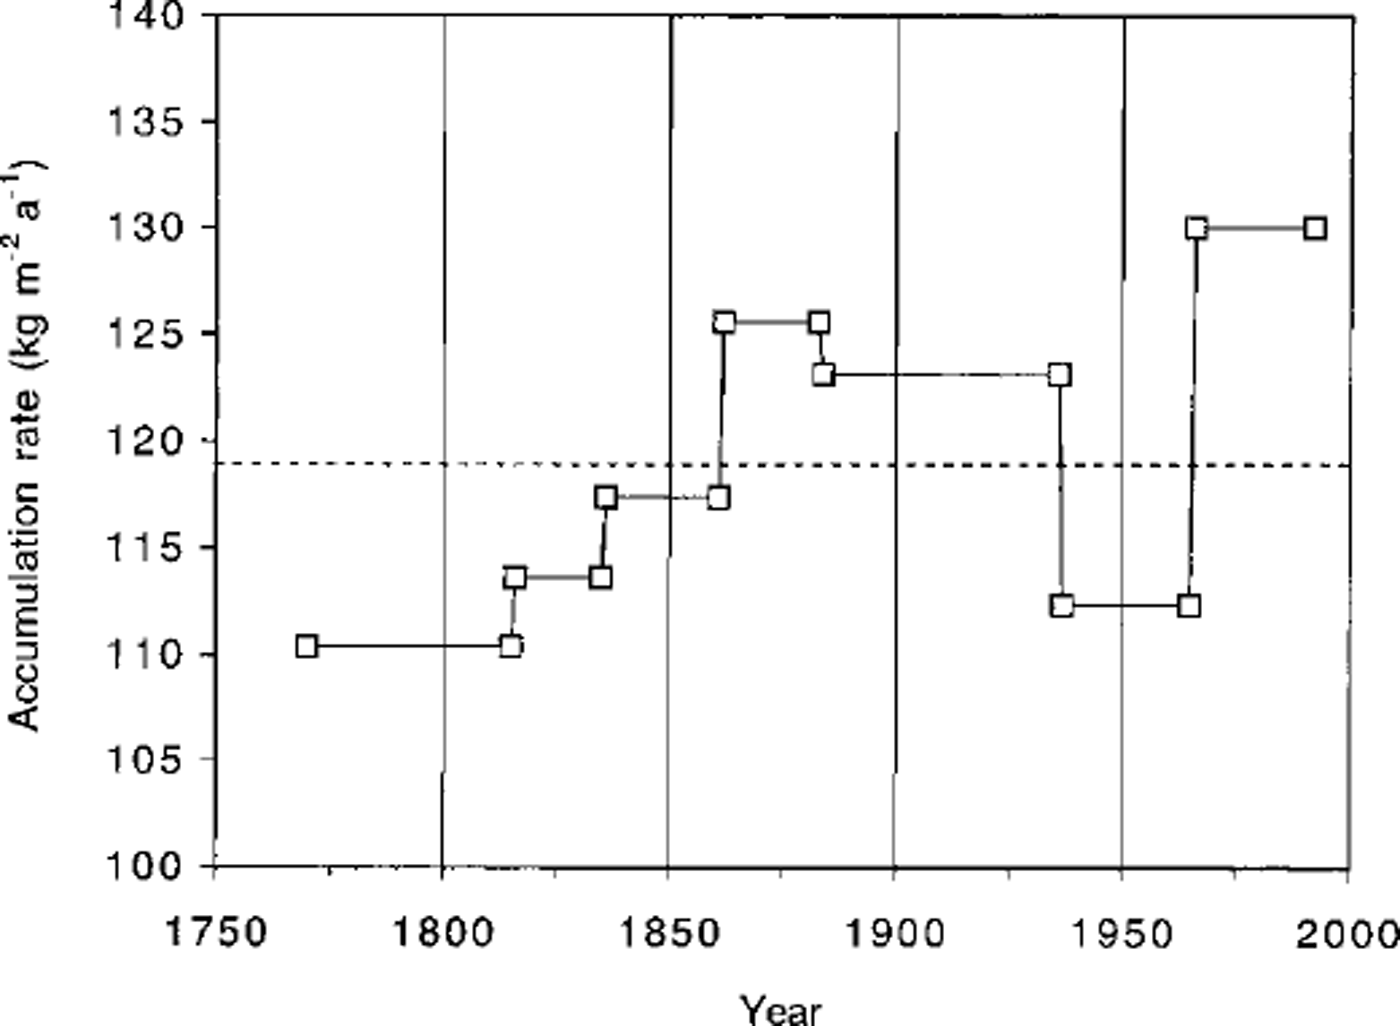
Fig. 6. Mean accumulation rate between different marker levels. The horizontal dashed line represents the overall mean accumulation rate (119 kg m-2 a−1).
Conclusions
A record of the volcanic eruptions covering the last 222 years has been reported for northern Victoria Land. Relative volcanic fluxes with respect to Tambora have been determined for various eruptions, and quite good agreement has been found with those already reported in the literature.
The importance of time markers constraining ice-core dating has been emphasised in order to obtain a reliable time-scale to reconstruct past environmental changes from ice cores. The reported δ18O profile, encompassing part of the LIA, provides additional data for a better understanding of the geographical extension of this "cold" period, confirming the differences between the environmental patterns of the Antarctic Peninsula and East Antarctica already pointed out by previous studies. The recent temperature rises suggested by the Hercules Névé core confirm what has already been observed in other ice-core records recovered from East Antarctica; this increase in «5180 values may be related not only to a "warming" phase but also to a change in environmental conditions (e.g. sea-ice extent) in that area and/or an increase in storm frequency leading to more positive isotope values.
Further studies in northern Victoria Land will help to show whether this record is representative of past climatic and environmental changes in the area studied.
Acknowledgements
This research was carried out in the framework of a project on glaciology and paleoclimatology of the Programma Nazionale di Ricerche in Antartide, and financially supported by Ente per le Nuove Tecnologie, l’Energia e l’Ambiente through a cooperation agreement with Università degli Studi di Milano. The authors wish to thank the Italian Antarctic Project and the X Antarctic Expedition logistic staff for their help during the drilling operations.
Special thanks to two anonymous reviewers for helpful suggestions.


