No CrossRef data available.
Published online by Cambridge University Press: 25 March 2019

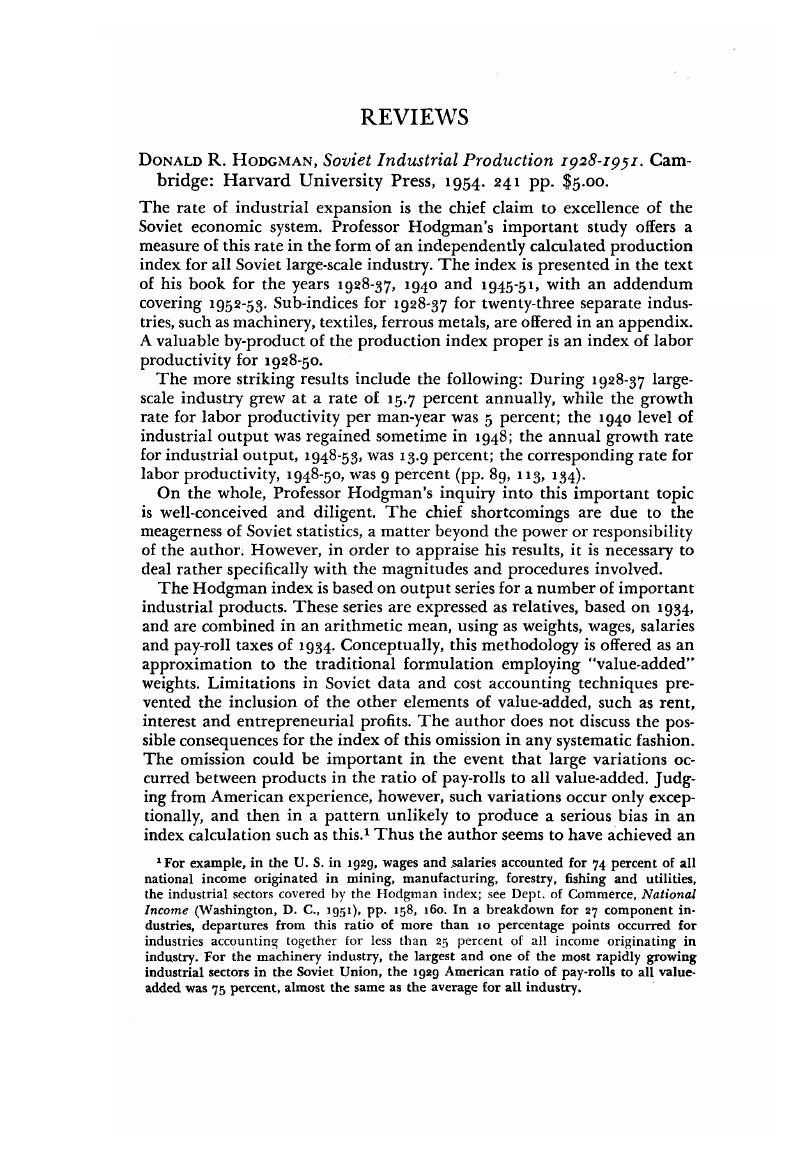
1 For example, in the U. S. in 1929, wages and salaries accounted for 74 percent of all national income originated in mining, manufacturing, forestry, fishing and utilities, the industrial sectors covered by the Hodgman index; see Dept. of Commerce, National Income (Washington, D. C, 1951), pp. 158, 160. In a breakdown for 27 component industries, departures from this ratio of more than 10 percentage points occurred for industries accounting together for less than 25 percent of all income originating in industry. For the machinery industry, the largest and one of the most rapidly growing industrial sectors in the Soviet Union, the 1929 American ratio of pay-rolls to all valueadded was 75 percent, almost the same as the average for all industry.
2 That is, 534%/438% = 122%.
3 Hodgman's large-scale index shows 1937 at 371 percent of 1928, i.e. 62.7 billion “true” 1926/27 rubles. This, plus the 5.2 billion for small-scale, indicates a 1937 total for all industry of 69.7 billion, or 311 percent of the 21.8 billion for 1928. (371%/311% = 119%.)
4 On the same alternative assumptions concerning the upward bias in the Soviet small- scale series, output of all industry in 1932 would be 150.155 percent of 1928, as opposed to the Hodgman large-scale figure of 172 percent. This implies annual growth rates for all industry of 10.7-11.6 percent tor the First, and 15.3-14.9 percent for the Second Five- Year Plans. For the same intervals, the Hodgman large-scale industry index shows 14.5 percent and 16.6 percent respectively.
5 The 22 post-war series account for about 49 percent of the 1934 value-added weights, of which 3.32 percent go to tractors and motor vehicles; see pp. 81.82, 215.21. By contrast, in the index for 1928.37, machinery accounted for 31.75 percent of the total weights; see p.73.
6 For example, see Malenkov, G., Otchetnyj doklad XIX s'ezdu partii (Moscow, 1952), p. 38.Google Scholar
7 Ibid.
8 The Central Statistical Administration publishes yearly percentage increases for most important civilian machinery items. For 1946-1950, these increases for almost every item in every year have exceeded the growth rates for industry generally. For 1951-1953, the increases continue on average to be above those for the rest of industry, but the tendency is less pronounced. Munitions may have grown less rapidly than civilian machinery, but with the advent of atomic weapons and the Korean war, it is unlikely that they lagged behind industry generally.
9 Among others, see Hodgman, op. cit., pp. 8 ff. 10 E.g. Malenkov, loc. cit.