


INTRODUCTION
The direct election of executives with police power is a key feature of the American system. Increasing partisan polarization across the country has raised concerns that these local executive elections lead elected officials to apply the law differently for partisan reasons, rather than to act as neutral arbiters, compromising the legitimacy of law enforcement.Footnote 1 Yet, these elections could also act as a moderating force, selecting candidates who advocate a politically neutral approach to law enforcement. Do elected law enforcement officials make partisan enforcement decisions?
Republican and Democratic representatives make unmistakably different policy choices across a wide range of offices, even when compared with others serving the same constituents (Ansolabehere, Snyder, and Stewart Reference Ansolabehere, Snyder and Stewart2001; Bafumi and Herron Reference Bafumi and Herron2010; Besley and Case Reference Besley and Case2003; Caughey, Xu, and Warshaw Reference Caughey, Xu and Warshaw2017; de Benedictis-Kessner and Warshaw Reference de Benedictis-Kessner and Warshaw2018; Fowler and Hall Reference Fowler and Hall2016; Lee, Moretti, and Butler Reference Lee, Moretti and Butler2004). The similarity of policies put in place by Republican and Democratic executives at the local level may be an exception or it may simply reflect the constraints executives face (Ferreira and Gyourko Reference Ferreira and Gyourko2009; Gerber and Hopkins Reference Gerber and Hopkins2011). Recent evidence suggests that executives may move policy in their party’s preferred direction when they have the necessary discretion (de Benedictis-Kessner and Warshaw Reference de Benedictis-Kessner and Warshaw2016; Kousser Reference Kousser2002).
To isolate the differences between Republicans and Democrats in terms of the policies they choose, I focus on a case in which the local policy maker has considerable flexibility: a sheriff’s decision to detain unauthorized immigrants on behalf of federal immigration authorities. The vast majority of states during the period I studied place no constraints on a sheriff’s choice to comply with these requests from immigration authorities. Given the authority sheriffs have overcompliance with these detainer requests and the scale of their use—more than 677,000 instances of detention—journalists and advocates have argued that sheriffs determine immigration enforcement levels in their counties.Footnote 2
Simply comparing compliance in places that elect Democrats with those that elect Republicans could capture differences due to factors other than who controls the sheriff’s office. I overcome this using a regression discontinuity design (RDD) design, estimating the difference in compliance between counties that just barely elect a Democrat or Republican (Eggers et al. Reference Eggers, Fowler, Hainmueller, Hall and Snyder2015).Footnote 3 To estimate this difference, I use my newly collected dataset of 3,500 sheriff elections, drawn from the roughly 85% of counties with sheriffs elected in partisan races and pair it with administrative data measuring sheriff compliance with detainer requests.
I find that, in counties with close elections, the average Democratic sheriff cooperates at nearly the same rate as the average Republican sheriff. As I detailed below, a sheriff’s choice to cooperate with immigration authorities is only one step in the path from arrest to deportation. I use the same regression discontinuity design to test for differences in the number of background checks they send to the Department of Homeland Security and the policies they state publicly. These measures are noisier, but I also find no substantial partisan differences between Democratic and Republican sheriffs on these other dimensions.
I demonstrate that this result cannot be simply explained by homogeneous voter preferences across parties. Indeed, when members of Congress from similar districts vote on immigration enforcement matters, and when voters from the same county are asked about immigration enforcement, Democrats and Republicans make radically different choices. Further, Democratic and Republican sheriff candidates from the same county make noticeably different donations to federal and state candidates in their personal life. I present suggestive evidence that this convergence is instead a consequence of sheriffs having more similar preferences over local immigration enforcement across party than the general public.
These results allay concerns that immigration law is enforced differently based on the partisan attachments of the executive in charge, at least when the law enforcement official is elected. A growing literature in political science argues that local officeholders will take actions to agree with their national party agenda rather than pursuing the policies that increase local welfare (e.g., Hopkins Reference Hopkins2018). My results suggest that, at least in this case, local officeholders tasked with controlling crime and running jails are not independently pursuing their party’s national agenda in a highly salient policy domain.
PARTISANSHIP IN LOCAL OFFICES
The degree to which elections tether policy to the preferences of the electorate is one of the key questions in political science. Elections are said to place a pressure on candidates to appeal to the median voter (Downs Reference Downs1957). In a dynamic setting where candidates can serve multiple terms, the threat of future electoral sanction pushes policy making toward the median voter as well (Ashworth Reference Ashworth2012; Fearon Reference Fearon, Mann, Przeworski and Stokes1999). Despite this pressure, Republicans and Democrats elected in similar districts make different policy choices in a wide variety of offices, implying that representatives from at least one party, and likely both, are not conforming to the preferences of the median voter (Ansolabehere, Snyder, and Stewart Reference Ansolabehere, Snyder and Stewart2001; Bafumi and Herron Reference Bafumi and Herron2010; Besley and Case Reference Besley and Case2003; Caughey, Xu, and Warshaw Reference Caughey, Xu and Warshaw2017; de Benedictis-Kessner and Warshaw Reference de Benedictis-Kessner and Warshaw2018; Fowler and Hall Reference Fowler and Hall2016; Lee, Moretti, and Butler Reference Lee, Moretti and Butler2004). There is further evidence that the threat of future electoral sanction is also not driving legislators to converge toward the median (Fouirnaies and Hall Reference Fouirnaies and Hall2018).
Local officeholders are said to face an additional pressure to converge, arising from the inter-municipality competition over tax revenue (Peterson Reference Peterson1981; Tiebout Reference Tiebout1956). This competition rewards cities that offer more favorable tax policy, and the same competition can also apply to law enforcement, driving mayors to take up more aggressive strategies for reducing crime or changing the way law enforcement officials respond to undocumented immigration. Although some recent work is consistent with this model (Ferreira and Gyourko Reference Ferreira and Gyourko2009), including some work studying local immigration policy (Williamson Reference Williamson2018), it is by no means settled (Gerber and Hopkins Reference Gerber and Hopkins2011; de Benedictis-Kessner and Warshaw Reference de Benedictis-Kessner and Warshaw2016, Reference de Benedictis-Kessner and Warshaw2018).
Among the most common explanations for partisan divergence is the citizen-candidate model (Alesina Reference Alesina1988; Besley and Coate Reference Besley and Coate1997; Osborne and Slivinski Reference Osborne and Slivinski1996). This class of models, which points to candidate entry costs as an important factor in determining representation, is connected to a large empirical literature on the causes and consequences of candidate entry which finds that moderates are less likely to run (e.g., Besley Reference Besley2004; Fox and Lawless Reference Fox and Lawless2005; Hall Reference Hall2017; Thomsen Reference Thomsen2014). The key idea is that, when running is costly, a candidate whose views are further from the other candidate or candidates entering the race may be more willing to pay the cost of entry to move policy in their direction. This dynamic can leave voters to choose between two candidates who are some distance from the median voter.
Most of our understanding about local partisan convergence comes from studies of taxation, government spending, and government debt. But, although Republicans and Democrats have different views on national economic policy, local economic policy may not be as polarized among voters (Jensen et al. Reference Jensen, Marble, Scheve and Slaughter2019). Immigration enforcement, on the other hand, is a highly polarized issue at the national and local levels. Accordingly, if the conditions exist for divergence on any issue at the local level, immigration enforcement is one of the domains in which we would be most likely to observe it. Indeed, Creek and Yoder (Reference Creek and Yoder2012) found that states with Republican governors are more likely to pursue tough immigration enforcement policies. Further, the actions of many local officials are hemmed in by other political and bureaucratic actors. The existing empirical research on partisanship in local immigration enforcement has primarily focused on police, finding that they behave in a nonpartisan way, particularly when they are accountable to a city council rather than a partisan mayor (Lewis et al. Reference Lewis, Provine, Varsanyi and Decker2012; Lewis and Ramakrishnan Reference Lewis and Ramakrishnan2007). This is consistent with their role as bureaucratic policy implementers. But the work that includes sheriffs finds that they are more exposed to the electoral dynamics described above (Varsanyi et al. Reference Varsanyi, Lewis, Provine and Decker2012). Sheriffs also have a greater capacity to act on these electoral pressures, given their independence and joint role as policy maker and implementer. And, despite their more limited role in policing, sheriffs are responsible for the majority of local jails, a policy domain in which they can often exert significant discretion.
These results offer competing predictions for whether we should observe partisan divergence among sheriffs on immigration enforcement. Although reelection incentives and inter-municipality competition may drive convergence, if these forces are not strong enough, candidate entry could drive divergence. But the typical setup of the citizen-candidate model that results in divergence may not apply in this case. The common version of the model is that costs are similar for all potential candidates across the ideological spectrum and perhaps even highest for moderate candidates. The case of sheriffs offers a potential alternative scenario: If law enforcement experience leads people to adopt a view on immigration enforcement within a narrow range, and candidates for sheriff need law enforcement credentials to run,Footnote 4 the costs of running may be too high to permit entry to anyone outside a narrow band of the ideological spectrum.
In the following analyses, I first present evidence that Democratic and Republican sheriffs from similar counties make similar immigration enforcement decision. I then demonstrate that this is not a consequence of my choice to study immigration enforcement, finding that Democratic and Republican members of Congress from similar districts vote quite differently on immigration enforcement matters and that Democratic and Republican members of the public from the same county report different views on immigration enforcement. I also present evidence that this similarity between sheriffs of different parties does not hold on all issues—Democratic sheriff candidates are much more likely to donate to Democratic candidates for state and federal office than Republicans and vice versa. Finally, I test two substantive explanations based on the models above. First, I assess whether sheriff candidates hold more similar views on immigration enforcement across party, following the logic of heterogeneous entry costs I described above. Second, I estimate the effect of term limits on partisan convergence. The evidence I present in both cases is only suggestive, but it is more consistent with the heterogeneous entry cost and candidate selection stories than an electoral accountability model.
SHERIFFS AND IMMIGRATION ENFORCEMENT
Sheriff Elections
Unlike most other law enforcement officials, the vast majority of sheriffs are elected. Out of 3,142 counties or county equivalents, 3,083 in 46 states elect a county sheriff.Footnote 5 Five states, and a small number of counties outside these states, hold nonpartisan sheriff elections.Footnote 6 The remaining 41 states, totaling to more than 2,700 counties, hold partisan sheriff elections.
The Role of Sheriffs in Immigration Enforcement
Immigration policy is largely a federal matter, but the federal authorities request help from sheriffs at a few important junctions.Footnote 7 Immigration and Customs Enforcement (ICE), within the Department of Homeland Security (DHS), is responsible for most interior enforcement of federal immigration law. Although it is not a legal mandate of their office,Footnote 8 local law enforcement agencies still come across immigrants who are in the United States unlawfully in the course of their regular duties. Sheriffs, who are responsible for most jails, run federal background checks on most people who come into their custody. These background checks are administered by the Federal Bureau of Investigations and, in recent years, due to the federal program Secure Communities and the Priority Enforcement Program, have been shared with the DHS. The DHS then checks the immigration status of the individual held by a sheriff. If the DHS flags the person being held as an unauthorized immigrant, ICE can choose to send a request to the sheriff asking that he or she detain the immigrant for an additional 48 hours beyond scheduled release, so that ICE can pick up the person and process them through the immigration system. Figure 1 describes the basic path an unauthorized immigrant could take from arrest to deportation under the program that is currently active, Secure Communities.

FIGURE 1. Status of Unauthorized Immigrant From Arrest to Deportation, Secure Communities Program
The process of identifying and removing an unauthorized immigrant accused of committing a crime in the interior often requires cooperation between federal and local law and immigration enforcement. Decisions made independently by actors at the federal or local level can make it much harder for a particular unauthorized immigrant to be identified or removed.
ICE started operations in 2003, but detainer requests were relatively uncommon in the early years of the bureau because ICE had limited resources to determine whether a jail was holding a potential candidate for removal (Cox and Miles Reference Cox and Miles2013). In 2008, ICE began rolling out the Secure Communities program as part of the post September 11 mission to encourage data sharing across law enforcement agencies and to focus interior immigration enforcement on migrants who had committed crimes or were potential terrorist threats. This program allowed ICE to detain migrants accused and convicted of crimes more easily. The program was first rolled out primarily in South Florida and along the United States–Mexico border. According to calculations in Miles and Cox (Reference Miles and Cox2014), over 90% of the population living along the United States–Mexico border lived in a county where Secure Communities was active by 2010, and approximately 80% of the US population lived in a county where Secure Communities was active by 2012. Cox and Miles (Reference Cox and Miles2013) also found that the program was rolled out earlier in places with larger Hispanic and foreign-born population. They also found that political factors, such as Republican presidential vote share and local anti-immigration legislation, do not independently predict early activation. In 2013, all law enforcement agencies not yet enrolled were automatically made participants. In 2015, the Obama administration replaced Secure Communities with the Priority Enforcement Program through which the FBI continued to share fingerprint data with the DHS, but ICE was instructed to only pursue national security threats and individuals convicted of committed a serious crime (Alsan and Yang Reference Alsan and Yang2018). The Trump administration reactivated Secure Communities in 2017.
More than 368,000 deportations since 2009 began with an apprehension under a well-defined interior enforcement program. Of those deportations, over 153,000 were facilitated by the Secure Communities program. Another 115,000 were initiated under the 287(g) program that also enlists local law enforcement in cooperation with ICE.Footnote 9
EMPIRICAL APPROACH
Competitive Partisan Elections for Sheriff, 2003–16
For this project, I gathered an original dataset of 3,500 sheriff elections held between 2003 and 2016. Fifteen states with partisan sheriff elections collect most or all county-level election results at the state level for some of the years I studied.Footnote 10 I collected all these election results. I supplemented these data by collecting sheriff election results from 2003 to 2016 for every county with a population over 100,000 according to the 2000 Census. I collected these data from each of the roughly 400 county election boards directly. I focused on large counties because they are more likely to have a large enough population of unauthorized immigrants that at least some would end up in a sheriff’s custody and be subject to a detainer request.
Table A.1 in the Online Appendix compares the sample with all regularly scheduled general elections for sheriffs that occurred from 2003 to 2016.Footnote 11 The sample covers 80% of all partisan sheriff elections held in high-population counties during this period and 32% of all sheriff elections. Since the large, partisan sample is nearly a census, the elections I collected from large counties look very similar to the full set of elections held in large counties in terms of geographic distribution, voting population, recent presidential voting, and partisan control of the governor’s office. Overall, my sample includes fewer sheriff races in the Midwest and more everywhere else.Footnote 12 I also have more elections in larger counties and counties with larger foreign-born population. All told, this means the estimates are a weighted average of the county-level treatment effects where large counties are weighted up. In the appendix, the main results comparing large-only estimates and all-county estimates are reported.
37% of all partisan races in the sample, and 48% of the large-county elections, have at least one Democrat and Republican competing. In both the full sample and the large-county sample, roughly 55% of races have two or more candidates receiving votes. The typical vote share for the winner is 78%, coding uncontested candidates as receiving 100% vote share. Table A.2 in the Online Appendix reports these descriptive statistics in full. For comparison, I included the same statistics for US House general elections held during this period, 83% of which had a Republican and Democrat running and only 6% of which were uncontested.
Detainer Requests and Compliance, 2006–15
I also collected data on detainer requests from the Transactional Records Access Clearinghouse (TRAC) at Syracuse University. Their team used Freedom of Information Act requests to acquire data on every detainer request made by ICE and records on whether the subject of the request is ultimately detained. Their data also note the institution that receives the request; the state and county where the institution is located; whether the institution is run by the county, city, state, or federal government; and the month in which the request was sent. I used their database to obtain the number of detainer requests received every month by each institution broken out by whether ICE ultimately detained the individual. I hold out the institutions not run by the county sheriff, such as city jails and state and federal prisons, and aggregated the data to the county-by-year level.
These data highlight the importance of the Secure Communities program. The rollout of the program coincided with a ramp-up from 110,000 requests and 80,000 detainees in 2008 to 201,000 requests and 115,000 detainees in 2011. As federal policy changed to limit detainer request for those not convicted of a crime, the number of detainer requests has dropped. Only 83,000 requests were made in 2014—39,000 resulted in ICE detaining the individual. Figure A.1 in the Online Appendix presents these trends.
These data from TRAC can be further divided by whether the arrestee was convicted of a crime and, if so, how serious the crime was. The seriousness ranges from level 3, which is composed of misdemeanors, to level 1, which captures what ICE calls “aggravated felonies,” including murder, rape, and drug trafficking.
My primary measure of sheriff immigration policy is the rate at which sheriffs comply with detainer requests. I calculate a sheriff’s compliance rate as the share of detainer requests that result in detention. This means that when no detainer requests are made, I do not have a measure for the compliance rate for that county and time period.
I focus on this measure for two substantive reasons and a methodological reason. First, sheriffs are able to manipulate this outcome directly. One of the challenges in previous work studying the behavior of executives is that they often have limited control over outcomes we can easily measure—fiscal policies are often set in part by legislatures, broad economic indicators are likely not immediately responsive to executive choices, etc. By contrast, even offices that receive many requests, resulting in a good measure of the underlying willingness to comply, display considerable heterogeneity in compliance rates. Roughly 20% of sheriffs receiving more than 80 requests comply less than 30% of the time or more than 80% of the time with a standard deviation of 18%. Figure A.2 in the Online Appendix plots the distribution of compliance rates by decile of the number of requests received.
Second, despite considerable media coverage of outspoken sheriffs, most sheriffs do not join in a 287(g) cooperation agreement with ICE or pursue policies that earn them the “sanctuary” label. The compliance rate is a continuous measure that allows to compare sheriffs who do not state a policy publicly with those who do.
I also focused on compliance rates because they do not require any normalization. Most outcomes that a sheriff can affect, such as the number of detainer requests with which they comply or the number of background checks they submit, have an unobserved base rate. Although the causal identification strategy given below ensures that these base rates are equal for Democratic and Republican sheriffs in expectation, the unobserved base rates increase the variance of the estimated difference between Republican and Democratic sheriffs. The compliance rate solves this problem at a cost. The ideal way to normalize the measure of compliance would be to use the expected number of opportunities for ICE to send a detainer request. This is unobservable. Instead, I use the number of requests ICE makes. Because this number could be impacted by strategic choices ICE makes in response to the behavior of the sheriff, it is also an outcome in some sense and could introduce a bias. I am able to check this, and I present these checks along with the results.
Other Ways Sheriffs Can Impact Immigration Policy
The compliance rate is a useful measure of the immigration enforcement policy a sheriff is pursuing because it captures the outcome of an important immigration policy decision sheriffs have the authority to make, it is sensitive to many policies a sheriff can implement, and it has an interpretable scale. However, sheriffs are also able to change policies in ways that impact local immigration enforcement but may not change the compliance rate. I obtained two additional datasets that measure some of these policy outcomes. The first is a dataset on the policies sheriffs say they had toward cooperation with ICE as of 2015, collected by the Immigrant Legal Resource Center. These data were collected over time with some updates after 2015 without a clear note regarding when the policy changed. I treat these policies as though they were active in 2015 for the analysis.
I also collected data from reports ICE made to Congress on the progress of the Secure Communities program. These reports include roughly annual updates on the number of background checks submitted from a particular county, how many identified an unauthorized immigrant, and how many identified people were ultimately deported. These data run from 2012 to 2015.
Regression Discontinuity Design in Sheriff Elections
For the main results, I estimated regression functions of the form:
 $${Y_{ct}} = \mu + \tau De{m_{ct}} + f\left( {{V_{ct}}} \right) + {X_{ct}}\beta + {\varepsilon _{ct}},$$
where Y ct is an immigration enforcement-related outcome in county c and year t. Dem ct is a dummy variable indicating a Democratic sheriff winning the election, and f(V ct) is a flexible function of the running variable, which is the percentage of the two-party vote share going to the Democrat minus 50, so that a 50–50 election is 0 on this scale. I subset the data to cases, where the winner and runner-up are a Democrat and Republican in any order. This means that τ is the effect of having a Democrat elected as the sheriff conditional on a 50–50 tie between a Republican and Democrat. Finally, X ct is a set of controls that I leave out of most specifications but include to increase the precision of treatment effect estimate and as a robustness check.
The key identifying assumption behind this design is that the compliance rate of Republican and Democratic sheriffs would, hypothetically, change smoothly with the Democratic vote share near the 50–50, perfect tie threshold (Imbens and Lemieux Reference Imbens and Lemieux2008; Lee and Lemieux Reference Lee and Lemieux2010). This is a highly plausible assumption. As Eggers et al. (Reference Eggers, Fowler, Hainmueller, Hall and Snyder2015) pointed out, a violation of this assumption would require incredibly good information about voting patterns in the county or illegal vote editing, and this capacity would have to be differential across parties. They also tested this assumption in a large number of American elections, and some outside the United States, and found very little evidence for violations.Footnote 13 A test of this assumption with the data is reported in Table A.10 in the Online Appendix. Although the tests were somewhat noisy, I did not find strong evidence for bias.
Still, even a randomized experiment can have imbalances due to sampling variability. This can happen in an observational setting too. As I mentioned above, I report some estimates with controls, including a flexible function of the lag of the outcome variable, to adjust for any remaining pretreatment imbalances between the potential outcomes at the 50–50 threshold.
When setting up this design, I consider a county in a given year its own experimental unit. The treatment is assigned to a cluster of years for a county based on the statutory term length. Based on this design, the average difference between counties that just barely elect a Democratic sheriff and those that just barely elect a Republican should be zero for all fixed county characteristics. For example, places that just barely elect a Democratic sheriff should include a similar share of rural counties as places that barely elect a Republican sheriff. Further, because the probability of joining Secure Communities early is not a consequence of local political control (Cox and Miles Reference Cox and Miles2013), the share of early adopters should be the same for counties that barely elected a Republican sheriff as for those that barely elected a Democrat.
An important part of estimating the effect in a regression discontinuity design is to make sure that the functional form, f, is appropriate. A bias–variance trade-off arises here, in which one would like to use a flexible functional form, but if the true relationship between the potential outcomes and the running variable is a low-order polynomial, a more flexible functional form could produce an estimate in any given sample that is much further from the true effect. I address this by reporting the results using many functional forms and showing that estimate is robust to changes in the functional form and the subset of the data used to estimate the effect.
RESULTS
Counties Represented by a Democratic and Republican Sheriff Comply with Detainer Requests at the Same Rate on Average
Figure 2 presents a graphical version of the regression discontinuity design. The vertical axis represents a sheriff’s compliance rate with ICE detainer requests in a given year. The horizontal axis is the Democratic sheriff’s share of the two-party vote in the most recent sheriff election. The most striking feature of this figure is how similar the average compliance rate is across electoral environments. Counties in which the Democratic sheriff received around 65% of the two-party vote have a similar compliance rate to counties in which the Democratic sheriff won 35% of the vote. Consistent with this nearly flat relationship, there is almost no difference in average compliance rates at the discontinuity. It is important to note that the variable plotted on the vertical axis here is controlled by sheriffs. Previous work has shown that places that support Democrats at higher levels have more favorable policies toward unauthorized immigrants generally (Gulasekaram and Ramakrishnan Reference Gulasekaram and Ramakrishnan2015; Provine et al. Reference Provine, Varsanyi, Lewis and Decker2016). This plot, instead, shows that the enforcement policies sheriffs choose on their own are relatively similar in more and less Republican-leaning counties.
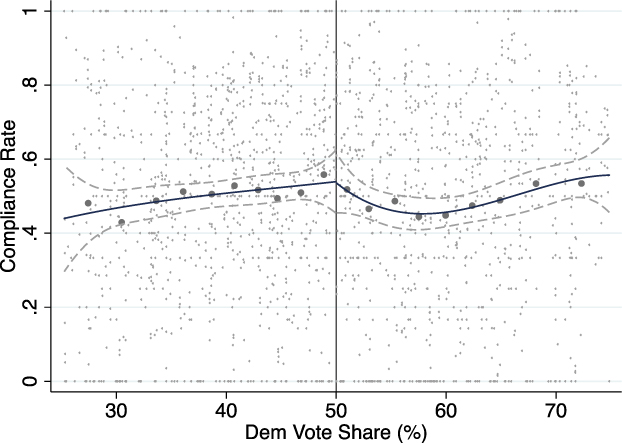
FIGURE 2. Republican and Democratic Sheriffs Comply With ICE Detainer Requests at the Same Rate
Each of the large dots represent binned averages of the underlying data. The small dots are the raw data. The blue line comes from a third-order polynomial regression of compliance rate on Democratic vote share fit separately for counties with Democratic and Republican winners.
Formal estimates of the local average treatment effect are reported in Table 1. The first row presents estimates of the effect using all elections in the specified bandwidth. Columns 1–4 report estimates from fitting a local linear, third-order polynomial, third-order spline, and fifth-order polynomial function of the running variable. In columns 5–8, estimates using the same functional forms as in columns 1–4 are reported, but I also adjust for the county’s compliance rate in the year before the sheriff takes office. The compliance rate is changing throughout the years in the sample, meaning that the relationship between the compliance rate in time t and time t − x is also changing. To address this, I included an interaction between a fully saturated set of dummies for year and election year as well as the election-year compliance rate. The last column reports the treatment effect estimated by the procedure described in Calonico, Cattaneo, and Titiunik (Reference Calonico, Cattaneo and Titiunik2014), which selects a bandwidth that minimizes the mean-squared error of the treatment effect estimator and uses kernel regression with a triangular kernel.
TABLE 1. Effect of Democratic Sheriff on Detainer Compliance Rate

Robust standard errors clustered by election are given in parentheses. The reported estimates come from regressions on the full sample of elections held between a Republican and a Democrat. Spline means that the flexible regression the outcome on Democratic vote share was fit separately on both sides of 0. Year-specific lag DV refers to the inclusion of the lagged dependent variable interacted with a fully saturated set of year-by-election-year dummies. Degree of running variable function reports the largest exponent in the regression function. CCT refers to the method described in Calonico, Cattaneo, and Titiunik (Reference Calonico, Cattaneo and Titiunik2014).
Across specifications, the treatment effect estimates tend to be negative yet close to zero. The first row in column five, for example, reports a two-percentage point lower compliance rate when a county’s sheriff is a Democrat versus a Republican. Returning to Figure 2, note that a large share of counties produce compliance rates above 70% or below 30%. Figure A.2 further shows that even counties receiving many requests have compliance rates outside of that range. A two-percentage-point difference is barely noticeable in the natural variation of compliance rates. Taking the 95% confidence interval of the estimate from my preferred specification, column 7 only includes effects of −10%, which is still quite small relative to the authority sheriffs are granted and the natural variation in the measure. These plausible effects look particularly small when compared with the change in sheriff compliance rate in California from 2013 to 2014 when the state passed a law banning compliance for misdemeanors and encouraging sheriffs to reject more detainer requests. From 2013 to 2014, the compliance rate of California’s sheriffs dropped by 40%, whereas that of sheriffs in the rest of the country stayed roughly the same.
As I described above, the outcome is undefined when the sheriff’s office receives no detainer requests and is therefore coded as missing. If these observations are not missing at random, this could bias the estimates. I conducted an initial check of this by limiting the analysis to large counties because they are, ex ante, more likely to have received at least one detainer request and therefore have a defined compliance rate. These estimates using only large-population counties, which are reported in Table A.11, are noisier but consistent with the estimates from the full sample. I also present estimates in Table A.13 based on alternative transformations of the total number of ICE detentions and reach a similar conclusion.
The large-population county estimates, which are reported in Table A.11, also offer evidence that the partisan gap is similar in small counties and large counties. I draw this conclusion by noticing that the estimates based on large counties alone are similar to these estimates using both large and small counties.
The Number of Detainer Requests Is Not Affected by the Partisanship of the Sheriff
One potential threat to my interpretation is the fact that the denominator in my measure of sheriff compliance is also posttreatment. To see the possible issue, assume that Democrats are in fact less likely to comply with a detainer request. If ICE knows this, they may respond by sending fewer requests, focusing on the requests with which the sheriff will comply. The effect of electing a Democratic sheriff on the compliance rate could be zero in this case, but not because Democratic and Republican sheriffs implement the same policy.
I investigated this possibility by estimating the effect of electing a Democratic sheriff on the total number of requests ICE sends. I normalized this measure of ICE response by dividing by the population as of the 2000 Census. The regression discontinuity design does not require normalization for the estimator to be unbiased, but without it, small changes in the number of requests in large counties could drive the results. On the other hand, a bad choice of normalization factor—one unrelated to the expected number of requests pretreatment—could also introduce noise. Unfortunately, the expected number of requests cannot be directly estimated because it is always potentially subject to a political process. Instead, I chose the most plausible and universally available normalization factor from the Census. The resulting estimates are reported in Table 2.
TABLE 2. Effect of Democratic Sheriff on Number of Detainer Requests per 1,000 Residents
Robust standard errors clustered by election are given in parentheses. The reported estimates come from regressions on the full sample of elections held between a Republican and a Democrat. Spline means that the flexible regression the outcome on Democratic vote share was fit separately on both sides of 0. Year-specific lag DV refers to the inclusion of the lagged dependent variable interacted with a fully saturated set of year-by-election-year dummies. Degree of running variable function reports the largest exponent in the regression function. CCT refers to the method described in Calonico, Cattaneo, and Titiunik (Reference Calonico, Cattaneo and Titiunik2014).
Counter to the concern, I found that the number of requests per capita that the sheriff receives, if anything, increases when a Democrat is elected to sheriff. This result is quite unstable across specifications, however. I suspect the main reason for this instability is the per capita normalization. Because my measure of population is from 2000, prior to all the elections I studied, the normalization factor is constant from year to year for a given county. Accordingly, the columns that add in controls for lagged requests per capita adjust for imbalances due to the normalization factor and are more stable. These four columns imply that ICE sends roughly the same number of requests, regardless of whether the sheriff is a Democrat or Republican. Table A.14 presents estimates of the effect of electing a Democratic sheriff on alternative transformations of the number of detainer requests and reach the same conclusion.
Looking at Figure 1 again, it is clear that there are multiple places in the pipeline from arrest to deportation that could be effected by choices the sheriff or ICE make. I have gathered administrative data on all these and tested the effect of electing a Democratic sheriff on these outcomes using the same regression discontinuity design. In Table A.15, the effect of electing a Democratic sheriff on the total number of background checks a sheriff runs, the number of background checks that result in an immigration database match, and the number of detainer requests with which the sheriff complies is reported. I found that at all other points along the pipeline from arrest to deportation Republican and Democratic sheriffs behave similarly and ICE makes similar choices regardless of the party of the sheriff.
Counties Represented by a Democratic and Republican Sheriff Are Similar Across Other Immigration Policies and Outcomes
In line with the main findings, I found no effects of obtaining a Democratic sheriff on the stated immigration enforcement policies in the county as collected by the Immigrant Legal Resource Center. I estimated the effect of electing a Democratic sheriff on participation in the 287(g) program, contracting out jail beds for immigrant detention, alerting ICE of immigrants, and limits on ICE interrogations in the jail. Some of the estimates are noisy, making large effects, such as a 25% difference in the probability of participating in the program, fall within the 95% confidence interval. But for the two policies with narrow confidence intervals—287(g) participation and detention contracts—the effect is nearly zero. I have included the formal estimates in Table A.17 in the Online Appendix.
Away from Threshold, Convergence Is Similar under a Plausible Alternative Identifying Assumption
The regression discontinuity design presented above is a strategy for identifying convergence in places where the election was a 50–50 tie between a Republican and a Democratic sheriff candidate. This means that the effect is local to places where changing the partisan control of the sheriff office is most likely and where we might be most interested in the returns to changing partisan control of the office. But if electoral pressures are particularly strong at this threshold, we might worry that partisans only converge in a small set of unusual counties and points in time. I explore this electoral pressure mechanism further below, but as a first check of whether the convergence is more general, I estimated convergence using a generalized difference-in-differences design. This design relies on the common trend assumption, which is stronger than the continuity assumption necessary for the regression discontinuity design, but the estimand is a weighted average of convergence for a more general population. The results, reported in Tables A.4, A.5, and A.6, are quite similar to the results from the regression discontinuity design, suggesting that convergence is not unique to the 50–50 threshold.
Convergence Is Similar with and without State Policy
During the period I studied, seven states with partisan elected sheriffs implemented a policy that limited the ability of sheriffs to control the detainer request process.Footnote 14 The implementation dates range from 2007 to 2015, and the policies include changes that make it harder to comply and those making it harder to not comply with a detainer request. These types of policy changes offer an illuminating yet somewhat limited natural experiment: does the difference in compliance rates between Democrats and Republicans get smaller when these policies go into place? I tested this possibility using a triple differences design. I included county fixed effects and year fixed effects, using this to isolate the effect of electing a Democratic sheriff on compliance. I interacted the indicator for a Democrat with an indicator for restrictive state policy and also included those indicators separately. I found that the coefficient on the interaction is 0.01 (s.e. 0.06), with the coefficient on the indicator for a Democrat being −0.03 (s.e. 0.03). The results, which are reported in Table A.18, imply that the effect of electing a Democrat rather than a Republican sheriff is similar regardless of whether the state imposes constraints on the sheriff’s behavior. State policy is most likely not the reason I observe similar compliance rates under Republican and Democratic sheriffs.
Republican and Democratic Sheriffs Appear to Converge in 2017 and 2018
One additional potential threat to interpretation of this result is that nearly all the data come from a single Democratic presidency. If convergence is different based on the president executing immigration law, I may draw incorrect inferences about the drivers of convergence. Data on the number of detainer requests ending in detention are only available through 2015 at the time of writing. Instead, I assessed convergence using two additional datasets: a list of 287(g) sheriff cooperation agreements active in 2018 and a list of sheriffs identified by the Federation for American Immigration Reform as implementing sanctuary policies as of 2018.Footnote 15
The data on policies active in 2018 provide more support for partisan convergence than strong divergence. The estimates of partisan convergence on immigration-related enforcement policy imply that Republican bare winners are somewhat more likely to implement a stricter enforcement policy than a Democratic bare winner, but the estimates are too noisy to rule out complete convergence. To tease out whether the effects are more consistent with convergence or partisan polarization, I run a horse race between two alternative models of sheriff policy selection: one in which policy choice is independent of party, and one in which only Democratic sheriffs select sanctuary policies and only Republican sheriffs join 287(g). Across both models, I hold the share of sheriffs participating in either program constant. I then put these measures together to make an enforcement scale where 1 means participating in a 287(g) agreement, −1 means implementing a sanctuary policy, and 0 means the sheriff does neither. Table A.9 presents estimates of the probability that the effect I estimated arises from the complete convergence model as opposed to the partisan separation model, starting with the prior that both models are equally probable. The probability of complete convergence ranges from 0.48 to 0.78 across regression specifications. This means that while the evidence is not dispositive, if we are choosing between complete convergence and a model of strong divergence, we should favor the model of complete convergence. Altogether, these results do not suggest that sheriffs are taking radically different positions across party in 2017 and 2018.
EXPLANATIONS FOR PARTISAN CONVERGENCE
Why do Democratic and Republican sheriffs choose similar immigration enforcement policies? First, I ask whether the issue of local immigration enforcement is sufficiently split along partisan lines to offer a useful issue for studying the partisan behavior of sheriffs. I found that Democrats and Republicans living in the same counties hold very different views on local immigration enforcement and that legislators from similar districts but opposing parties also cast different immigration enforcement votes in Congress. Next, I asked whether sheriff candidates are unusual members of their parties. I found that although sheriff candidates donate to co-partisans, they hold similar immigration enforcement views across party. This is consistent with an ideologically constrained candidate pool, but not dispositive. Finally, I tested whether this similarity is driven by reelection incentives. I found suggestive evidence that the threat of reelection is not driving these results.
Immigration Enforcement Splits Lawmakers
One important potential explanation for my finding is that sheriffs are just as partisan as legislators, but immigration enforcement is not a partisan issue. The US House provides a nice baseline comparison for sheriffs. A large body of empirical work has demonstrated that members of the US House from different parties vote in markedly different ways even after for adjusting for district tastes (e.g., Ansolabehere, Snyder, and Stewart Reference Ansolabehere, Snyder and Stewart2001; Bafumi and Herron Reference Bafumi and Herron2010; Lee, Moretti, and Butler Reference Lee, Moretti and Butler2004). Is immigration enforcement one of the issues that splits Republicans and Democrats?
I used a regression discontinuity design to test this, comparing the voting behavior of members of opposing parties serving similar, competitive districts. I analyzed roll call votes on four pieces of legislation from 2007, 2012, 2013, and 2017. The issues, described in the appendix, all relate to programs that encourage local cooperation with ICE, either changing funding for them, constraining them, or punishing localities for not participating. Figure 3 presents the graphical results. The formal results are reported in Table A.19 in the Online Appendix.
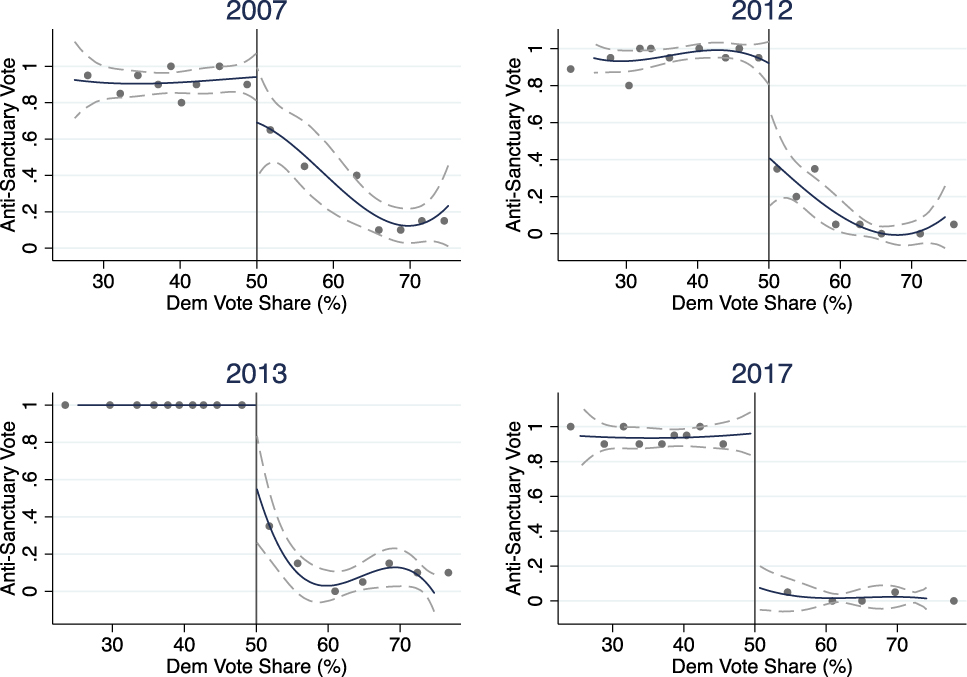
FIGURE 3. The Effect of Democratic House Member on Anti-Sanctuary Votes
Republican members of the US House of Representatives are much more likely to support bills or amendments that punish localities for failing to work with federal immigration enforcement in some way than are their Democratic colleagues. This is true even in districts with nearly identical preferences. The votes in 2007, 2012, and 2013 were amendments to the Department of Homeland Security appropriations bills. The vote in 2017 was on HR 3003, titled the No Sanctuary for Criminals Act.
I found that Democrats are much less likely to support aggressive local immigration enforcement in all four cases. For some of the House votes, a large share of the difference between Republicans and Democrats is explained by local district qualities. But, in all four cases, the party of the member matters even in the identical districts at the threshold between just barely electing a Democrat or Republican. The votes occurred at different times throughout my analysis window and were on different issues. Accordingly, it is difficult to say whether these partisan differences are getting larger or the votes they are taking are focusing more on the areas where the parties differ. Either way, these results rule out the possibility that the national parties have similar positions on local immigration enforcement. And they provide a useful baseline, highlighting the puzzle of sheriffs implementing the same policy regardless of party.
Immigration Enforcement Splits Citizens
Voting patterns in the US House rule out partisan agreement on local immigration enforcement as an explanation for sheriff convergence, but House members are subject to logrolling and strong-arming that may allow members to cooperate and make choices closer to the national party’s preference than their district. Further, immigration preferences may be much more ideologically homogeneous within a county than a congressional district.
To get around these limitations of the US House regression discontinuity design, I estimated within-county partisan differences on immigration policy preferences using the Cooperative Congressional Election Study (CCES). Even compared with other members of their county, Democrats and Republicans respond differently to questions about immigration policy, including immigration enforcement. These differences also persist across census regions. And these differences are similar for counties at the 50–50 tie threshold between electing a Democratic and a Republic sheriff. The average differences for individual survey questions from 2006 to 2016 are reported in Table 3. Differences on measures two and five in the table, reported in columns 2, 5, and 6, are the most relevant here because they ask directly about live immigration law enforcement matters. These within-county differences range from 21%—Midwestern Democrats being more likely to favor a Senate proposal to offer citizenship to undocumented immigrants in 2006—to 58%—Western Republicans being more likely to support police asking anyone about their immigration status as of 2010. In 2016, the CCES repeated a question it asked in 2014 about whether the US government should identify and remove undocumented immigrants, and across both years and regions, Republicans were between 39% and 49% more likely to agree. The last row reports partisan gaps at the RDD threshold of between 32% and 56% across an array of questions demonstrating that if sheriffs were randomly drawn from the full set of co-partisans in their county and implemented their ideal policy, the compliance rate and other policy outcomes should differ based on the political party of the sheriff.
TABLE 3. Differences in Immigration Attitudes by Party Within County
Robust standard errors are given in parentheses. Each row presents the average within-county difference between Democratic and Republican respondents. The first estimate reports the overall average differences, the second set of estimates report the average differences by census region, and the third set of estimates is for counties close to the RD threshold. Each column presents results for a survey measure and survey year. All responses are coded, so that the repose most similar to support for enforcement is 1 and the other response is 0. The measures, in order from one to five, are about citizenship for undocumented immigrants, the ability of police to question people about the citizenship, denial of citizenship to children of undocumented immigrants, prohibitions on hospital care and public school use by undocumented immigrants, and identifying and deporting undocumented immigrants. The regressions are reweighted, so that each county is counted equally rather than weighting the estimates toward places with higher populations. The last set of partisan split estimates are estimated using a regression with a flag for Democratic respondents interacted with a third-order polynomial of the RDD running variable fit separately on either side of the 50–50 tie between a Democratic and a Republican sheriff.
Democratic Sheriffs Donate to Liberal Candidates, Republicans Donate to Conservatives
Even if Democrats and Republicans hold different views on immigration policy within a given county, Democratic and Republican sheriff candidates running against one another could hold similar views. Fourteen states require candidates for sheriff to have prior experience or training in law enforcement. And nearly all elected sheriffs outside of these states have law enforcement experience even where it is not strictly required (Farris and Holman Reference Farris and Holman2017). This sometimes statutory requirement for running limits the pool of possible candidates. It may be that Democrats and Republicans with law enforcement backgrounds have similar policy views across the board based on shared experiences.
The most direct test of broad ideological differences between sheriff candidates of opposing parties suggests that there are meaningful gaps between partisans. I used Adam Bonica’s Database on Ideology, Money in Politics, and Elections (DIME) to understand the political choices sheriffs make in their personal lives (Bonica Reference Bonica2013). DIME uses campaign finance data from the state and federal level to construct a measure of ideology called the CFScore. These data are often used to measure the ideology of candidates by looking at the donations they receive. Instead, I focus on the donations sheriffs make in their personal capacity. I find that the donations Democratic sheriff candidates make earn them CFScores that are different by about two-thirds of the distance between Representatives Nancy Pelosi and Paul Ryan.Footnote 16 The results are similar when I compared all Democratic sheriff candidates with all Republican sheriff candidates rather than comparing sheriff candidates running against one another. These results are reported in Table A.20 in the Online Appendix.
This result comes with two important caveats. First, most sheriff candidates do not make political donations that appear in the DIME. Accordingly, this is only a comparison among candidates who are sufficiently engaged in national or state politics to make a donation and may overstate the degree to which the average Democratic sheriff candidate differs from the average Republican candidate. This analysis also depends on CFScores from sheriff candidates who make only a few donations. The CFScores, then, are quite imprecise for a particular individual. Nevertheless, the donation patterns suggest that sheriffs typically give to state and national co-partisans.
Democratic and Republican Sheriffs Hold Similar Views on Their Role in Immigration Enforcement
The campaign finance-based results suggest that, on a broad set of issues, sheriffs who run as Democrats likely agree with Democrats more often, and likewise for Republicans. This does not necessarily mean that Republican and Democratic sheriff candidates differ in their views on immigration enforcement.
This suggests one additional explanation for convergence that Democrats and Republicans running for sheriff share views on immigration enforcement. Given existing data, I cannot test this directly—no one to my knowledge surveyed sheriff candidates during the period I studied. Instead, I can test the joint explanation that candidate entry and selection together produce a set of candidates who hold similar policy views across party. I evaluated this explanation by reanalyzing a survey of sitting sheriffs conducted in 2012 by Farris and Holman (Reference Farris and Holman2017).Footnote 17
In their survey, Farris and Holman asked sheriffs about their personal views on immigration policy. Two of the questions they asked are similar, although not identical, to two questions asked in the CCES during the same year.Footnote 18 The questions ask whether the respondent approves of increased border enforcement and police inquiring about immigration status. Figure 4 presents the degree to which Democrats and Republicans split on these questions across the two surveys, limiting the CCES respondents to those from counties from which I have a sheriff respondent. I found evidence that sheriffs are more similar across party than non-sheriffs. Although neither of these questions directly addresses detainer requests, the question about police asking people to reveal their immigration status is relevant for the job of sheriff. On this question, the average share of Republicans supporting the policy by county is nearly 50% greater than the share of Democrats. Among sheriffs that difference is less than 10% and cannot be distinguished from zero, given sampling variability. Most of the difference in this gap is driven by Democratic sheriffs holding more conservative views on immigration than their co-partisans in the public rather than Republican sheriffs holding more liberal views.
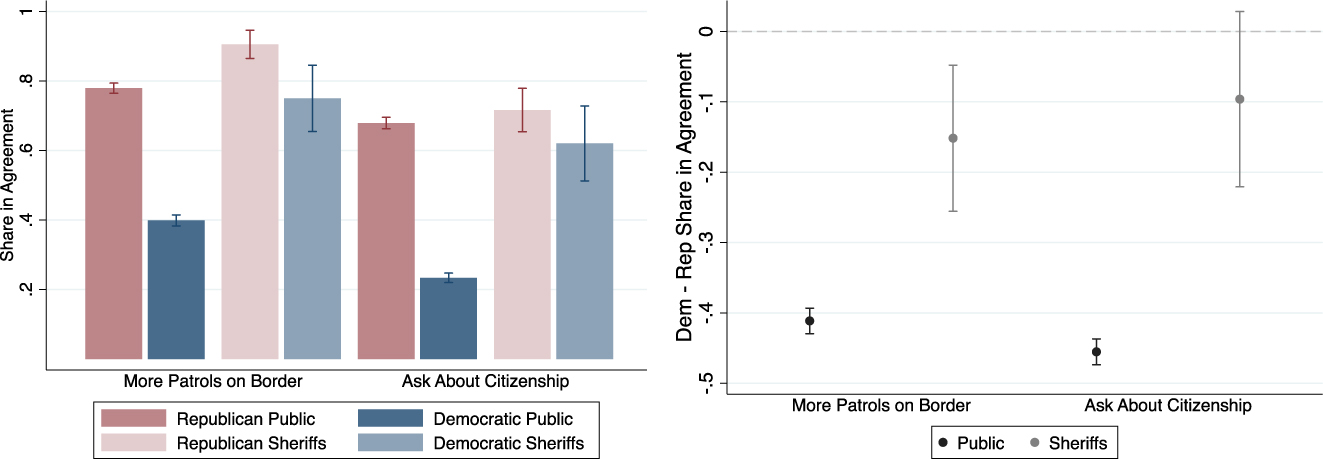
FIGURE 4. Smaller Partisan Differences Among Sheriffs Than Public
In surveys fielded in the same year and asking similar questions, sheriffs responded in a more similar way across party than members of the general public living in the same counties as the sheriffs. The surveys asked whether the respondent approves or disapproves of increased border enforcement and police asking about immigration status. The partisan split is larger on police-specific activities for the general public and smaller for sheriffs.
The pattern of responses across the two surveys suggests that sheriffs from different parties are more likely to agree on immigration policy than randomly selected citizens from opposing parties. Sheriffs are particularly likely to agree on an immigration enforcement matter directly relevant to their job. These results do not necessarily imply that the convergence in compliance rates is mostly a function of the types of people who become sheriff—sheriffs could be stating their public policy position when responding to the survey, and these positions could be impacted by their interests in reelection. But, given the anonymity of the survey, it is the best evidence supporting the joint entry and selection mechanism. It appears that despite likely having different political views on many other issues, people who gain the Democratic nomination as sheriff have similar views on the sheriff’s role and authority in immigration enforcement as do those who win as Republicans.
Convergence Is Similar When Facing Term Limits
The sheriff survey was conducted by interviewing sitting sheriffs. Most of those sheriffs are likely to run for sheriff again. Are the survey and the compliance rate results a consequence of these sheriffs pursuing a policy position that gets them reelected?
A key prediction of the Fearon (Reference Fearon, Mann, Przeworski and Stokes1999) model of electoral accountability is that, if an elected official is ideologically distant from the median voter, she will moderate to win reelection but will not moderate when she faces no threat of removal from office. Further, if local officeholders, subject to Tiebout competition (Tiebout Reference Tiebout1956)—or some other office-specific pressure, including those described by Williamson (Reference Williamson2018)—pursue policies that maintain a tax base because it sends a valence signal to voters for reelection (e.g., Ashworth Reference Ashworth2012), we should expect divergence when they no longer face reelection. In four states, sheriffs are limited to a certain number of terms in office.Footnote 19 Using a number of different panel regression specifications, I compare convergence with and without reelection incentives in place. The results are reported in Table 4.
TABLE 4. Effect of Dem Sheriff on Compliance Rate, Term Limited versus Non-Term Limited Sheriffs
Robust standard errors clustered by county are given in parentheses. The reported estimates come from counties with sheriff term limits in Colorado, Indiana, and New Mexico.
Given the limited number of cases, the evidence is quite noisy. My approach also does not isolate the causal effect as cleanly as a fully within-candidate design (Fouirnaies and Hall Reference Fouirnaies and Hall2018). I am unable to completely rule out the possibility that electoral sanction is responsible for the convergence. But recall the size of the difference between partisans in the public on immigration policy questions, the large difference in voting patterns on immigration enforcement between Democrats and Republicans in the US House, and the 40-percentage-point drop in compliance rates among California sheriffs from 2013 to 2014. The upper bound implied by the 95% confidence intervals for all four of the estimates in Table 4 are not quite large enough to explain the difference between the preferences of sheriffs and their co-partisans in the general public.
CONCLUSION
In February 2018, Attorney General Jeff Sessions went before a gathering of the National Sheriffs’ Association, telling them “[t]he most important thing that any government does is keep its citizens safe. The first civil right is the right to be safe. Too often, politics gets in the way of that mission.”Footnote 20 His concern is broadly held, as many worry that local governments will pursue policies elected officials prefer or that are politically expedient rather than those that keep their community safe and cause the least harm. Many on the right point to sanctuary policies, whereas many on the left point to historic rates of incarceration, both as examples of political interference in the administration of justice.
In this paper, I ask whether the party that controls the office administering justice influences law enforcement behavior. Many law enforcement decisions are hard to observe or made jointly by many institutional actors. It is also difficult to distinguish the effect of political control from other peculiarities in the local politics. I focus on a case in which a sheriff has given considerable discretion and all the decisions were recorded. And I use a regression discontinuity design to isolate the independent effect of electing a Democratic rather than Republican sheriff. I find that Democratic and Republican sheriffs make remarkably similar choices regarding whether to comply with a federal request to detain an unauthorized immigrant.
This result runs contrary to the expectations we would have from reading the work on legislative voting patterns. I demonstrate this directly by showing that Democratic and Republican members of Congress from identical US House districts vote for quite different immigration enforcement policies once in office.
I investigate two possible explanations for why local law enforcement might be different. First, I ask whether the types of people who become sheriff are different from their co-partisans. I find evidence that although sheriffs who win as Democrats likely hold more liberal views generally and Republicans likely hold more conservative views, winning Democratic and Republican sheriffs hold similar views on immigration-related law enforcement matters. Second, I do not find support for the claim that sheriffs converge under electoral pressure. These results are consistent either with a different set of people running to be sheriff and with elections favoring people within a narrow range of views, highlighting the role of candidate entry and selection over reelection incentives.
Going forward, an important question this paper leaves open is exactly what policy the candidate selection process produces.Footnote 21 A number of roles in local government, particularly in the criminal justice system, require special expertise or draw out particular types of candidates. My results point toward this entry and selection process as a constraint on partisanship in the administration of justice. But this constraint may also result in law enforcement and criminal justice officials that are less sensitive to the needs of their community.
SUPPLEMENTARY MATERIAL
To view supplementary material for this article, please visit https://doi.org/10.1017/S0003055419000613.
Replication materials can be found on Dataverse at: https://doi.org/10.7910/DVN/CFASH6.


Comments
No Comments have been published for this article.