Published online by Cambridge University Press: 01 August 2014

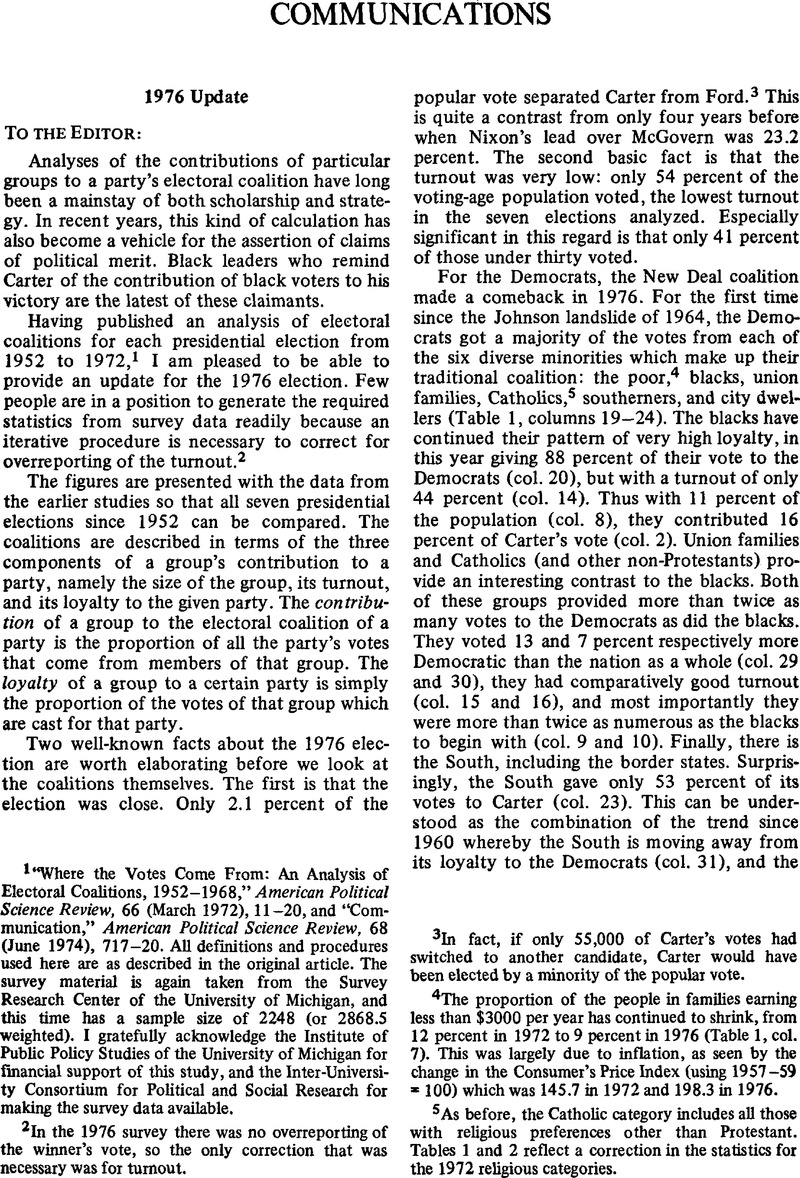
1 “Where the Votes Come From: An Analysis of Electoral Coalitions, 1952-1968,” American Political Science Review, 66 (03 1972), 11–20Google Scholar, and “Communication,” American Political Science Review, 68 (June 1974), 717–20. All definitions and procedures used here are as described in the original article. The survey material is again taken from the Survey Research Center of the University of Michigan, and this time has a sample size of 2248 (or 2868.5 weighted). I gratefully acknowledge the Institute of Public Policy Studies of the University of Michigan for financial support of this study, and the Inter-University Consortium for Political and Social Research for making the survey data available.
2 In the 1976 survey there was no overreporting of the winner's vote, so the only correction that was necessary was for turnout.Google Scholar
3 In fact, if only 55,000 of Carter's votes had switched to another candidate, Carter would have been elected by a minority of the popular vote.Google Scholar
4 The proportion of the people in families earning less than $3000 per year has continued to shrink, from 12 percent in 1972 to 9 percent in 1976 (Table 1, col. 7). This was largely due to inflation, as seen by the change in the Consumer's Price Index (using 1957—59 = 100) which was 145.7 in 1972 and 198.3 in 1976.Google Scholar
5 As before, the Catholic category includes all those with religious preferences other than Protestant. Tables 1 and 2 reflect a correction in the statistics for the 1972 religious categories.Google Scholar
6 The 1976 party identification figures are 40 percent Democrat (the same as 1972), 23 percent Republican (down two percent since 1972), and 29 percent independent (up one percent). The debate about the relationship between party identification and vote is an active one. See for example Arthur H. Miller et al., “A Majority Party in Disarray: Policy Polarization in the 1972 Election,” American Political Science Review, 70 (09 1976), 753—78, and the following comments and rejoinder.Google Scholar
Comments
No Comments have been published for this article.