In 2012, both Kiplinger Business Forecast and Forbes ranked anthropology and archaeology as the worst choice of college majors, with an unemployment rate of 10.5% and a median salary of $28,000 for recent college graduates (Dewey Reference Dewey2012; Goudreau Reference Goudreau2012). More recently, in their 2016–2017 forecast, Kiplinger ranked anthropology as the fifth worst college major (Rapacon Reference Rapacon2017). Kiplinger reports 8,255 anthropologists and archaeologists are currently employed in the discipline, which is slightly higher than the approximately 7,700 listed in the 2015 US Department of Labor Outlook Handbook (US Department of Labor 2015). Kiplinger further reports that there are approximately 920 online job postings annually for the roughly 12,000 anthropology degree holders, both undergraduate and graduate, who graduate each year. In other words, there are jobs available for fewer than 8% of graduates seeking employment within their field of study (Rapacon Reference Rapacon2017).
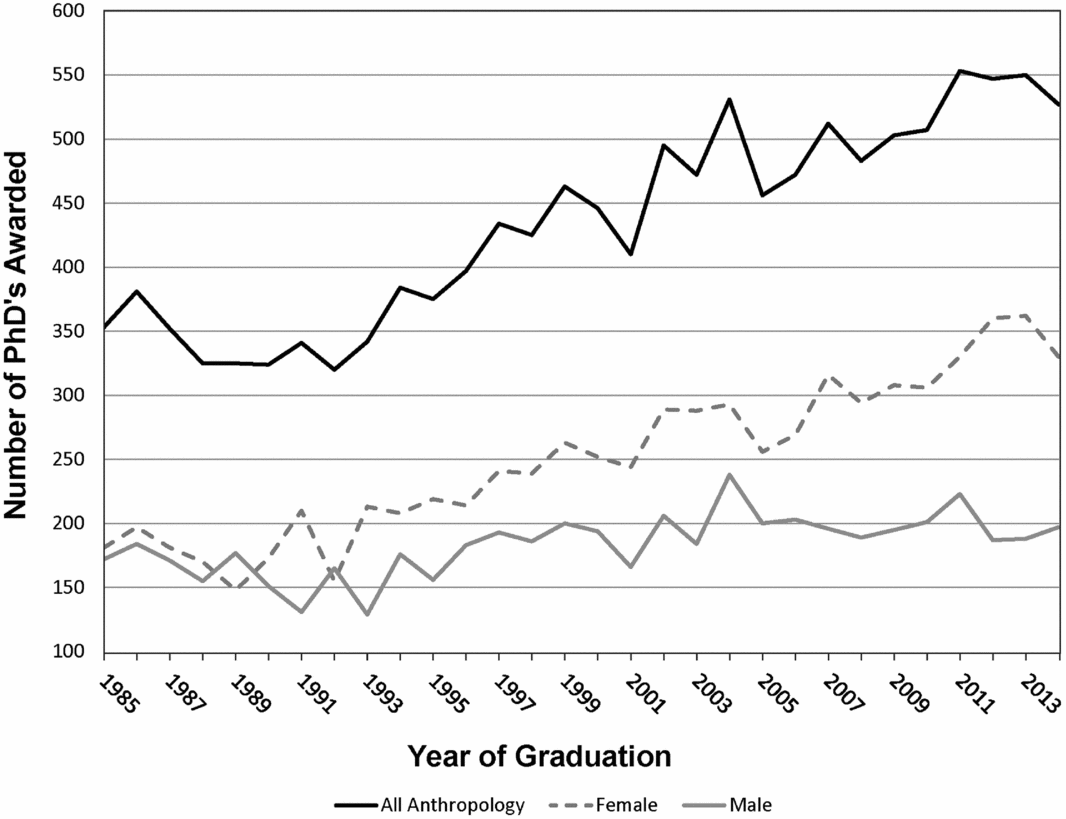
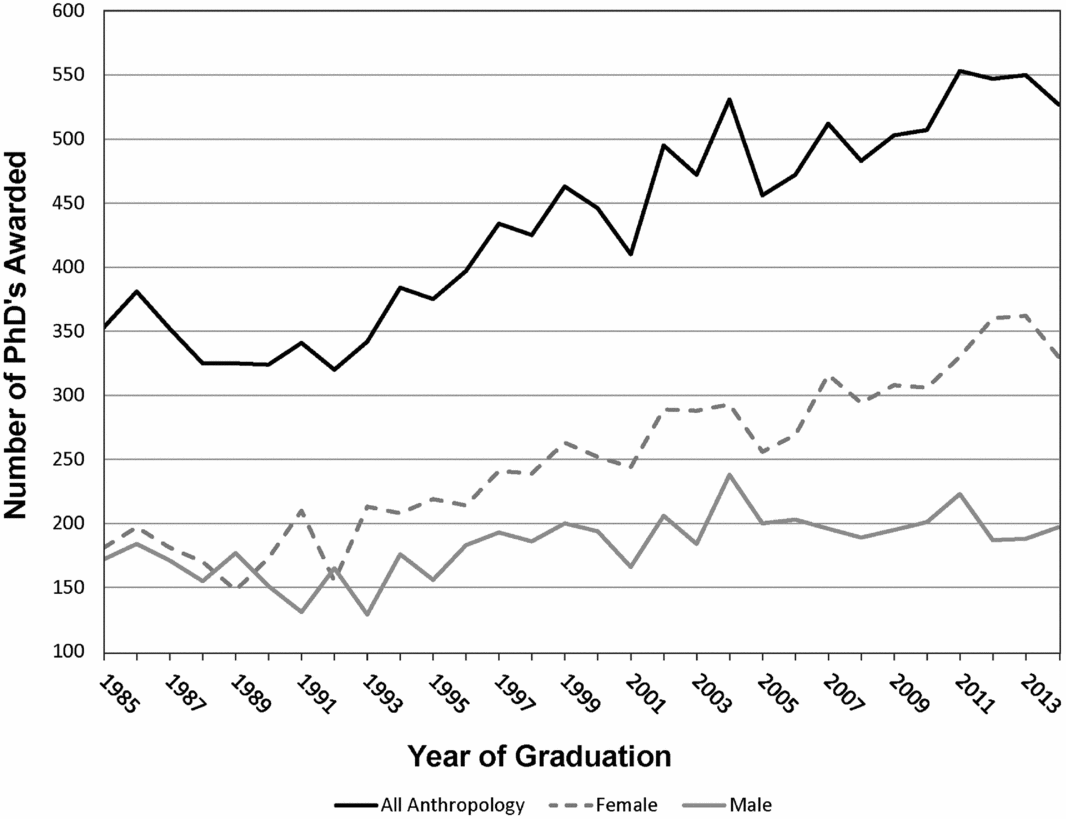
Increased competition in the anthropology and archaeology job markets has undoubtedly contributed to the increase in graduate school applications to North American anthropology programs, as early career anthropologists seek advanced degrees in order to improve their job prospects. Since the late 1980s, the number of doctoral degrees awarded by US anthropology departments has increased by 70%, from approximately 325 to almost 550 per year (Figure 1; National Science Foundation 1995, 2006, 2015). During this same period, the number of female doctorates has increased to the point where there are now two female doctoral graduates in anthropology for every male (Figure 1, National Science Foundation 1995, 2006, 2015). However, for the subdiscipline of archaeology, an advanced degree does not necessarily lead to a better job. Those fortunate enough to hold academic positions in our chosen field realize that few of our graduate students are likely to obtain a faculty position themselves. In today's highly competitive academic job market, it is common to have large numbers of qualified applicants competing for a given position. Of the 9,558 doctoral students who received anthropology degrees in the US between 1995 and 2014 (National Science Foundation 1995, 2006, 2015), approximately 20% obtained tenure-track faculty positions in anthropology, based on information published in the 2014–2015 American Anthropological Association (AAA) AnthroGuide.
Academic employment challenges are not limited to anthropology and archaeology. Multiple studies have detailed the myriad issues surrounding employment for history, English, and other doctoral graduates in social sciences and the humanities (e.g., American Academy of Arts and Sciences 2015; Dunn Reference Dunn2015; Warner and Clauset Reference Warner and Clauset2015). In the biological sciences, the outlook is not any better. A recent study by Ghaffarzadegan and colleagues (Reference Ghaffarzadegan, Hawley, Larson and Yue2015) determined that 84% of new doctoral graduates in biological and medical sciences are not successful in landing a tenure-track academic position. The American academic system generates “progeny” at a rate greater than the job market can support (e.g., Gould Reference Gould2015:22; Larson et al. Reference Larson, Ghaffarzadegan and Xue2014; Schillebeeckx et al. Reference Schillebeeckx, Maricque and Lewis2013). Recent graduates seeking academic positions often find themselves in lengthy and insecure postdoctoral research positions (Powell Reference Powell2015), or a seemingly endless series of lecturer/instructor positions or adjunct tracks. There is little institutional incentive to replace these low-paying, temporary appointments with higher-paying tenure-track positions (Gould Reference Gould2015:23; Powell Reference Powell2015:144). The reality is that, for most recent doctoral graduates, the job market––especially the academic job market––is bleak.
There are more than 100 anthropology and archaeology doctoral programs in the US and Canada, and we all know they are not equal. Prospective graduate students must consider many factors in selecting a graduate program, including department rankings, “fit” of interests, and financial support (e.g., Kintigh Reference Kintigh2004). Previous studies focusing on American anthropology as a discipline and a career path relied largely on surveys of student or alumni satisfaction/perceptions (e.g., Zeder Reference Zeder1997a, Reference Zeder1997b). Here, we examine data reported from the hiring institutions themselves to
-
1) identify the doctoral programs whose graduates have been most successful in the academic job market;
-
2) identify long-term and ongoing market-share trends in the programs producing doctoral degrees; and
-
3) evaluate gender division in academic archaeology in the US and Canada.
As our primary source of data, we used the 2014–2015 AAA AnthroGuide. Data in the AnthroGuide are self-reported, and include general information about departments, such as degrees offered and program descriptions, as well as information about their faculty, including academic rank, specialization, and year and origin of the doctoral degree. These data demonstrate that a handful of anthropology departments hold a majority of the academic market share—which we define as the percentage of tenured/tenure track positions in US and Canadian anthropology and archaeology academic departments that are attained by graduates of a specific program over a given period of time. For prospective doctoral students, this means that getting a degree from the right department could be a critical first step in initiating an academic career track.
Methods
The AAA has published the AnthroGuide annually since 1962; it provides information on a broad range of anthropological institutions such as university departments, museums, and non-profit organizations. As each institution provides their own information for inclusion in the AnthroGuide, the volume is not an exhaustive survey of all anthropological institutions (American Anthropological Association 2016). However, most BA/BS, MA/MS, and PhD degree-granting US and Canadian institutions are represented in the guide.
For the purposes of this study, we analyzed data from degree-granting anthropology and, in rare cases, archaeology programs in the US and Canada only; museums, research institutes, nonprofits, and other organizations were not included. For each degree-granting institution listed in the AnthroGuide, we recorded data for individuals listed as “faculty.” Faculty are generally considered to be tenure-track individuals who hold the title of “assistant,” “associate,” or “full” professor; however, some departments list individuals in permanent, non-tenured/non-tenure-track teaching positions as faculty. In many cases, it appears that these are individuals who graduated from that department or who received positions via special hiring consideration (e.g., spousal hires). Information for people classified as anything other than “faculty” was not included in our database. These include categories such as lecturer, staff, post-doc, research staff, adjunct, affiliated, emeritus, or anthropologists in other departments.
Relevant information for each individual recorded in our database included the following: first and last name, employment institution, graduate institution, year of graduation, subfield of expertise, apparent gender, highest degree offered by the employing institution, and current academic rank. The subfield of expertise was recorded based on research interests listed in the AnthroGuide and faculty pages when interests in the guide were left blank or if clarification was needed. For the purposes of this paper, individuals identified as archaeologists and bioarchaeologists are combined into a single category—archaeologist. The rationale for combining bioarchaeologists (as defined by Buikstra [1977]: the scientific study of human remains from archaeological sites) and archaeologists into a single category is that we view bioarchaeology to be an integral part of archaeology in the same manner that zooarchaeology, paleobotany, geoarchaeology, and other forms of archaeological science are part of archaeology.
Apparent gender was based on our perception of an individual's first name as listed in the AnthroGuide, and verified, when an individual's name was gender-neutral or ambiguous, through faculty webpages or other online resources. Academic rank categories we recorded include assistant professor, associate professor, full professor, and “other” when a different title/rank was listed and the individual was listed as a faculty member.
Individuals with foreign degrees (i.e., non-US or non-Canadian) represent a substantial portion of our academic archaeological population (~5.4%). Although we recorded the institution these individuals graduated from, for discussion purposes we classify all non-US and non-Canadian-derived degrees as “foreign.”
Some colleges and universities have separate anthropology and archaeology programs. We report information for these rare instances for the university as a whole, rather than listing them separately. Additionally, faculty employed within the City University of New York (CUNY) system are sometimes cross-listed with several CUNY colleges (e.g., Hunter College, John Jay College, and/or Herbert H. Lehman College). For purposes of this study, the entire CUNY system is considered as a single entity.
As with any study of this nature, there are several limitations and inherent assumptions:
-
1) We can see only the end-result of the hiring process—who was hired, and where. We cannot account for differences in the quality and/or gender of applicants applying for academic positions in US and Canadian anthropology departments.
-
2) The nature of our data limits us to a synchronic view of those who held a faculty appointment in a US or Canadian anthropology department during the 2014–2015 academic year. We do not know how long a person has been employed at that particular department, how long they were on the job market, or how many previous academic positions they may (or may not) have had.
-
3) The AnthroGuide does not include two-year colleges and technical schools, which are therefore absent from our dataset. We recognize that many such schools employ both PhD- and MA/MS-level anthropologists and archaeologists. However, the reality is that these positions are often low-paying, have high course-load teaching requirements, and/or are rarely tenured or tenure-track.
-
4) The number of doctorates produced each year by individual institutions is unknown. Institutions that confer larger numbers of doctoral degrees will potentially have a competitive advantage in terms of market share. Admittedly, some of these numbers are available via the ProQuest Dissertations & Theses Global database, but coverage varies by university. For example, we determined that between 2010 and 2017, the University of Michigan awarded about 90 dissertations in anthropology and archaeology (both anthropological and classical), but the same search for the University of Georgia yielded no results (which we know to be incorrect).
-
5) We do not attempt to, nor can we account for, doctorates working outside academia in the US or Canada (e.g., industry, government, museum, NGOs, etc.) or anthropology doctorates who are faculty in non-anthropology departments or who have found academic employment in countries other than the US or Canada. Our focus here is solely on faculty positions in anthropology departments in the US or Canada.
-
6) We can assume that a greater proportion of applicants for tenure-track positions should be female, given that there is a higher proportion of female doctoral graduates in anthropology as a whole, but it is also possible that fewer women choose to pursue an academic job track or that they are systematically biased against in the hiring process.
-
7) There is an inherent assumption that anthropology/archaeology faculty have doctoral degrees in anthropology/archaeology; this is not always the case. Some archaeology faculty may have a doctoral degree from a geoscience program, a humanities-based archaeology program, or even a general studies program. These individuals are rare, but explain why in a few cases we have listed a university as having conferred a doctoral degree when the institution does not have a doctoral program in anthropological archaeology or bioarchaeology (e.g., Duke).
-
8) Not every academic program in the US and Canada reported data for the 2014–2015 AnthroGuide. Departments not listed in the AnthroGuide include University of North Carolina at Chapel Hill (UNC), University of California Berkeley, University of Illinois at Chicago (UIC), University of California Santa Cruz (UCSC), and the Boston University (BU) Archaeology Department. Early in our study, we recognized that Berkeley and UNC were noticeably absent, and we added them to our database using information published on their respective departmental websites. The absence of UIC, UCSC, and BU was not noted until completion of our study. Consequently, data for archaeologists and bioarchaeologists (ca. 25) employed in these three departments are not included in the study. It is possible that other institutions were missed as well.
Results
As a first step in examining the data, we compiled a table (Supplemental Table 1) in which we tabulated total market share for archaeologists for each of the approximately 110 different US and Canadian universities (as well as dozens of foreign institutions) that have (or had) doctoral programs. We then subdivided the information for each department into five categories based on the year a faculty member received their degree. These include degrees conveyed prior to 1974 (n = 41), and dissertations completed between 1974–1983 (n = 177), 1984–1993 (n = 260), 1994–2003 (n = 321), and 2004–2014 (n = 287). Although the final category (2004–2014) is technically an 11-year period, rather than the 10-year increments used for the three previous categories, only 11 people who graduated in 2014 are listed in the 2014–2015 AnthroGuide as having faculty positions. (In an ideal study, we would compare total numbers of graduates per institution to numbers of graduates who obtained faculty positions in order to calculate indices of percent success for a given institution.) We then tabulated doctorates completed between 1994 and 2014 (n = 608) and sorted the 20-year total from highest to lowest. We then ranked each university based on their cumulative 20-year market share. These rankings are summarized in Table 1. Tier 1 represents 11 universities (includes the foreign degree category) that had ≥ 15 placements. Tier II includes 9 universities that had 10–14 individuals who were successful in obtaining faculty positions. Tier III comprises 21 universities with 6–10 placements. Tier 4 includes 22 universities with 3–5 graduates placed in faculty positions. Tier V accounts for 24 universities with 1–2 graduates successful in landing a faculty position. Finally, the Tier 0 category denotes the 23 universities that had no anthropology faculty job placements in the past 20 years. It is important to note, however, that many of the lower-ranked programs, including some listed in Tier 0, are relatively new (e.g., past 20 years) and that the low rankings for these programs are not as informative as rankings for older and more established programs.
Table 1. Summary Statistics for Ranking and Placement Averages for Programs.

a Includes foreign-derived degrees lumped as a single category.
Twenty universities (Tiers I and II) account for more than 56% of the total market share over the past 20 years, with Tier I universities averaging 1.1 doctorates placed per year and Tier II universities averaging 0.56 placements per year (Table 1 and Supplemental Table 1). Lower-ranked programs are placing people on average at a rate of one individual every 3 years (Tier III), one every 5 years (Tier IV), or one person every 14 years (Tier V). Considering that Tiers IV, V, and 0 account for 69 universities (63% of the total), yet have only 19.3% of the total market share, potential graduate students should understand that, although there are many choices for graduate school, the harsh reality is that attending a lower-ranked school has serious ramifications in terms of getting an academic position.
We also looked at two groups of doctorates: those who graduated between 1994 and 2003 (n = 321) and those who graduated between 2004 and 2014 (n = 287). Using the Tier categories defined above—which describe market share, not the real or perceived quality of a graduate program (although arguably these variables are correlated)—we plotted where archaeologists originated, and where they ultimately obtained a faculty position (Figure 2). It is clear from the two time periods examined that where an individual obtains their doctoral degree greatly influences where they become employed. With the exception of schools that only offer BA/BS degrees, Tier I graduates dominate all categories for the period 1994–2003. Interestingly, for the period 2004–2014, people with faculty positions at Tier I universities are distributed relatively equally among individuals who originated from Tier I–IV universities. Although we have no means by which to evaluate people who were successful in obtaining positions at Tier I schools, it appears that Tier I universities hire candidates based on merit rather than where they obtained their doctoral degree. In contrast, Tier II–V university hires are dominated by Tier I candidates. Finally, individuals who originate from Tier V schools are not successful in obtaining Tier I or II faculty positions and are generally more successful in finding employment at Tier V, MA/MS, and BA/BS schools.
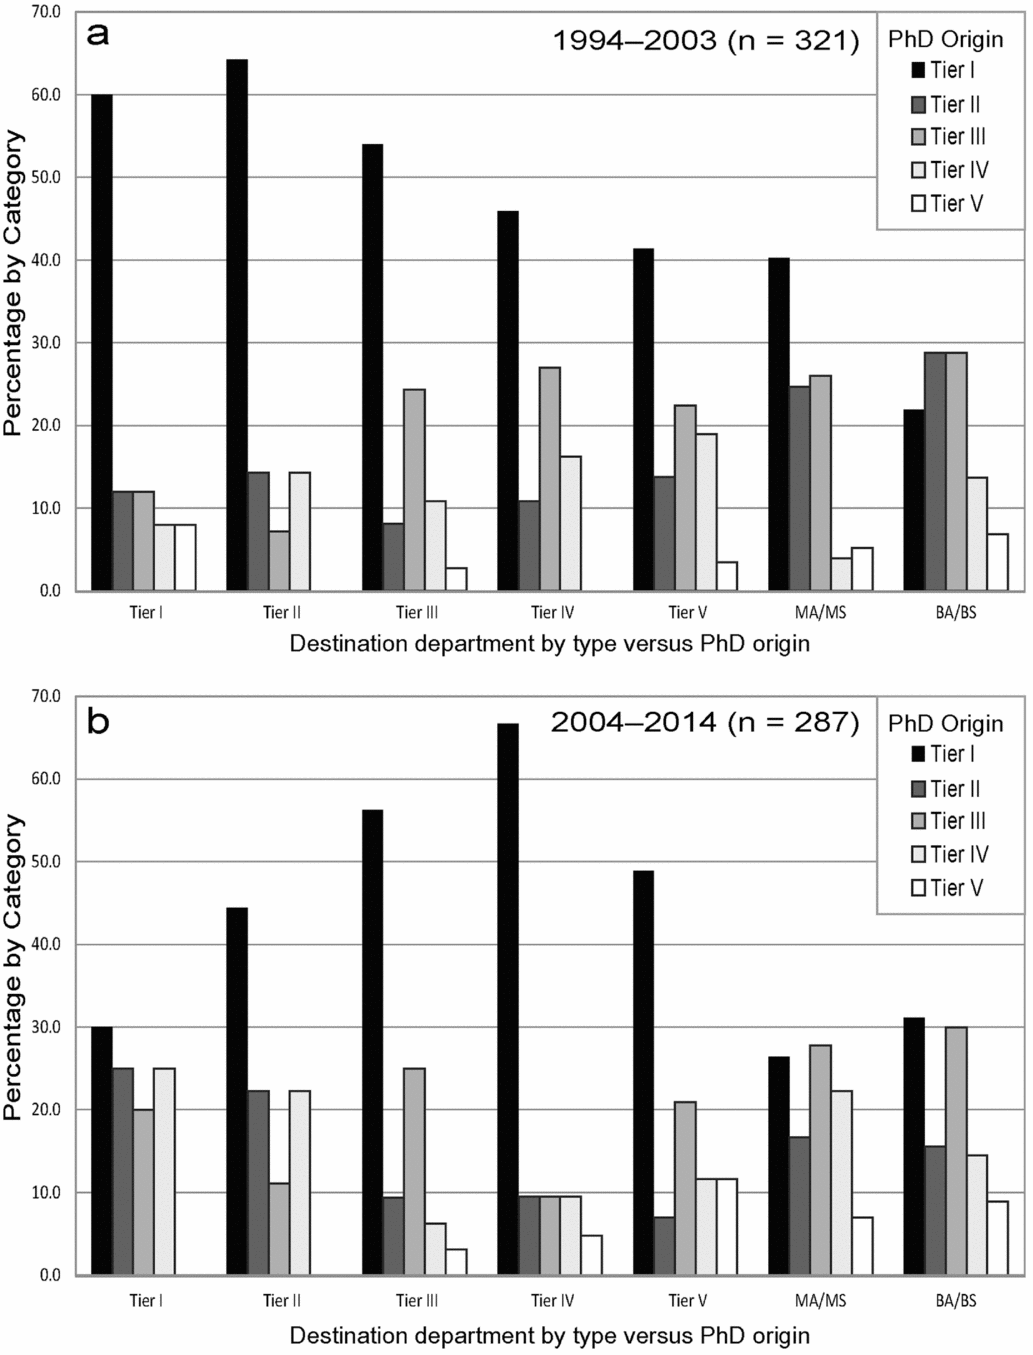
Figure 2. Comparison of doctoral degree origin versus the destination department (where the individual is ultimately employed) for (a) 1994–2003 and (b) 2004–2014.
As a final exercise, we examined differences in gender in hiring practices for the same two groups of archaeology doctorates: those who graduated between 1994 and 2003 (n = 321) and those who graduated between 2004 and 2014 (n = 287; Figure 3). For this analysis, we collapsed Tiers III–V into a single category. In the earlier period (1994–2003), women were hired more often than their male counterparts in Tier I and II positions, whereas men were hired more frequently into faculty positions at Tier III–V, MA/MS, and BA/BS schools. In the more recent period (2004–2014), men were hired more frequently than women at doctoral degree-granting institutions (Tiers I–V). At MA/MS institutions, men and women appear to be hired at equal rates. At BA/BS schools, women are employed at higher rates than men. It is not possible to accurately address the root cause for these differences. The reality—regardless of the root cause—is that between 2004 and 2014 men were being hired more often and into better-paying positions than their female counterparts.
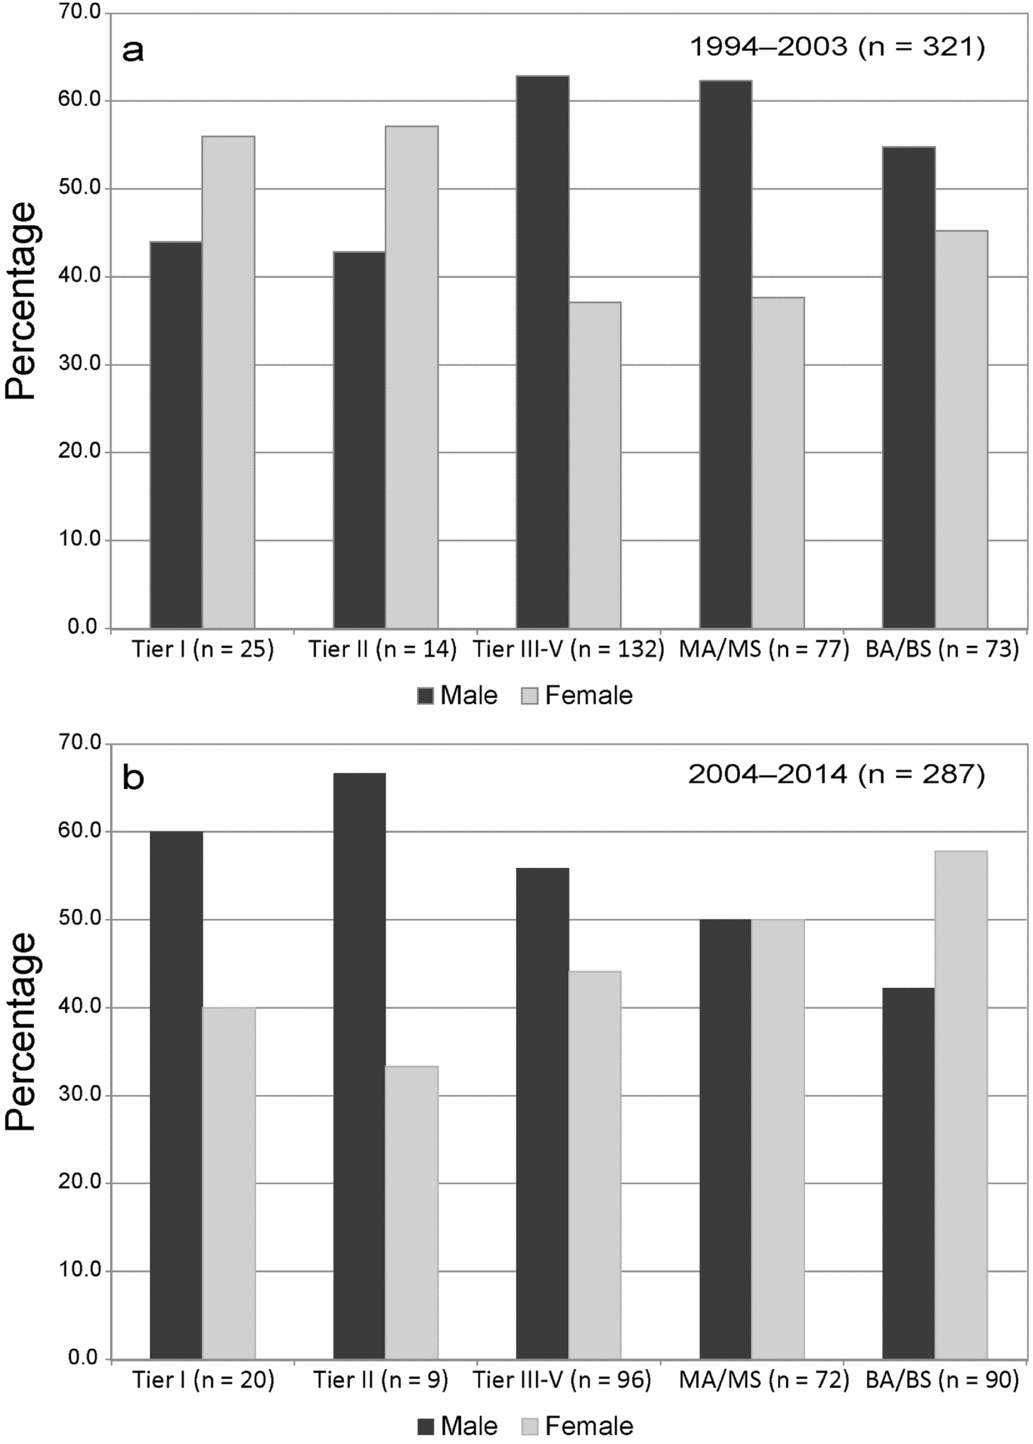
Figure 3. Comparison of men versus women hired by destination department (where the individual is ultimately employed) for (a) 1994–2003 and (b) 2004–2014.
Discussion
Why is all of this important? Obviously, it is exceedingly difficult to obtain a faculty position. And the reality is that there are far too many doctorates being produced by anthropology (and other social science and humanities) departments across North America. The number of people applying for faculty positions on an annual basis far exceed the number of positions available. It is a problem that is equivalent to compounding interest on a loan. For example, if there are 100 doctoral archaeologists who graduate every year for 10 years who are intent on getting a faculty position and there only 20 jobs available per year, then by the end of 10 years, there are literally as many as 800 archaeologists (assuming that none have left the job market) potentially applying for 20 faculty positions. There is simply no way that such a scenario is feasible long-term—yet this scenario is not far from reality. As shown in Figure 1, there has been a steady increase in the numbers of anthropology doctorates over the past 30 years. Although a small fraction of these individuals have found faculty employment in departments that have recently initiated doctoral degree programs or in extant programs that have expanded their faculty, anthropology programs cannot keep pace with potential job seekers.
Based on NSF data (National Science Foundation 1995, 2006, 2015), we know that between 1995 and 2014, 9,958 anthropology doctorates (all subfields) were conferred in the US. Based on information in our database, we know that in 2014–2015, 1,911 US anthropology doctorates were employed as faculty in the US (per the 2014–2015 AnthroGuide and exceptions noted above). That is a faculty employment rate of roughly 20%, for those who graduated since 1995. We could quibble about this number and argue that faculty from AA/AS colleges and a few other schools are not considered because they are absent from the AnthroGuide. Additionally, some programs focus on doctoral training for foreign nationals from Latin America, Africa, and/or Asia who then return to their country of origin to pursue academic positions. Nonetheless, it is apparent that only about 1 in 5 US/Canada-derived anthropological doctorates is successful in obtaining a faculty position in a US or Canadian anthropology department. To compound the situation, US doctorates face competition from individuals (both US citizens and foreign nationals) who earned doctoral degrees outside the US and in some cases from individuals who earned their degrees from humanities, geoscience, and/or biology programs. The data show that 6.1% of the market share for people who graduated between 1994 and 2014 earned their doctoral degrees in countries other than the US and Canada. Approximately two-thirds of these individuals have expertise in some aspect of archaeological science, such as bioarchaeology, geoarchaeology, zooarchaeology, and molecular archaeology. We would further speculate that many of the individuals with foreign-derived doctoral degrees were successful, in part, because their graduate training and/or dissertation research provided them with an opportunity to develop expertise in archaeological science—something that the US has yet to fully embrace (Killick and Goldberg Reference Killick and Goldberg2009).
It is not just about being among the 20% or so of all archaeology doctorates who are successful in obtaining a faculty position; it is also about getting the right position. Admittedly, a position at a lower-tier university is certainly better than being among the numerous unemployed/under-employed doctorates. Just as one might argue that there is a positive correlation between our tier rankings and real/perceived quality of a graduate program, there likewise is a correlation between lifetime earning potential and the type of university that one eventually lands at. Although not true in every case, BA/BS and MA/MS programs at public schools tend to pay faculty much lower salaries than faculty employed at Tier I and II public universities (refer to the American Association of University Professors annual faculty compensation survey database [Inside Higher Ed 2016]). Likewise, top-ranked private schools (i.e., Carnegie A and B) tend to pay higher salaries than comparable public universities (Flaherty Reference Flaherty2016; Rippner and Toutkoushian Reference Rippner and Toutkoushian2015). There are other factors to consider as well—faculty employed in higher-tiered programs typically have a reduced teaching requirement and more emphasis on primary research as compared to those at lower-tiered and MA/MS and BA/BS programs. They also have better access to research support and funding as well as access to more (and potentially better) graduate students.
Given this information, how then does one choose a graduate program? In part, the obvious answer—if one aspires for an academic position—is to choose a department that dominates a large portion of the market share (i.e., our Tier I and II schools). The numbers presented for Tier I and II schools are important given that faculty from these institutions build network, reputation, and expectation; and, of course, they add potential votes for candidates from one's institution. However, the numbers presented in Table 1 and Supplemental Table 1 do not tell the whole story given that a small program might produce relatively few doctorates, but have high success in placing those graduates into faculty positions.
In addition, there are a number of programs in the Tier III and IV categories that show a clear trajectory of growth in placing graduates in academic positions. Conversely, there are others, even in the Tier I and II categories, that show a decline. Choosing a “rising” program might serve graduates well, as the “buzz” around such programs, generated by cutting-edge research and new discoveries, can potentially provide a competitive edge. We also acknowledge that the standing and reputation of graduate advisors play a key part in academic success. While this aspect of graduate education is beyond the realm of our data, there is at least one example where we noted a decline in a program that coincided with the retirement of a prominent archaeologist. Perhaps another well-worn piece of advice is that some schools, somewhat regardless of tier ranking, have programs in specific regions (e.g., American Southwest) that tend to succeed in placing graduates in jobs that require faculty with specific regional expertise. These, of course, are not new observations and likely are not surprising to those of us who have offered advice on graduate school to students in the past few years.
Although much of the advice regarding graduate school selection has remained the same (only the names have changed slightly), our data point to other aspects of academic job success that were perhaps not part of what is trending in the modern market regarding graduate training. Perhaps most interesting is the high market share that foreign institutions hold at US and Canadian programs. We speculated that this is due, in part, to the different training models that emphasize archaeological science offered by these universities (specifically U.K.-based schools). Twenty years ago, advisors offering advice to students were likely hesitant to advise students to seek an advanced degree outside of North America if the individual ultimately aspired to a faculty position at a US university. This does not seem to be the case anymore, and degrees from foreign institutions may even confer a competitive advantage. However, foreign degree programs can be expensive, and funding opportunities are less certain for out-of-country students.
In sum, what this essentially means is that success in landing a faculty position begins the moment one applies for graduate school. The reality is that being accepted into a top program, as well as the reputation of scholars in that program and what they are known for (e.g., regional specialties, archaeological science), really does make a difference. It is not enough to be successful in graduate school; students should pick a graduate program (and advisor) that will provide a competitive advantage when it comes time to apply for faculty positions—because it really does matter.
We acknowledge the concerns that some readers may have concerning our rankings. To reiterate a point made above, the tier rankings presented in Table 1 (and Supplemental Table 1) reflect academic market share, and not necessarily the quality of a specific program. The UGA faculty believe we are developing a strong archaeology graduate program and that an increased emphasis on archaeological science since 2012 will help our students be more successful in the academic job market. Although our program is currently ranked in Tier III, we hope that when this study is repeated in 2024–2025 that UGA will have moved up in ranking. But again, the odds are against our students (and yours). The reality is that the academic job market is dominated by a few top schools. Students at lower-ranked schools must compensate for this fact by publishing in high-profile journals and by being active at conferences, both local and national. We likewise promote open dialogue about alternative academic tracks early in the graduate training process while at the same time focusing on how to best be successful in an academic sense. Some departments acknowledge the fact that academic positions are hard to obtain and focus on training students who will be successful elsewhere (i.e., CRM, government, museums). Certainly, that is ideal given the academic job market, and we would likewise encourage all departments to develop seminars/courses that focus on alternatives to academic careers. This means that today's graduate training should also include aspects of “non-academic” skills such as business management, legal frameworks, and other professional development, but also (and both most difficult and most important) preparing students mentally to view non-academic careers as equally valid and rewarding. We also acknowledge that many programs have their own particular histories that have impacted their departments—whether they be positive or negative. Departmental budgets and numbers of archaeology faculty greatly impact the sizes of graduate programs in terms of numbers of faculty and students who can be supported by the department. Departments without strong centralized funding will produce fewer students relative to departments that produce many students, and this is in part reflected in the rankings. Many lower-tier programs are new, which is reflected in the rankings. Likewise, some programs focus on education and training of foreign doctoral students who then return to their country of origin. This ultimately translates to a lower market share in the measures used here. Some faculty might argue that our numbers do not agree with their specific tally. The same is true for UGA. To reiterate, if an individual is not listed in the 2014–2015 AnthroGuide (or employed as faculty at UNC or Berkeley as noted above), then they are not included in our dataset. This is not ideal, but in lieu of a comprehensive database of doctoral archaeologists in the US and Canada, the AnthroGuide is the best alternative. In sum, these data are useful for students, faculty, and administrators alike as we look towards the future of archaeology and consider what it takes to build better employment opportunities for all of us.
Acknowledgments
Data presented in this paper were generated, in part, via a series of graduate courses co-taught by Thompson and Speakman. We thank David Killick, Daniel Sandweiss, Robert Kelly, and three anonymous reviewers for providing valuable comments, suggestions, and insight on earlier drafts of this paper.
Data Availability Statement
The data on which this study is based were generated by the authors using the 2014–2015 American Anthropological Association AnthroGuide (with exceptions as noted in the text) and the National Science Foundation. A Microsoft Excel spreadsheet containing these data is available from R. J. Speakman and V. D. Thompson at the University of Georgia in Athens, Georgia.
Supplemental Materials
For supplemental material accompanying this paper, visit https://doi.org/10.1017/aaq.2017.36.
Supplemental Table 1. Archaeology Market Share of Institutions Included in Study.

