


An agricultural innovation is a new idea or a practice that is perceived as new by an individual (Tobon Reference Toborn2011).Footnote 1 Agricultural innovations are introduced in packages. The adoption of technological innovations within the context of agricultural production include improved germplasm to modern machine or farming equipment, natural resource management, weed and pest management techniques, integrated farming techniques, and conservation agriculture.
Agricultural growth through higher productivity is widely viewed as one of sub-Saharan Africa's (SSA) main path to long-term economic development because about 70 percent of its population are smallholder farmers who depend on agriculture for livelihood (Diao, Hazell, and Thurlow, Reference Diao, Hazell and Thurlow2010, Collier and Dercon Reference Collier and Dercon2014). Among the potential drivers of agricultural productivity, adoption of agricultural innovations is important. This is because agricultural innovations are developed to increase farm yields, improve quality of farm produce, increase farmers’ income, and ensure food security (Lee Reference Lee2005, Wright and Shih Reference Wright and Shih2010). From an environmental stand point, agricultural innovation can help improve soil quality and reduce nutrient loss to leaching and erosion. It can also help enhance knowledge of sustainable resource management and reduce the net emission of greenhouse gases.
Agricultural innovations initiated by the International Agricultural Research Centers (IARCs) in the 1960s focused exclusively on the production of improved crop varieties and helped transform agricultural practices and rural economies across Asia and Latin America (The New York Times 2015). The success of these improved crop varieties was characterized as the Green Revolution (GR), which began with rice and wheat improvement research at the International Rice Research Institute (IRRI), Philippines, and at the International Center for Wheat and Maize Improvement (CIMMYT), Mexico, where Norman Borlaug, who is regarded as the father of GR, was the chief breeder.Footnote 2 The GR has since included improved varieties of sorghum, maize, cowpea, and many other food crops (Cypher and Dietz Reference Cypher and Dietz2009). The spread of GR to other food crops rests especially on the widespread adoption of the first improved varieties of rice and wheat by Asian and Latin American farmers.Footnote 3 The scale of adoption and yield-increasing evidence of the transformative force of GR technological innovation significantly shifted the food supply function in these regions to the right, leading to a substantial decline in food prices and increases in nutrient intake (Pingali Reference Pingali2012).
The impact of adopting agricultural innovation in SSA cannot be compared to its success in transforming rural economies of many Asian and Latin American countries during the 1960–1990s (Dawson, Martin, and Sikor, Reference Dawson, Martin and Sikor2016). For instance, Evenson and Gollin (Reference Evenson and Gollin2003) reported an estimated average yield of food crop production in Latin America and Asia as 2.154 and 2.081 tonnes/ha, respectively, and modern varieties (MV) accounted for about 77 percent and 97 percent of their respective growth in yields between the 1980s and 1990s. However, the estimated average yield of food crop production for SSA is about 0.361 tonnes/ha. They also noted that MV only accounts for about 47 percent of the growth in yields around the same period. The low productivity of agriculture in sub-Saharan Africa led to the drive for an African GR through establishment of an Alliance for Green Revolution in Africa (AGRA) in 2006 by the Rockefeller Foundation and the Bill & Melinda Gates Foundation. The role of AGRA is to use grants and capacity building to help SSA national institutions effectively develop and disseminate productivity-enhancing agricultural innovations to smallholder farmers in the region.
Over the years, numerous economic studies have examined the economic impact of adopting agricultural innovations across the globe. While a number of these studies examined the impact of agricultural technology adoption on farm production, others considered the welfare impact of adopting agricultural innovation.Footnote 4 Abate et al. (Reference Abate, Braw, Minot and Bernard2014), Siziba et al. (Reference Siziba, Nyikahadzoil, Nyemeck, Diagne, Adewale and Oluwole2013), Sjakir et al. (Reference Sjakir, Awang, Manaf, Hussain and Ramli2015), and Gonzalez et al. (Reference Gonzalez, Ibarraran, Maffioli and Rozo2009), among others, are good examples of studies that have examined the impact of adopting agricultural innovations on farm production indicators such as crop yields, technical efficiency estimates of production, and volume of production. Amare, Asfaw, and Shiferaw (Reference Amare, Asfaw and Shiferaw2012), Ndaghu et al. (Reference Ndaghu, Abdulsalam, Rahman and Abdoulaye2015), and Kuwurnu and Owusu (Reference Kuwurnu and Owusu2012), among others, have examined the impact of adopting agricultural innovations on household welfare. Some of the welfare indicators considered in these studies include consumption/food expenditure, food security and food-poverty indices, and farm income or profit level. Although many studies have examined the impact of adopting agricultural innovation and technology on production and welfare measures in SSA, the results have been mixed. These mixed results are likely to have implications for agricultural research funding and may also affect adoption of new technologies in countries or regions where the impact of adoption of agricultural innovations have not been encouraging. As a result, some studies have included attempts to synthesize the literature on agricultural innovation and adoption to identify factors that could have enhanced the potential of these new technologies.
A qualitative review of the literature on adoption of agricultural innovation began with works of Feder, Just, and Zilberman (Reference Feder, Just and Zilberman1985), Lee (Reference Lee2005), and Doss (Reference Doss2006). Feder, Just, and Zilberman (Reference Feder, Just and Zilberman1985) clarified the conflicting conclusions that sometimes arise in the adoption literature. They noted that differences in the outcome of adopting agricultural innovation in the primary studies can be attributed to varying social, cultural, and institutional environments in the regions or countries where these studies were conducted. Lee (Reference Lee2005) identified macrolevel policies that are essential for enhancing the adoption of sustainable agriculture and natural resource management in developing countries. Some of the identified policies include exchange rate, trade reforms, domestic agricultural policies, input subsidies, labor market policies, investment in rural public education, and sectoral policies. Doss (Reference Doss2006) focused on the shortcomings of microlevel literature on the adoption of agricultural innovations. It was noted that the sampling approach used in these studies constituted a major problem in measuring the impact of adopting improved technologies on production and welfare measures.
Although these efforts are commendable, qualitative reviews of literature are sometimes subjective and may not give a holistic view of underlining factors that could bring about the realization of the full potential of agricultural adoption. As a result, it is becoming increasingly popular in economics to synthesize estimates from different but similar studies into a unified analysis. Such analyses, that study attributes as control variables, could provide more insight into variations in the impact of agricultural adoption literature and could also serve as a guide for future studies that intend to examine the impact of adoption on production and welfare measures. Given the advantage of the quantitative over qualitative synthesis of empirical studies, we employ a meta-regression analysis (MRA) of the primary studies to examine the impact of adopting agricultural innovations in SSA on production and welfare outcomes. The meta-analysis approach will help provide answers to the following research questions:
RQ1. Does adoption of agricultural innovations have any impact on farm production and household welfare in SSA?
RQ2. Which of the study-specific attributes explain the variations in the reported estimates of the impact of adopting agricultural innovation on farm production and household welfare measures reported in the sampled studies?
Arising from the research questions outlined above, this study is important for two reasons. First, it sheds light on the impact of adopting agricultural innovation on farm production and household welfare measures in SSA. Second, such analysis could help identify study attributes that are essential for modeling the impact of adopting agricultural innovation and technology for future research.
The paper is structured as follows. The next section, Meta-Analysis: An Overview of the Methods, contains a brief overview of the method of meta-analysis. The Meta-Dataset provides a detailed description of our metadata. Next we review our findings in the Results and Discussion section, and we end the paper with Concluding Remarks.
Meta-Analysis: An Overview of the Methods
Meta-analysis allows researchers to combine the results of several homogenous studies into a comprehensive estimate for better-informed policy discussions (Sterne Reference Sterne2009). It is a methodological improvement over qualitative reviews because it makes use of statistical tests that are devoid of subjectivity bias associated with qualitative review (Gallet Reference Gallet2010). Meta-analysis has become a standard method of searching for general patterns in any homogenous literature (Glass Reference Glass1976). It helps to uncover the actual effect size of interest and identification of sources of heterogeneity/variation across primary studies under review. In the following subsection, we address the appropriate statistical tools needed to estimate the effect size in a meta-analysis, given its relevance for policy (Doucouliagos Reference Doucouliagos2011).
Creating Effect Size Based on Partial Correlation Coefficient
Elasticities are the popular measures of effect size in meta-analysis. However, they are largely unsuitable when primary studies do not provide sufficient information to calculate elasticities or when they use a variety of noncomparable scales and different functional forms. Elasticities become difficult to interpret in this situation. When elasticities are unsuitable in meta-analysis, partial correlation coefficient r i becomes the appropriate measure of effect size (Oczkowski and Doucouliagos Reference Oczkowski and Doucouliagos2014). Partial correlation coefficient r i has a natural interpretation across studies because it is independent of the metrics used to measure the explanatory and dependent variables in the primary studies (Stanley and Doucouliagos Reference Stanley and Doucouliagos2015). Hence, the partial correlation coefficient offers a convenient way of deriving comparable estimates from a large number of studies (Doucouliagos Reference Doucouliagos2011). This standardized measure of effect size can be computed as shown in equation 1 using the measure of statistical significance (t-test statistics) of the estimate and its degree of freedom (df) obtained from the primary study:
 $$r_i = t_i/\sqrt {t_i^2 + {\rm d}{\rm f}_i} $$
The standard error of the partial correlation coefficient, seri, is given by:
 $${\rm s}{\rm e}_{ri} = \sqrt {(1 - r_i^2 )/{\rm d}{\rm f}_i} $$
According to Cohen (Reference Cohen1988), an absolute value of r i below 0.10, between 0.25 and 0.4, and above 0.4 represent small, medium, and large effect sizes, respectively. However, Doucouliagos (Reference Doucouliagos2011) suggests that r i with absolute values of 0.07, 0.17, and 0.33 should be considered small, medium, and large effect sizes, respectively.
Although the focus of the study is to synthesize the literature on the impact of adopting agricultural innovations on production and welfare, the use of r i in the present study cannot be a substitute measure of real economic impact across the selected case studies. In this context, r i is used to measure the relationship (i.e., direction) between the adoption of agricultural innovations and indicators of farm production/household welfare measures and the extent of such relationships across the selected case studies. The sign of r i represents the direction, while the size of r i denotes the magnitude/extent of the relationship.
Funnel Asymmetry Test and Precision Effect Test
The funnel asymmetry test (FAT) and the precision effect test (PET) of MRA are employed to examine the existence of publication bias among the literature under review, and to deduce the relationship and magnitude of such relationship after correcting for publication bias, respectively. According to Card and Krueger, (Reference Card and Krueger1995), publication bias may arise from: (1) a predisposition of the reviewers and editors to accept papers that are consistent with the conventional view, (2) researchers’ selection of models that are in line with the conventional view, and (3) a general predisposition to treat statistically significant results favorably. Publication bias can, however, make uncovering the true effect size of interest difficult because the effect sizes reported in the literature under consideration will be skewed (Stanley Reference Stanley2005).
Both tests, proposed by Egger et al. (Reference Egger, Smith, Sceider and Minder1997), are jointly known as the FAT-PET MRA within the framework of univariate meta-regression and are defined by:
 $$r_i = {\rm \beta} _0 + {\rm \alpha} _0{\rm s}{\rm e}_i + {\rm \mu} _i$$
where r i represents partial correlation coefficient (PCC); sei is the standard error of the partial correlation coefficient (PCC); β0 and α0 are parameters of interest; and μi is the error term of the regression. Publication bias exists if α0 is statistically significant, irrespective of its sign. A genuine empirical effect that is free of publication bias is determined by testing whether or not β0 = 0.
Multivariate MRA to Explain Sources of Heterogeneity in the Effect Size
To identify the sources of differences/variations in the computed partial correlation coefficient r i, we employ an MRA defined below:
 $$r_i = {\rm \beta }_0 + {\rm \alpha }_0{\rm s}{\rm e}_i + \mathop \sum \limits_{k = 1}^k {\rm \lambda }_kX_{ki} + \varepsilon _i$$
where r i, α0, and sei are as earlier defined;. X k is a vector of study attributes hypothesized to explain r i; α0, β0 and λk are the parameters to be estimated;. εi is a normally distributed error term.
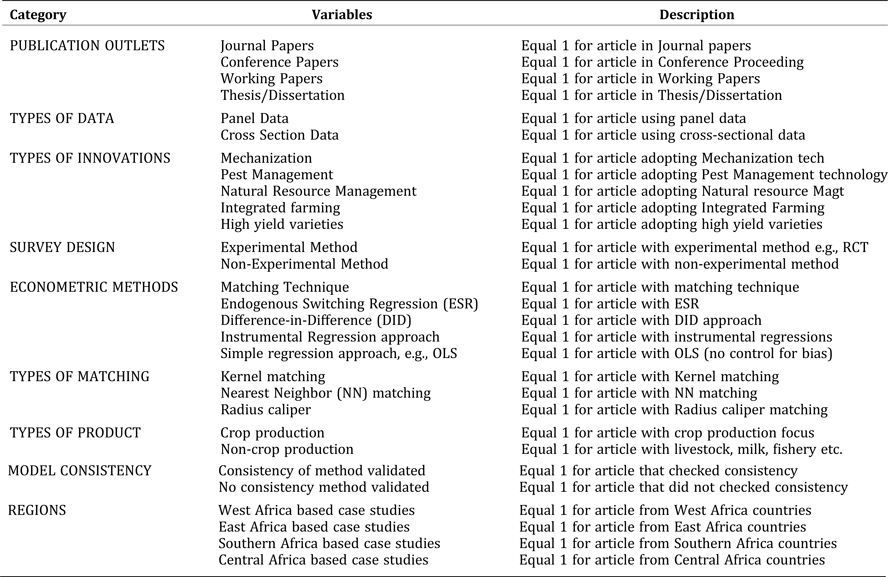
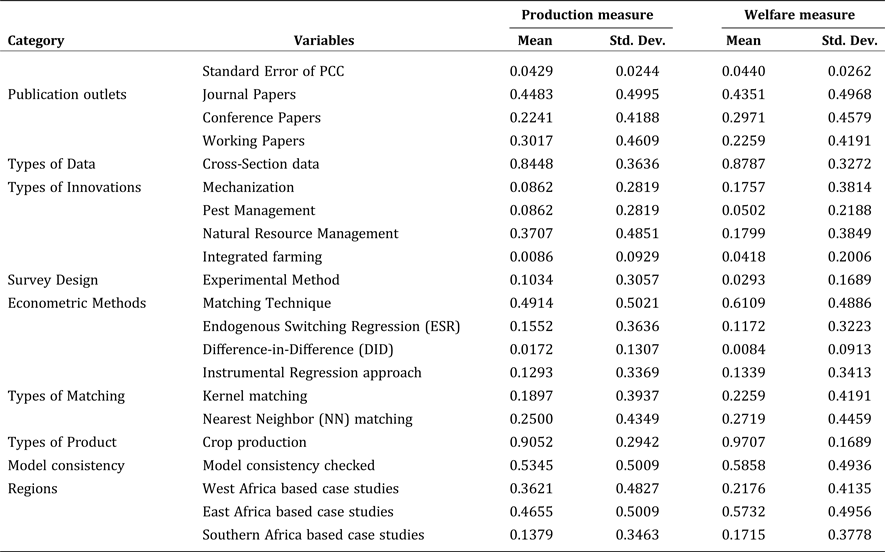
Guided by economic theory and meta-analysis literature, the study attributes X k detailed description presented in Table 1 and summary statistics in Table B of the Appendix) in equation 4 include publication outlets (i.e., journals, conference papers,working papers), types of data (i.e., cross-sectional data vs. panel data) survey design (i.e., experimental method vs. nonexperimental method), types of products (i.e., crop vs. non-crop), and econometric method (i.e., studies using matching, endogenous switching regression, DID, instrumental regressions vs. ordinary least square regression with no control for selection bias). Other variables include types of innovations adopted by farmers in the primary studies selected (i.e., studies focusing on mechanization, pest management, conservation agriculture, integrated farming system, and high yield variety), types of matching (i.e., kernel, nearest neighbor, radius caliper), checking for model consistency (whether or not the authors checked for model consistency in the primary studies), and regions where the primary studies were conducted (i.e., West Africa, East Africa, Southern Africa, Central-Africa).
Table 1. Moderator variables for the meta-regression analysis from the selected studies
MRA Model Estimation
Estimation of the parameters of equations 3 and 4 follows the approach of Stanley (Reference Stanley2008) and Stanley and Doucouliagos (Reference Stanley and Doucouliagos2015), which are based on the weighted least square (WLS) regression model, with the weight equal to the inverse of the variance of the dependent variable. They argue that weighted regression simultaneously reduces publication bias and discount small sample studies. In addition, the variance of the weighted average of the estimates is also minimized. As noted by Ogundari and Abdulai (Reference Ogundari and Abdulai2013), the WLS model, unlike unweighted OLS regression, corrects for outliers and measurement errors by giving them less weight. It thus ensures that they do not confound results with inflation of the variance of the regression.
We employ WLS to estimate the parameters of equations 3 and 4 using robust and cluster-adjusted standard errors to address the research questions raised earlier in the study (see Costa-Font and Hernandez-Quevedo, Reference Costa-Font and Hernandez-Quevedo2015, Bocker and Finger, Reference Bocker and Finger2017). Both the robust and cluster-adjusted standard errors are essential to improve efficiency of the estimated parameters. However, the use of cluster-adjusted standard error (with study ID as the cluster indicator) is to further minimize or control the influence that multiple estimates from the same primary study may have on the efficiency of the estimated parameters of the meta-regression.
In addition to the WLS model, the study also employs mixed effect ML and fixed effect models with weight being the inverse of the variance of the dependent variable. This methodology is increasingly popular in MRAs in recent time (see: Galindo et al. Reference Galindo, Samaniego, Alatorre, Carbonell and Reyes2015, Laroche, Reference Laroche2016, Tokunaga and Iwasaki Reference Tokunaga and Iwasaki2017).Footnote 5
The Meta-Dataset
The study employed ex-post studies compiled from the economic databases of Web of Science, Google Scholar, ResPEc, AgEcons search, ASC index, and bibliographies based on econometric analysis of the impact of agricultural innovation and technology adoption in SSA.Footnote 6 We used relevant keywords such as “impact of agricultural technology,” “effects of agricultural technology adoption,” and “agricultural innovation adoption,” in compiling the 92 studies published between 2001 and 2015. A preliminary search yielded over two million studies, but most had a main focus of obtaining probability estimates for adoption of agricultural technology (see Table A in the Appendix for the list of the keywords used to search for studies from economic databases used in the study).
In the advanced search, two important criteria were considered. First, we narrowed the search to studies on “impact of agricultural adoption.” Second, only studies that reported standard errors or t-values of the variable representing the impact of adopting agricultural technology on potential outcomes were included in our final sample for the analysis.Footnote 7 Some of the potential outcomes of agricultural adoption reported in the primary studies include yield, volume of production in kilograms, technical efficiency score, farm income/profit level, consumption expenditure, dietary diversity score, nutrient intakes, anthropometry measures, and food-poverty measures. The final sample includes studies that focus on crop and livestock innovations. Crop-related studies include those that focus on maize, rice, banana, wheat, groundnut, yam, cowpea, cassava, pigeon pea, sorghum, chicken pea, cotton, and mango. On the other hand, studies that focused on livestock include those on dairy and fish farmers.
Our data are structured in accordance with the requirements of meta-analysis because the estimation requires the regression of study attributes on the effect size. Study attributes considered in this analysis include nature of innovation, type of agricultural product, survey design, methodology, econometric approach, and matching technique. Classification based on the nature of innovation include mechanization, pest management, natural resource management, and high yield variety. Studies with a focus on adoption of irrigation, tractor, and storage such as metasilos were classified as mechanization, while those on adoption of integrated pest management and Bt-crops were classified as pest management. Other innovations identified in the study include natural resource management such as row planting, crop rotation, soil and water conservation, and zero tillage; integrated farming related to adoption of crop-intensification and aquaculture-agriculture farming techniques; and high yield variety, which involves the adoption of improved seed, improved animal breed, and tissue culture.
An important aspect of this type of study is the survey design. Primary studies that adopt experimental designs such as the randomized control trial (RCT) are free from selection bias. However, selection bias is likely to be an issue with nonexperimental designs based on observational data. As a result, we accounted for the research design by classifying the primary studies into experimental and nonexperimental study design. We also accounted for the type of econometric approach used in the selected studies. For example, studies were stratified based on different econometric approaches that include matching techniques, endogenous switching regression, DID, and instrumental regression relative to studies that employ the ordinary least square (OLS) with no control for selection bias.
Given that primary studies that employ matching technique also vary across types of algorithm employed, we further classified the selected studies into kernel and nearest neighbor matching techniques relative to radius caliper matching. Due to the importance of checking for model consistency in impact assessment studies, we also grouped the selected primary studies into those that checked for model consistency and those that did not.
Finally, we classified primary studies into two major outcomes, depending on whether or not the outcome of the estimated impact of adoption fits into the farm production category or household welfare. Guided by the previous studies and the work of Barrientos-Fuentes and Berg (Reference Barrientos-Fuentes and Berg2013), outcomes such as yield, technical efficiency estimates of production, and volume of production were referred to as production measures, while those related to consumption/food expenditure, food-poverty indices, farm income, or profit level were classified as welfare measures. Barrientos-Fuentes and Berg (Reference Barrientos-Fuentes and Berg2013) further referred to proxies of farm production as direct outcome and those representing household welfare as an indirect outcome of the impact of adopting agricultural innovations.
Table 1 provides an overview of various characteristics of the primary studies included in the MRA, while Table B of the Appendix presents the list of the summary statistics of the variables. There are 71 studies that considered welfare measures as outcome variables of interest, and this yielded 239 partial correlation coefficients. On the other hand, only 21 studies employed production-related variables as outcome of interest in our sample, and this yielded 116 partial correlation coefficients. The list of the 92 studies used for the meta-analysis, along with information on the authors, country, publication outlet, year of publication, types of innovation, survey design, econometric methods, and agricultural product, is available in the online unpublished Appendix of this journal.
Results and Discussion
The Size and Distribution of the Partial Correlation Coefficient
Table 2 presents the partial correlation coefficient of the relationship between adoption of agricultural innovations and farm production/household welfare defined by r i. We considered average estimates of r i from simple arithmetic mean that did not account for heterogeneity in r i. On the other hand, we employed fixed effect average and random effect average that account for heterogeneity in r i. Figure 1 presents the distribution of r i for the whole sample and across the potential outcomes.
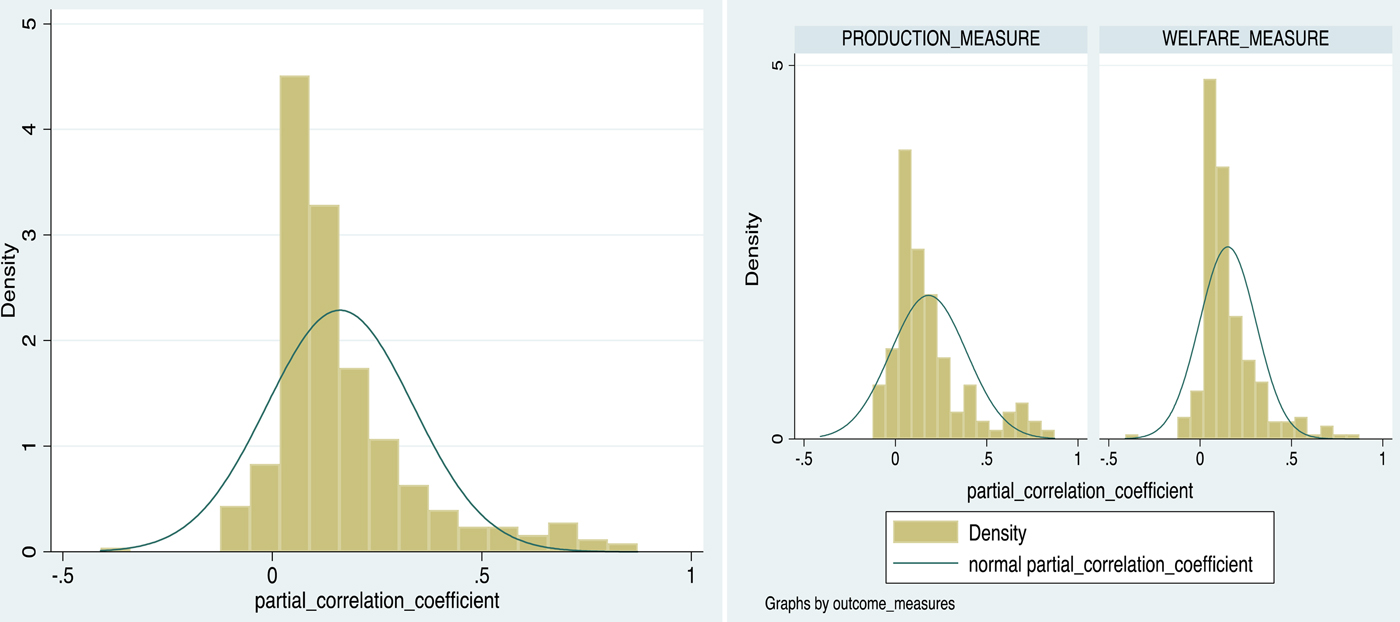
Figure 1. Distribution of partial correlation coefficient (PCC) of the impact of agricultural technology adoption for the whole sample and on production and welfare measures
Table 2. Average values of partial correlation coefficient (PCC) by potential outcomes
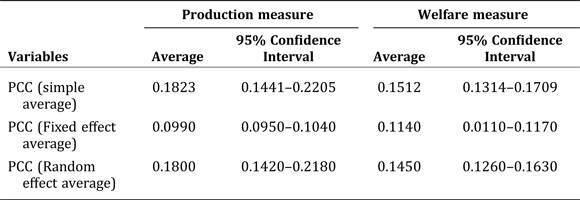
PCC is denoted by r i and measures the relationship between adoption of agricultural innovations and the outcome measures.
Table 2 shows a simple average, fixed effect average, and that of random effect average of r i as 0.182, 0.099, and 0.180, respectively, for studies that focus on the relationship between agricultural innovation and farm production. This suggests a medium size/magnitude according to Doucouliagos's (Reference Doucouliagos2011) new guideline for interpretation of r i, earlier stated in this paper. Results from the table show absolute values of 0.151, 0.114, and 0.145 for simple average, fixed effect average, and random effect average estimates, respectively, for studies that focus on the relationship between agricultural innovation and household welfare. These results also suggest a medium size effect. Also using Cohen's (Reference Cohen1988) rule on r i, all the estimates in Table 2 are small in magnitude. The implication of these results is that irrespective of the guidelines used in interpreting the estimates, the relationship between agricultural innovations and farm production/welfare presented in Table 2 still appears weak. In Section :RQ1: Does Adoption of Agricultural Innovations Have Any Impact on Farm Production and Household Welfare in SSA?” below, we further discuss whether or not r i obtained after correcting for publication bias is significantly different from zero.
Publication Bias
We use the funnel plot and FAT-PET specified in equation 3 to examine the possibility of publication bias in the study. The funnel plot visually assesses the degree of publication bias, while the FAT-PET quantitatively assesses publication bias using a meta-regression approach. As mentioned earlier, publication bias can make uncovering the true effect size difficult because it skews the effect sizes reported in the primary studies.
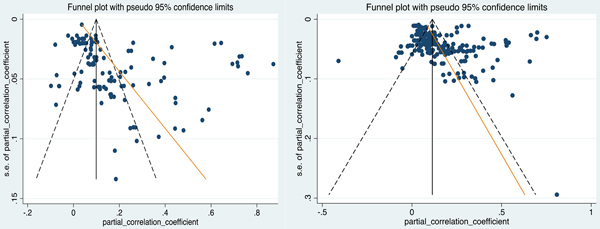
Therefore, in line with previous literature on meta-analysis, we first examined the funnel plot (Figure 2) for any evidence of publication bias. The left-hand figure in Figure 2 depicts the funnel plot for production measures, while the right-hand figure represents the funnel plot for household welfare measures. The vertical line from both figures denotes the average value of r i. The two dashed lines represent the boundaries of conventional statistical significance at the 5 percent level, such that estimates outside the boundaries are statistically significantly different from the underlying effect. When outlying estimates form more than 5 percent of the data, it suggests the existence of publication bias.
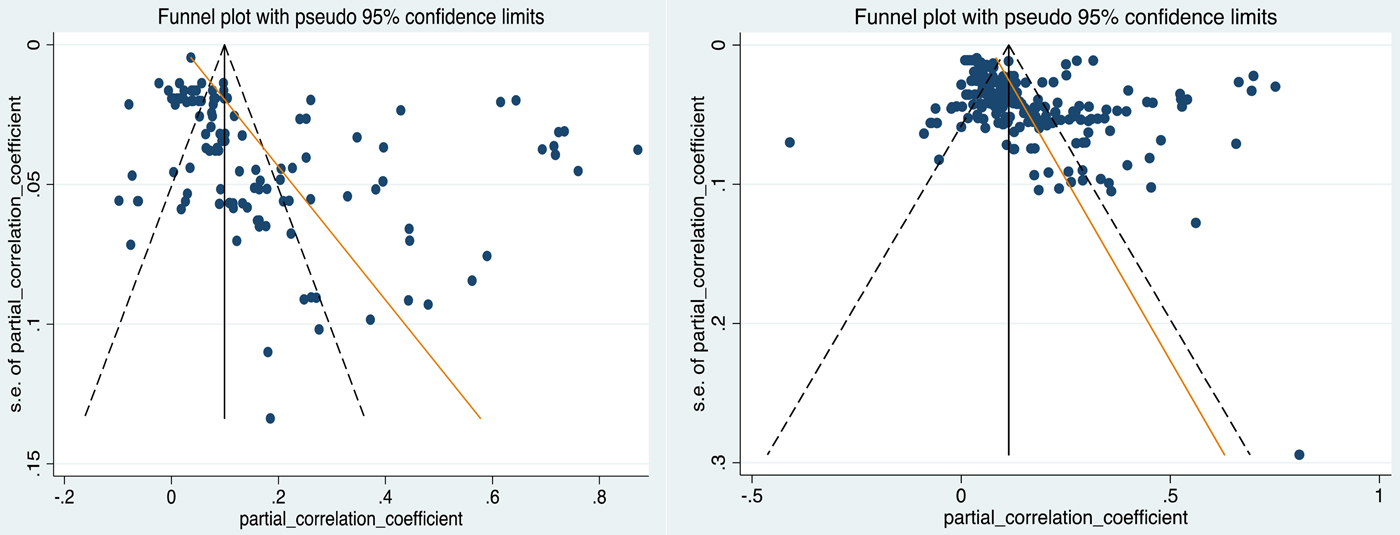
Figure 2. Funnel plots of relationship between agricultural innovations adoption on production (LEFT) and welfare (RIGHT) measures from the sampled study. Note: Partial correlation coefficient (PCC)
Because the estimates appear to be heavier on both sides of the boundaries in Figure 2, we infer that publication bias does exist among the sampled studies. This shows that most sampled studies preferred reporting statistically significant estimates of the impact of adopting agricultural innovation on farm production and household welfare measures considered in the primary studies.
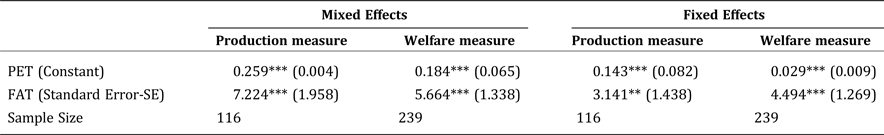
To further confirm the presence of selection bias, we considered the FAT-PET model of equation 3 presented in Tables 3 and 4. Because the FAT represented by α0 in equation 3 shows a statistically significant positive estimate in both tables, results suggest that publication bias exists in the selected studies employed in our analysis. These results reveal that reviewers and editors are biased towards studies that report a significant impact of adopting agricultural innovations on farm production and household welfare measures. The implication of the result is that the distribution of the reported effect size is likely to be skewed. Thus, the estimated effect size is likely larger than actuality.
Table 3. Test for publication bias and precision effect (FAT-PET) model using WLS model.
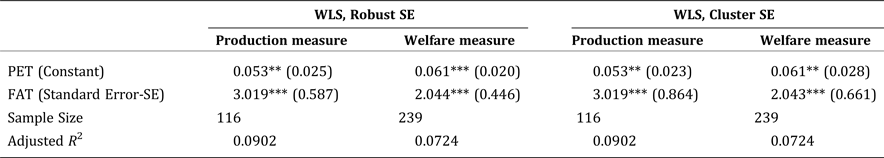
Note: Dependent variable is partial correlation coefficient r i. *,** and *** stand for significant estimate at the level of 10%, 5%, and 1% respectively.
Table 4. Test for publication bias and precision effect (FAT-PET) model using mixed effects and fixed effects model
Note: Dependent variable is partial correlation coefficient r i. *, ** and *** stand for significant estimate at the level of 10%, 5%, and 1% respectively.
RQ1: Does Adoption of Agricultural Innovations Have any Impact on Farm Production and Household Welfare in SSA?
The estimates of PET represented by β0 in equation 3 and reported in Tables 3 and 4 show that adoption of agricultural innovation does have a positive and significant relationship with indicators of farm production and household welfare measures employed in the study. More importantly, the size of the coefficients of PET ranges from 0.053–0.259 across the estimates reported in the tables. According to Table 3, these results suggest that the estimated magnitude of PET for both the production and welfare measures are small. With the exception of welfare measure for the fixed effects model in Table 4, the estimated magnitudes of PET are of a medium size, which also suggests a weak relationship. These findings strongly align with the earlier results reported in the Section “The size and Distribution of the Partial Correlation Coefficient.” On this basis, we conclude that the weak relationship observed between adoption of agricultural innovation and the outcome variables considered in this study could probably explain why adoption of agricultural innovations has limited impact in SSA.
Lack of efforts to develop and disseminate an integrated package of new and useful technologies, which include improved management practices and natural resource management practices, have been identified as a reason for the failure of the agricultural innovations’ adoption to exhibit a significantly higher impact in SSA (Otsuka and Muraoka Reference Otsuka and Muraoka2015). Also, there is increasing concern among Development Economists as to whether or not institutional constraints such as credit markets, poor transportation networks, weak extension services, absence of private input retailers, are responsible for the poor performance of green revolution in SSA (The New York Times 2015). Nonetheless, it is possible that outright lack of development efforts or combinations of the aforementioned observations could help explain the weak relationship between adoption of agricultural innovation and farm production/household welfare measures.
RQ2: Which of the Study-Specific Attributes Explain the Variations in the Reported Estimates of the Impact of Adopting Agricultural Innovation on Farm Production and Household Welfare Measures Reported in the Sampled Studies?
The answer to this research question requires identification of the study attributes that significantly explain r i using MRA. Table 5 shows the multivariate MRA estimates based on WLS model, while Table 6 provides the results of the mixed effects ML and fixed effects regression models. The estimated parameters from both models are almost identical when farm production measures are considered as the outcome variable of interest. However, differences exist in some of the variable estimates when household welfare measures are considered as the outcome of interest. We also observed that a number of study attributes employed in our MRA have consistent results in terms of sign and level of significance across the estimated models. These variables include the coefficients of standard error, cross-section data, experimental method, matching technique, ESR, instrumental variable regression approach, and the set of regional dummies.
Table 5. Meta-regression analysis using WLS Model
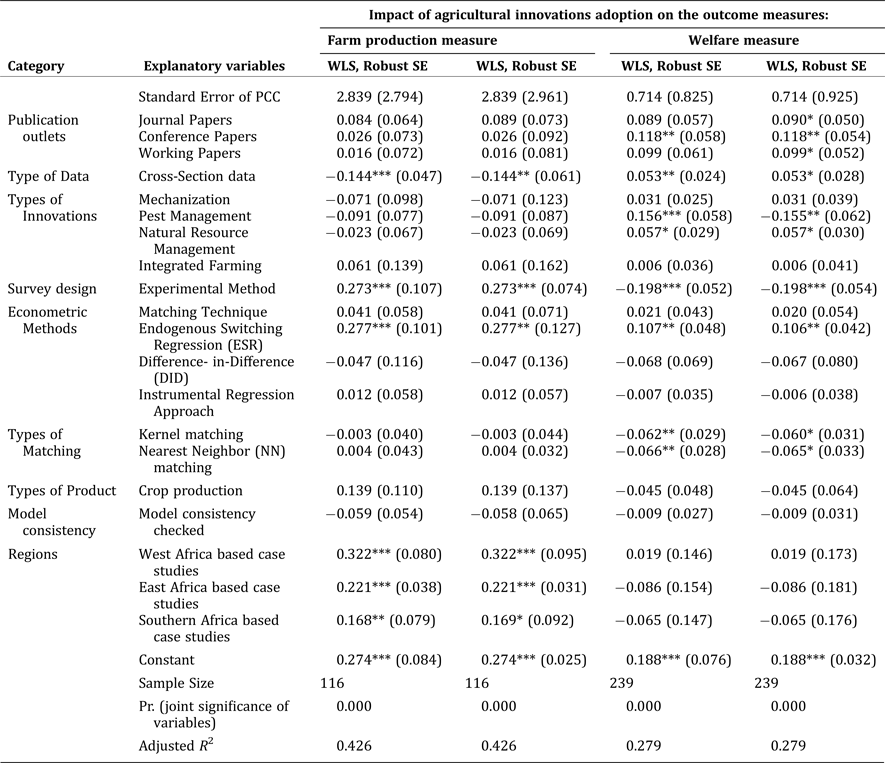
Note: Dependent variable is partial correlation coefficient (r) measure of the impact of agricultural technology adoption from selected case studies; All results are weighted by inverse variance of standard error of PCC and cluster with study ID. *, **, and *** stand for significant estimate at the level of 10%, 5% and 1% respectively.
Table 6. Meta-regression analysis using mixed effect ML model and fixed effect model
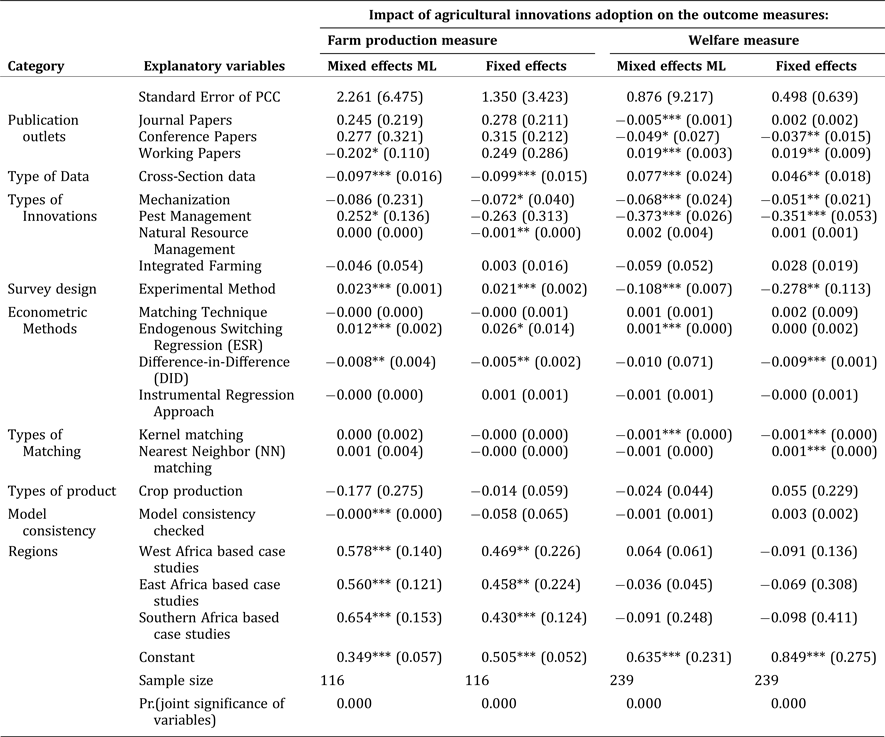
Note: Dependent variable is partial correlation coefficient (r) measure of the impact of agricultural technology adoption from selected case studies; A=all results are weighted by inverse variance of standard error of PCC and cluster with study ID. *, ** and *** stand for significant estimate at the level of 10%, 5%, and 1% respectively.
Multivariate MRA Results of the Relationship Between Adoption of Agricultural Innovation and Farm Production Measures
The first two columns of Tables 5 and 6 show the results of the multivariate MRA when production measures were specified as the outcome variable of interest. The results show that the use of experimental research methods relative to those that employ nonexperimental methods have a significant positive effect on r i in both the tables. It suggests that experimental research methods that control for observable and unobservable selection bias are likely to provide estimates with the most statistically significant impact of agricultural innovation adoption on production measures.
As regards the methodology employed in the primary studies, the use of endogenous switching regression (ESR) relative to ordinary least square (OLS) has a significant positive effect on r i in both the tables. This shows that r i is significantly higher among studies that use ESR compared to those that use OLS. In addition, results reported in Table 6 suggest that DID also has a significant effect on r i.
The results also reveal that the use of cross-sectional data relative to panel data has a significant negative effect on r i in both tables. The implication of this is that r i is significantly lower in studies that use cross-sectional data compared those that use panel data. This shows the importance of using panel data in the identification of unobservable heterogeneity associated with measuring the impact of agricultural innovation adoption on farm production. It is important to note that the results of adopting agricultural innovations on r i are mixed across the two models reported in Table 6. According to Table 6, working papers exhibit a significant effect on r i, while checking for model consistency also has a significant effect on r i.
The r i estimates differ significantly across the subregions of SSA in both tables. Specifically, the results show that r i is higher for studies carried out in West Africa, East Africa, and Southern Africa relative to those conducted in Central Africa. The impact of adopting agricultural innovations reduces across the regions with the largest impact in the West Africa, followed by South Africa, East Africa, and Central Africa. Finally, we found that the coefficient of standard error is nonsignificant in both tables. The implication of this is that publication bias does not exist in the selected studies once we account for study characteristics in the multivariate setting.
Multivariate MRA Results of the Relationship between the Adoption of Agricultural Innovations and Household Welfare
The last two columns of Tables 5 and 6 reports the results of the multivariate MRA when welfare measures were specified as outcomes of interest. Studies that employ ESR relative to OLS have a significant positive effect on r i in both tables. This shows that r i is significantly higher among studies that employ ESR compared to those that used OLS. However, DID has an opposite significant effect in the mixed effect ML and fixed effects models.
As regards the nature of agricultural innovations examined in the primary studies, results show that adoption of pest management has a significant effect on r i in both tables. In addition, adoption of natural resource management practices also has a significant effect on r i, according to Table 5. Table 6 shows that adoption of mechanization technologies has a significant effect on r i, The implication of this is that the choice of agricultural technology adopted has a mixed impact on r i in the studies sampled. Working papers in the mixed effect model of Table 6 have significant effect on r i. In Tables 5 and 6, we also found that the use of cross sectional data relative to panel data has a positive effect on r i in both tables. This shows that r i is significantly higher among studies that use cross-sectional compared to panel data. However, this is in contrast to that obtained in Section “Multivariate MRA Results of the Relationship Between Adoption of Agricultural Innovation and Farm Production Measures” when r i measures the relationship between adoption of agricultural innovations and farm production.
We believe the observed opposite effect of cross-sectional data on r i for indicators of farm production and household welfare measure could be attributed to measurement errors. Indicators of welfare measures considered in the selected primary studies includes food expenditure, poverty and food security indices, nutrition outcomes, and dietary diversity measures. As noted by Zezza et al. (Reference Zezza, Carletto, Fiedler, Gennari and Jolliffe2017), food consumption data from household surveys are possibly the single most important source of information to compute poverty and food security indices, nutrition outcomes, food expenditure, and anthropometric measures and are associated with substantial measurement errors. This suggests that measurement errors in the process of generating welfare indicators may be substantial, given the stages involved in computing these indicators.Footnote 8
Other results from both tables suggest that the use of experimental methods has a significant negative effect on r i. This shows that the magnitude/size of the relationship between adoption of agricultural innovation and measures of household welfare decreases among studies using experimental method compared to those that employed a nonexperimental approach. This is a surprising result. We believe this result could also be attributable to the measurement errors associated with the computation of indicators of household welfare measures used in the primary studies. In both tables, results also show that studies that adopt kernel and nearest neighbor matching techniques have significant negative effect on r i relative to those that employ a radius caliper matching technique. Finally, results show that the coefficient of standard error is nonsignificant in both tables. This implies that publication bias is absent in the selected studies once we account for study characteristics in the multivariate setting.
Concluding Remarks
The study provides insights into whether or not adoption of agricultural innovations has a significant impact on indicators of farm production and household welfare measures in SSA. To address this, we carried out an MRA on 92 studies published between 2001 and 2015 that focused on the impact of adopting agricultural innovations on a range of outcome variables representing farm production and household welfare in SSA. The studies yielded 355 partial correlation coefficients for our analysis.
Using univariate MRA and funnel plots, we examined the possibility of publication bias in the selected studies. The results show evidence of publication bias that attenuates once we account for study attributes in the multivariate MRA. Also, using univariate MRA, our results show that adoption of agricultural innovations has a significant positive relationship with indicators of the farm production and household welfare measures considered in the primary studies. However, the extent or magnitude of the relationship is small and thus, weak. Otsuka and Muraoka (Reference Otsuka and Muraoka2015) identified lack of efforts to develop and disseminate an integrated package of new and useful technologies as one of the possible reasons for the weak impact of agricultural innovation adoption in SSA. Also, there is an ongoing debate among development economists on whether or not institutional constraints such as credit markets, poor transportation networks, weak extension services, and absence of private input retailers, are responsible for the failure of agricultural GR in SSA (The New York Times 2015). To this end, we believe that the lack or combinations of these observations are likely to explain the weak relationship between the adoption of agricultural innovation and the outcome measures identified in the sampled studies. This, however, requires future research because this is beyond the scope of the present study.
Study attributes that explain differences in estimates of the relationship between adoption of agricultural innovation and farm production measures based on the estimated multivariate meta-regression include the use of cross-sectional data, experimental method, and endogenous switching. Results based on the estimated multivariate meta-regression reveal that the publication outlets, use of cross-sectional data, experimental survey methods, nature of technology, use of endogenous switching regression, kernel, and nearest neighbor matching techniques are important in explaining the relationship between adoption of agricultural innovation and household welfare. We believe these findings will provide better insight into the factors that improve the modeling of the impact of adopting agricultural innovations in future research. It will contribute to better-informed policy in the region and elsewhere across the globe. There is also evidence that the impact of adopting agricultural innovations varies across different regions in SSA when farm production is considered as a dependent variable. However, we have no evidence to support regional variation when household welfare measures are considered as outcome variables.
Supplementary material
The supplementary material for this article can be found at https://doi.org/10.1017/age.2018.10
Appendix
Table A. List of key words use to search the database consulted in the study

Table B. Summary statistics of the variables from the case studies


 Open access