Background
Nearly all member countries of the European Union (EU) have an ageing population. The portion of the population in the age range 15–64 years (the so-called working age) relative to the non-working population is decreasing in the EU as a whole. In 2030, two people of working age will be available to support one retired person, compared to a ratio of four to one in the year 2011 (European Parliament 2011). This situation, which is not considered economically sustainable, is evoking political action throughout Europe, so as to ensure that a large enough portion of people in the workforce work more years. This means to continue working up to (and even beyond) the official pension age – which is currently being pushed upwards across the EU.
Also Sweden faces a progressive decline in the ratio between the working and the non-working population; there is political agreement that a pension reform is unavoidable. The Swedish Pension Age Commission (2012) recommended that age limits in the institutional frameworks regulating pension benefits be adjusted according to the prospective changes in the expected longevity.
The employment rate among 55–64-year-old Europeans has indeed been increasing steadily in the last few years, even in times of economic crisis (Eurostat Labour Force Survey 2014); it reached 57.5 per cent for men and 43.3 per cent for women in 2013 (in the 28 EU member states). There are, however, vast differences in the employment patterns of the 55–64 age group between member countries. Sweden has the highest work participation in the EU among men and women in this age group, 76.9 and 73.8 per cent, respectively (Organisation for Economic Co-operation and Development 2015). The difference between genders in this respect is small in Sweden compared to most countries. Eurofound (2012) noted in its fifth Working Conditions Survey ‘that the distribution of employment by occupational category highlights huge contrasts between men and women among salaried workers aged 50 years and over’.
The fact that the effective retirement age differs between countries has in economic literature mostly been attributed to institutional differences in the social security and pension systems, affecting the individuals’ incentives to retire (e.g. Engelhardt Reference Engelhardt2012; Gruber and Wise Reference Gruber and Wise1998). However, Sauré and Zoabi (Reference Sauré and Zoabi2012), studying the occupational distribution in different countries, and using a wide set of occupational definitions, found that a large portion of the observed cross-country variation in retirement age could be explained by differences in the occupational distribution of these countries. They note that ‘the age of retirement is occupation specific and originates in intrinsic characteristics of each occupation such as physical requirements or the pace at which job-specific knowledge depreciates’. In other words, the effects of the institutional frameworks may be over-estimated, whereas working life-related factors remain important, having a large influence on exit age and thereby on the nation's effective retirement age.
It is helpful to categorise persons approaching official retirement age into those who wish, or do not wish, and those who can, or cannot, continue working into old age. Individual factors such as health and skills, economy and family situation have a significant influence (Nilsson, Rignell-Hydbom and Rylander Reference Nilsson, Rignell-Hydbom and Rylander2011). However, work conditions, including working hours, as well as work motivation and the attitude of managers are important predictors. So even though the reasons behind the differences in work participation between occupations may be manifold, they are likely to mirror differences in work-life conditions. ‘Push’ factors (Gruber and Wise Reference Gruber and Wise1998) forcing individuals into involuntary retirement include a wide range of factors that a person is exposed to at the societal as well as at the company level. Many early exit occupations stand out as high-demand and high-risk jobs with respect to physical exposures in the immediate work environment (Swedish Work Environment Agency 2014). It has been found in many studies that impaired health, affecting the work ability in relation to job demands, is one of the major reasons behind early exit from the labour market (for reviews, see e.g. Ilmarinen Reference Ilmarinen2006; van Rijn et al. Reference van Rijn, Robroek, Brouwer and Burdorf2014). Moreover, the health gain pattern in the population is heterogeneous. The decrease in mortality since the 1970s in Sweden tends to be greater for the high than for the medium- and low-education groups (Shkolnikov et al. Reference Shkolnikov, Andreev, Jdanov, Jasilionis, Kravdal, Vågerö and Valkonen2012), and the standardised mortality rate before age 65 differs significantly between occupations (Statistics Sweden 2014).
The Swedish Pension Age Commission (2012) noted that work conditions may play a role for health-related exits, but refrained from recommending any substantial action so as to alleviate occupational exposures in the high-risk groups. A pertinent question is: to what extent are members of different occupational groups, and gender, likely to take advantage of an opportunity to work more years, if work-life conditions remain as is? Is there a clear distinction to be seen between blue- and white-collar occupations, as well as between men and women, in terms of work-life exit patterns?
The aims
In the present study, the following questions were addressed: ‘If you keep working in the same occupation from age 35 onwards, how many years can you be expected to remain in working life before reaching the age of 65 years, without receiving disability pension (including eventual long-term sick leave preceding pension), or die? And what is the likelihood that you will still be working at age 65?’
A primary aim was to find out the socio-economic distribution in exit patterns in blue- and white-collar occupations, and if these patterns differ with regard to gender.
Method and material
The study was undertaken in order to examine the differences between occupations in the Swedish labour market with respect to the risk of leaving working life prematurely. The analysis was carried out by calculation of work-life lengths (Kadefors and Wikman Reference Kadefors and Wikman2011) in occupations identified according to the three-digit SSYK code (Swedish Standard Classification of Occupations), based on ISCO-88 (International Labour Organization 1990), with special consideration paid to differences between males and females. Furthermore, the SSYK code was employed as a point of departure in the analysis of socio-economic conditions related to exits in different occupations. The classification between blue- and white-collar occupations was undertaken using a proposed translation key developed by Statistics Sweden (Thell Reference Thell2015), based on a set of criteria including nature of work, required length of education and management responsibilities.
Creation of tables of work-life lengths are based on an established methodology in demographics, applied here in working life. Calculation of expected life length in population statistics are based on data concerning the number of deaths in different age groups. Likewise, calculations of expected remaining work-life length are based on data of the exits from working life. These calculations comprise death, disability pension and long-term sick leave preceding disability pension (Statistics Sweden 2014).
The study was based on the Swedish national labour statistics, covering all employees who had an occupational definition in November 2006. Another inclusion criterion was to be in the age range 35–64 years during the measurement period of 2007–2010, and not having emigrated or died before 2007, the start of the measurement period. Once a person left the labour market because of disability pension, age pension or emigration, it was assumed that he or she did not return to work. The year 2011 was used as a reference in order to check if a person who was absent due to illness in the period 2007–2010 might have received disability pension in 2011; in this case, he or she was included in the study population. If a person had chosen premature age pension, or emigrated, he or she was censored from the study population.
Exits from working life, due to death or disability pension, were mapped for each occupational group, one-year age group and gender every year during the four-year measurement period, and the absolute risks for exits were calculated for all ages from 35 years to the middle of the year of the 65th birthday. Applying these risks consecutively on each group made it possible to calculate partial life expectancy for the specified age interval in a common life table with a standard population. Based on the calculations in the life table, the percentages still working, or surviving, to the middle of the year of the 65th birthday were reported. This depicts the likelihood for a person of age 35 belonging to a specific occupational group to still be working at age 65 when hypothetically exposed to the exit risks of all one-year age groups in the period 2007–2010. ‘Survivors’ are those who remain working at age 65; if no one in an occupational cohort dies or receives disability pension, the percentage survivors in the group equals 100.
The age distribution of mapped exits provides the basis for calculation of the expected number of years to still be working of a 35-year-old person belonging to a particular occupational group. It is to be expected that the age distribution differs between occupational groups. However, since exit mappings in each occupation are made as a proportion of the total population in each age group, such variability does not affect the results.
Exiting before age 65 means that a person faces ‘lost years’ in working life. At age 35, it remains 29.5 years for an individual to reach the middle of the year of the 65th birthday, the Swedish pension norm. Here, the number of ‘lost years’ is 29.5 years minus the expected number of years entailed in the analysis. The number of expected years is similar to the demographic measure ‘partial life expectancy’ but with disability pension as an additional source of reduced survival besides death.
In the data processing, focus was on the largest occupational groups; hence, the 40 most common occupations in men and women, respectively, were analysed, out of the 112 occupations listed according to SSYK3. This means that the group sizes in the study are large (at least 3,000 observations in each group), and uncertainty is therefore of minor concern. The sample (the 40 most common occupations) represents 3,355,000 persons, which is 82 per cent of the total working population. In the analysis concerning male and female survivors in work life at age 65, a higher aggregation level (SSYK2; 14 occupational groups) was applied, covering 86 per cent of the total working population. This approach ensured that study groups were large enough to warrant comparisons, even where there was an unbalance between genders in the occupational groups.
Results
Results show that work-life lengths differ markedly between occupations. Figures 1 and 2 show for men and women the number of ‘lost years’, i.e. the number of years that people are expected to exit from the labour market before reaching age 65. The difference in ‘lost years’ between the earliest and the latest exit jobs amounts to 4.69 years for men and 5.62 years in women; in both cases ‘Other sales and services elementary occupations’ compared to ‘College, university and higher education teaching professionals’.
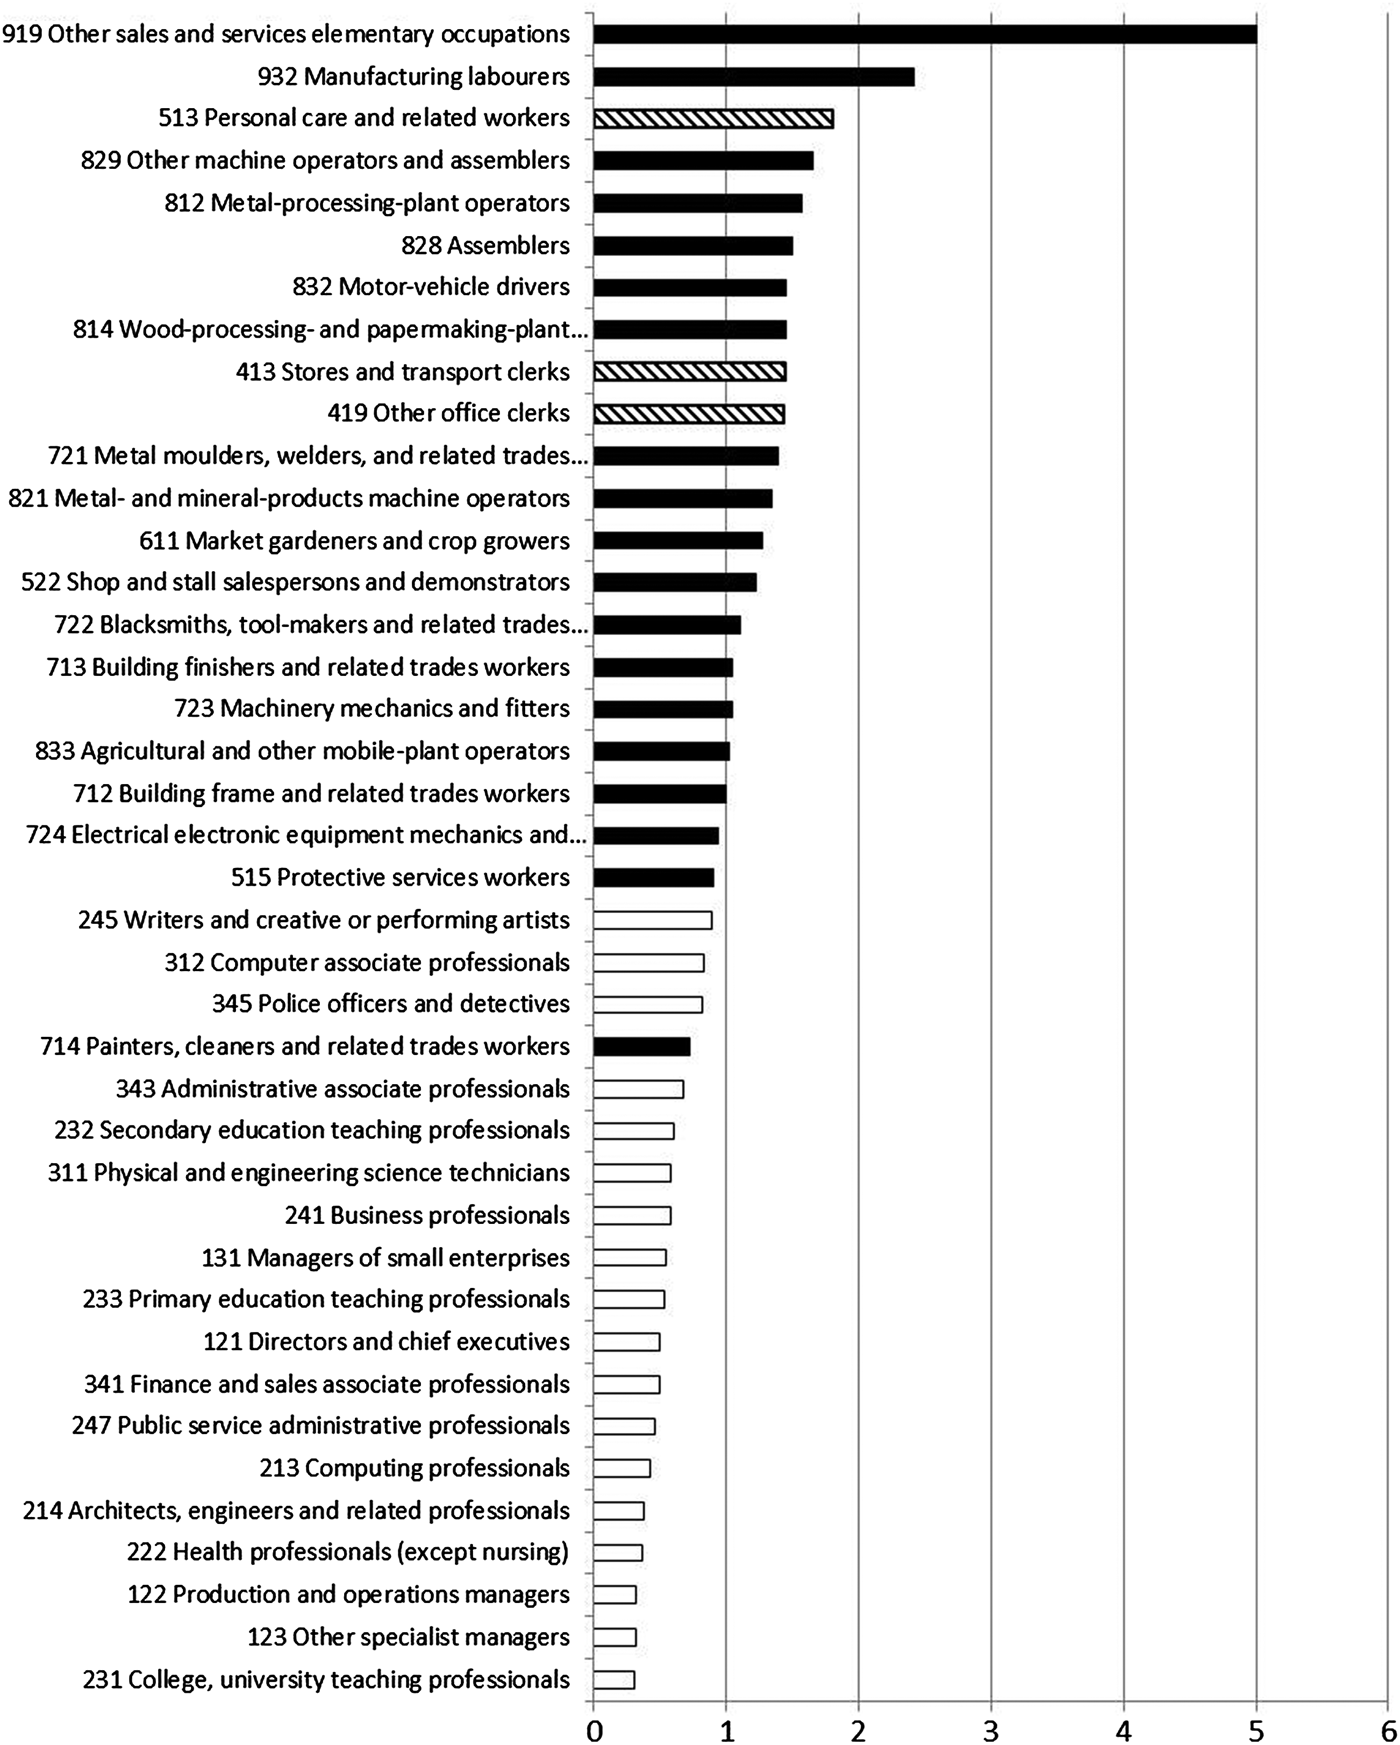
Figure 1. ‘Lost years’ before age 65 in the 40 most common occupations in men.
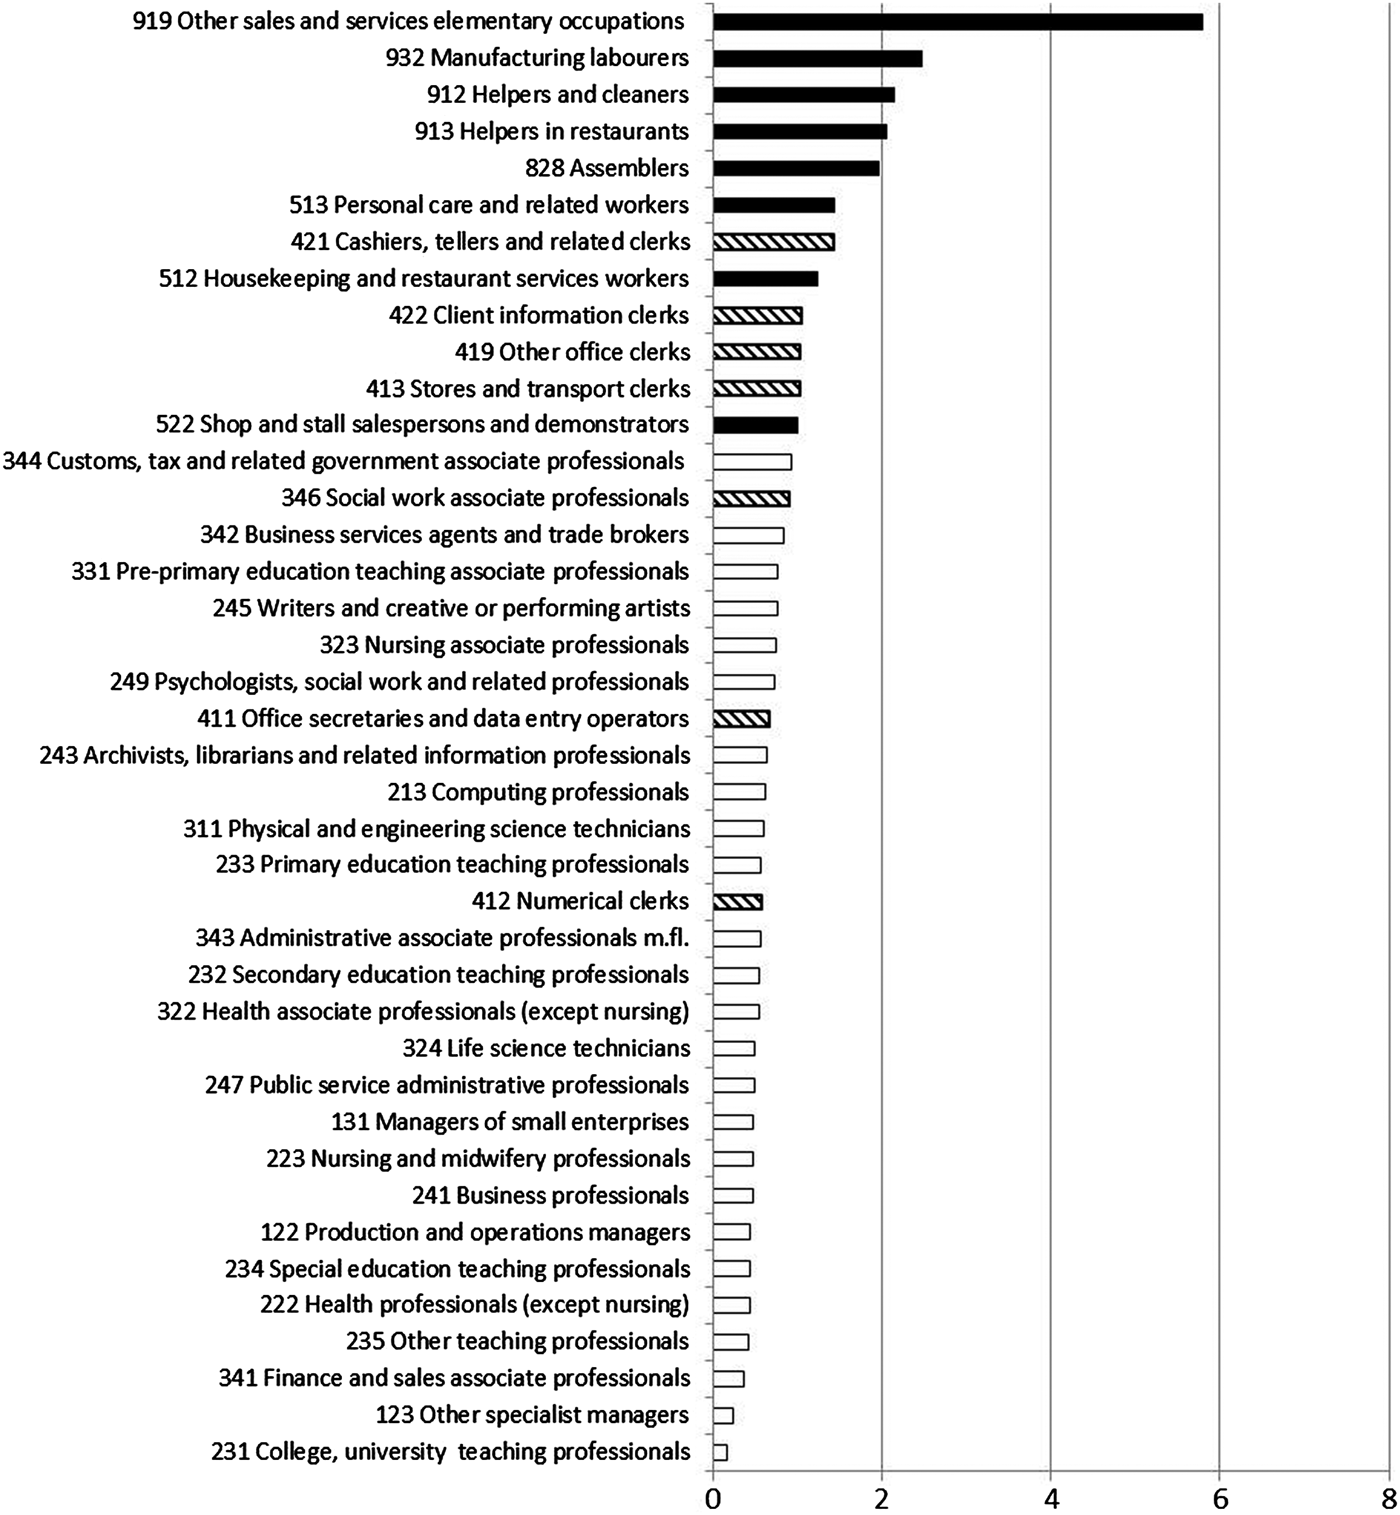
Figure 2. ‘Lost years’ before age 65 in the 40 most common occupations in women.
In Figures 1 and 2, the socio-economic divide between blue- and white-collar occupations is striking. Among men and in women as well, out of the ten occupations with the earliest exits, seven are blue collars and three are mixed blue and white collars. All ten occupations with the latest exits are white collars in both gender groups.
The gender difference across all occupations was marginal: the number of lost years for men amounted to 1.00, compared to 1.02 for women. The percentage of survivors was 58.6 for men and 63.1, even higher, for women.
There were large differences in the percentage of survivors between occupational groups: whereas in the blue-collar groups about 50 per cent or less are expected to still be working at age 65, there are many white-collar occupations with more than 60 per cent ‘survivors’, in men and women alike (Table 1). Even though the survival rates among men and women were correlated, there were marked differences between occupational groups. The percentage of women still working at age 65 was lower in blue-collar jobs (SSYK2 82, 91, 93) than in white-collar and mixed occupations. But among men, also SSYK2 groups 41 (mixed), 51 (mixed) and 52 (white collar) stand out as jobs characterised by low survival rates (see Figure 3).
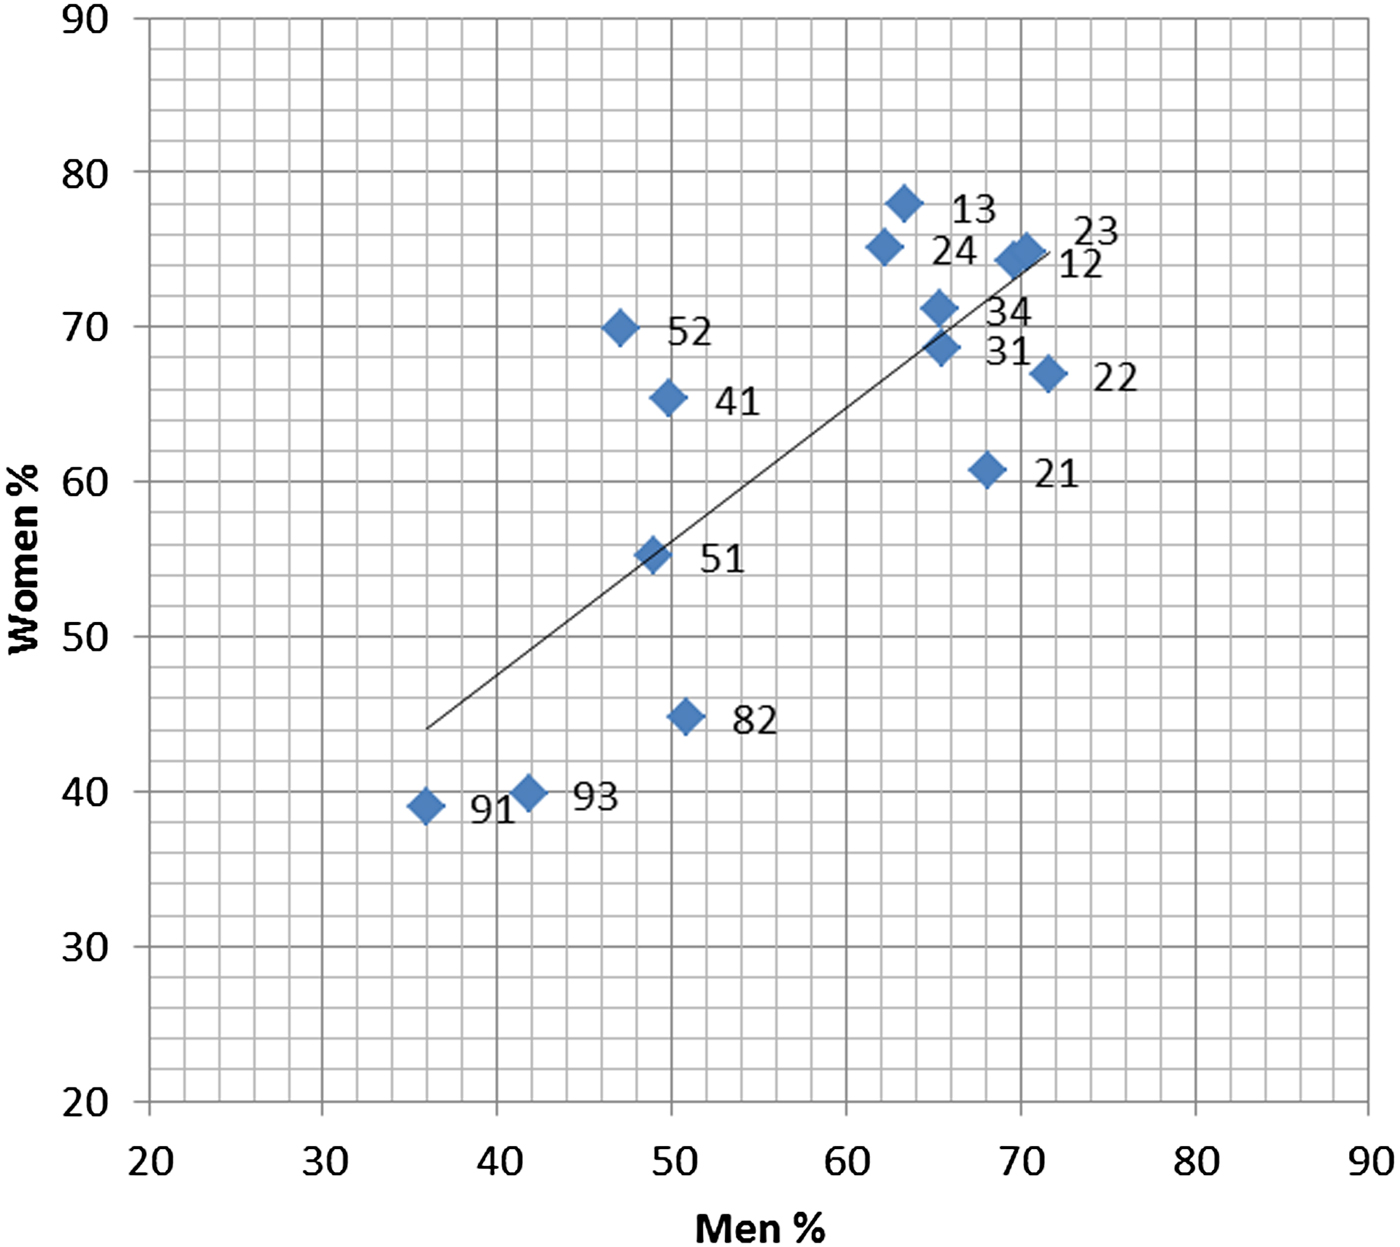
Figure 3. Percentage survivors at age 65 in the most common occupational groups (occupations according to SSYK2; see Table 1) in men and women.
Table 1. Population proportion of genders in the 14 most common occupational groups (Swedish Standard Classification of Occupations SSYK2), and percentage survivors at age 65 in men and women

Notes: W: white collars. B: blue collars. M: mixed.
The two measures do not entail exactly the same information: whereas lost years mirror the average exit age, the survivor measure reflects the number of persons in a certain occupation that are still working at age 65, irrespective of exit age. Figure 4 exemplifies for two occupations, paintersFootnote 1 and craft printers,Footnote 2 the data-sets from which the two measures are calculated. Lost years were 0.72 and 1.19 years, respectively, whereas the percentage of survivors amounted to 70.7 and 41.9 in the two occupations. It is seen that whereas exits among painters augment steadily in the entire age range 35–62 years, craft printers have a larger number of exits in the age range 56–61 years. It is typical that exits increase among older persons.
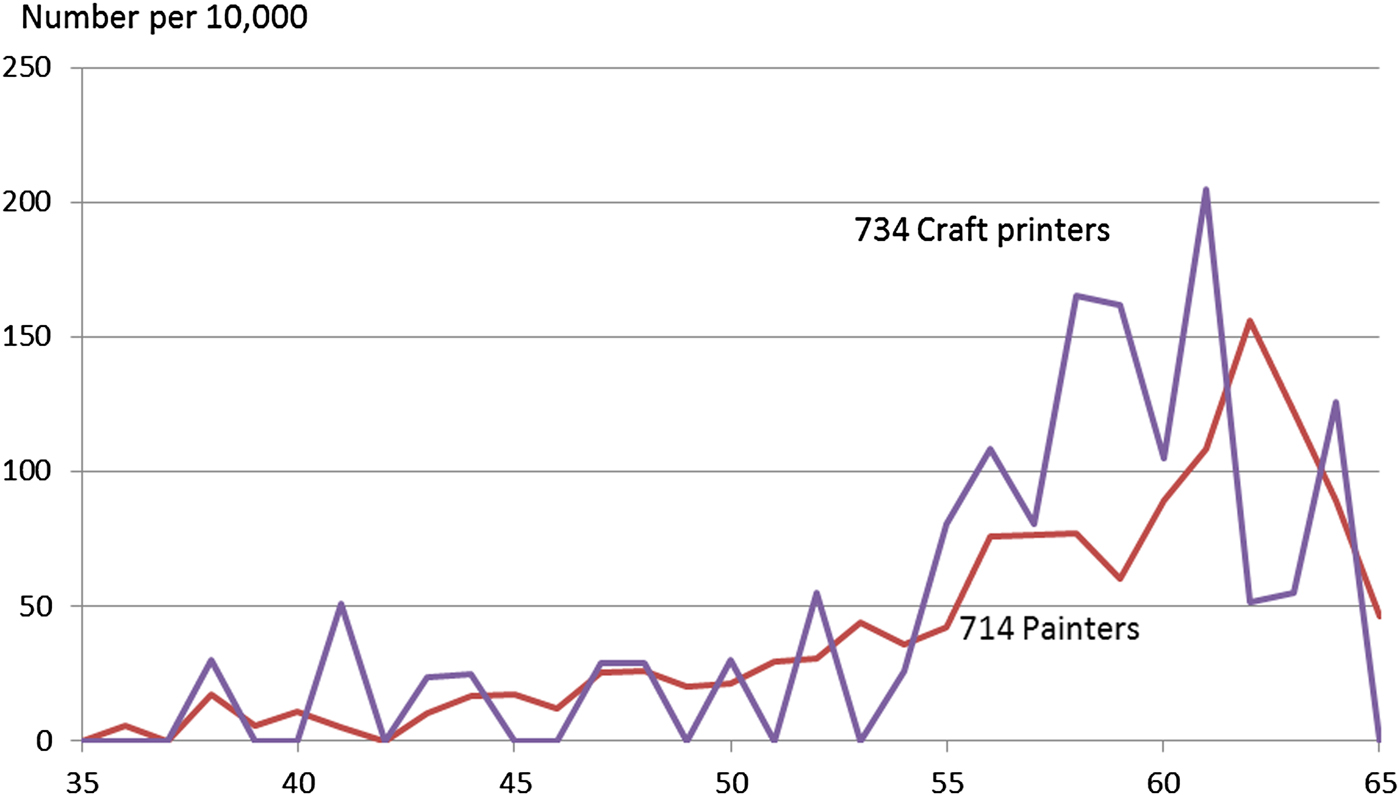
Figure 4. Age distribution of exits from work in the occupational cohorts craft printers and painters (males), mapped during the measurement period 2005–2010.
Discussion
Methodological considerations
The present study was based on statistics covering the entire Swedish working population. Compared to previous studies of occupationally related exit ages, the present approach made possible a detailed breakdown of occupations; for instance, in the Eurofound survey of 2012, occupations were grouped into five categories only, according to the one-digit ISCO-08 classification (International Labour Organization 1990). Another main asset of the methodology applied here is that several national registers were pooled in order to create a better understanding of the socio-economic work-life exit patterns than is possible by studying retirement statistics only.
Sweden does not have a formal retirement age. Nevertheless, there is a strong retirement norm in the population. The Swedish Pension Age Commission (2012) noted, ‘More than ten years after the pension reform, it remains an established tradition to retire at age 65. About 70 per cent of those born 1942 chose to retire at 65, even though formal pension age was abolished in connection with the pension reform’. Taking this established behavioural pattern into account, we chose here to calculate ‘lost years’ as the number of years before reaching age 65 that people exit the labour market. This also made possible comparison to a similar study carried out in 2006 (Kadefors and Wikman Reference Kadefors and Wikman2011), where exits before 65 years of age were mapped.
Disability pension can be granted on the condition that there is a permanent reduction of work ability due to illness. The measure reflects the health status of the applicant, in relation to work demands. This means that ‘lost years’, calculated on the basis of disability pension and long-term sick leave statistics, is basically a health-related measure.
The study population comprised those who had an occupational definition in 2006, across the age range 35–64 years. It needs to be taken into account that there is a certain mobility between occupations. In particular, occupational exits (not necessarily the same as work-life exits) may occur in occupations characterised by work conditions imposing high levels of stress or high physical demands, creating a healthy worker effect on the study population. This may lead to conservative measures with respect to occupational differences concerning exit age. Estimation of this effect is difficult, however, since occupational mobility may take place without changing employer, and even changing branch may not imply change of occupation. The Swedish National Labour Market Board (2003) reported that about 40 per cent of employer changes also meant change of occupation. However, older people were in general less inclined to change employer and tended to remain in the same occupation even when switching to a new employer or branch; this is the reason why we chose to study exits starting at age 35 and not earlier. There is a lack of updated statistics showing the occurrence of occupational change among older employees.
Occupation and exits
It is demonstrated that work-life lengths in the Swedish labour market differ markedly between occupations defined according to the SSYK. It is seen, in particular, that those working in manual and service jobs exit work earlier than those working in academic jobs. The differences comply with a grouping of occupations into white and blue collars, using a proposed translation key linking occupational code to socio-economic group (Thell Reference Thell2015). The results are unambiguous and demonstrate a current socio-economic dichotomisation between exit patterns in jobs characterised by requirements of formal education, character of work and management responsibilities. We found that the differences in the number of ‘lost years’ before age 65 amounted to about 4.7 years in men and 5.6 years in women, when comparing the extremes. When interpreting these differences, it should be noted that the occupation with the highest risk of early exits, ‘Other sales and services elementary occupations’ (SSYK 919), represents a group where factors such as lifestyle may play a particularly important role; for instance, this is also the occupation with the highest standardised mortality rate before age 65 (Statistics Sweden 2014). Smoking, alcohol, nutrition and physical activity in leisure time are factors that may influence the outcomes, in this and to some extent other groups as well (Robroek et al. Reference Robroek, Reeuwijk, Hillier, Bambra, van Rijn and Burdorf2013). However, a longitudinal French study comparing the importance of occupational and behavioural factors on social inequalities in mortality found that biomechanical and physical exposures, and job insecurity, had a stronger effect than behavioural factors, especially for premature mortality (Niedhammer, Bourgkard and Nearkasen Reference Niedhammer, Bourgkard and Nearkasen2011).
The number of lost years was higher in almost all occupations in 2006 (Kadefors and Wikman Reference Kadefors and Wikman2011) than in the present study. This development reflects in part that new policies introduced by the Swedish authorities have made it more difficult for applicants to be granted disability pension (Figure 5); the number of newly approved disability pensions was reduced from 48,176 in 2006 to a mere 14,369 in 2011, a reduction of 70 per cent (data source: Swedish Social Insurance Agency 2015). The number of persons choosing premature age pension, which is possible starting at age 62, has more than doubled in the time period 2006–2011 (data source: Statistics Sweden). This increase is mostly to be found in blue-collar jobs, suggesting that many of those who nowadays are denied disability pension choose early exit, even though premature age pension is very costly for the individual, affecting his or her lifelong pension benefits. Consideration may be given to the notion that whereas the measures addressed in the present study reflect involuntary exits from work life, premature age pension may be voluntary or involuntary. Exits due to premature age pension were studied and reported separately (Nilsson et al. Reference Nilsson, Östergren, Kadefors and Albin2016).
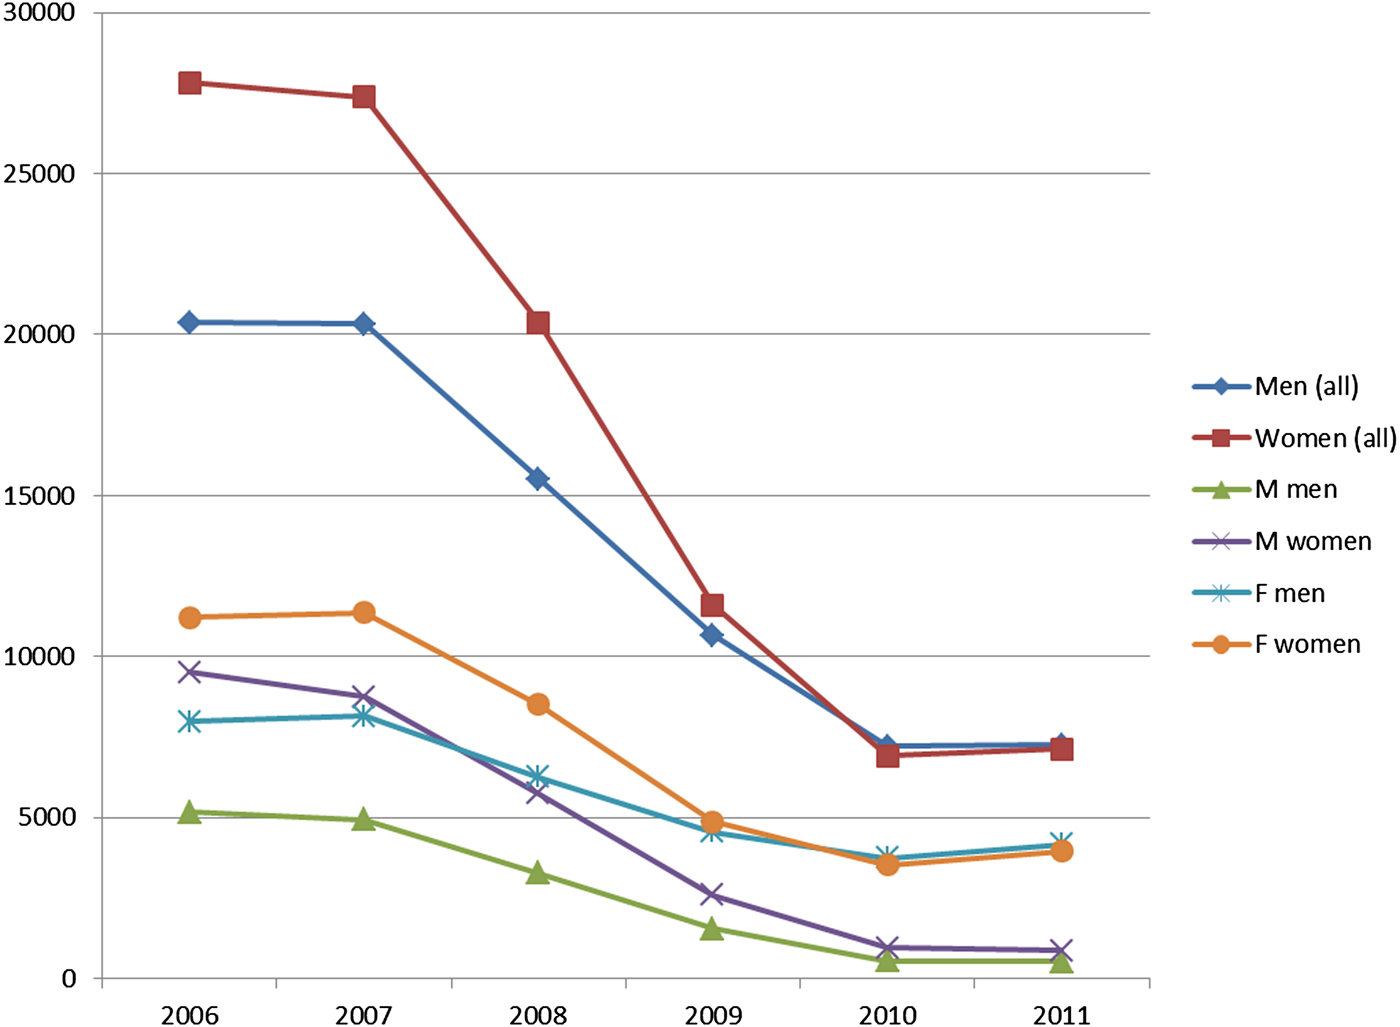
Figure 5. Number of disability pensions in Sweden granted annually in 2006–2011.
With respect to the role of occupation on exit from working life, there are many studies emphasising the significance of work-life exposures on premature retirement. In particular, occupations characterised by high exposures to musculoskeletal strain imply an elevated risk for premature retirement on health grounds generally (Mäntyniemi et al. Reference Mäntyniemi, Oksanen, Salo, Virtanen, Sjösten, Pentti, Kivimäki and Vahtera2012). For instance, Coile and Gruber (Reference Coile and Gruber2007) found a particularly strong pattern of higher retirement rates in the cleaning and building services occupations. Järvholm et al. (Reference Järvholm, Stattin, Robroek, Janlert and Karlsson2014), comparing disability pension in 22 occupational blue-collar groups within construction industry, found that those in physically demanding jobs had a higher risk of early work-life exit. They concluded that ‘work environment is an important predictor for disability pension’. In Figure 1, occupations 712 and 713, ‘Building frame and related trades workers’ and ‘Building finishers and related trades workers’, which contain a set of construction-related occupations, are found in the middle of the table. It is possible that new age management policies in the construction industry, where recruitment of skilled workers is becoming increasingly difficult, has started to affect exit ages, much in the same way as is seen in many trades in Germany (Bundesministerium für Arbeit und Soziales 2014).
Gender and exits
We found that the difference in work-life lengths between men and women was marginal. In the 2006 study, the gender difference in work-life lengths was 0.8 years (Kadefors and Wikman Reference Kadefors and Wikman2011) compared to the present 0.02 years. These figures show that the exit ages among men and women tend to equalise. This observation complies with current governmental statistics (Kirs and Karlsson Reference Kirs and Karlsson2015) concerning exits from work life due to disability pension and age pension; in 2011, women exited work at 63.8 years, compared to 63.9 years for men; they note that ‘ever since the nineties, the exit age difference has been approximately one year’. In part, this development reflects a dramatic reduction of newly approved disability pensions in Swedish men and women: as seen in Figure 5, in 2006, about 30 per cent more women than men received disability pension, whereas in 2011 there was no longer any difference (data source: Swedish Social Insurance Agency 2015). The major diagnostic chapters according to ICD-10-SE were F00–F99 (mental) and M00–M99 (musculoskeletal illnesses). In the time period 2006–2011, the gender difference in number of approved disability pensions in these chapters diminished gradually and was gone in 2011. It is clear that the new, more restrictive disability pension policies introduced have had a more negative effect on female applicants generally.
What factors could be of significance explaining the very high, and further increasing, work participation among older Swedish women? A general observation across the EU is that women in all age groups more often work part-time (e.g. Eurofound 2012). This is the case also in Sweden. Even though the high degree of involuntary part-time work among women remains an aspect of gender discrimination in working life, access to voluntary part-time work may increase wellbeing and improve work ability, and may protect against early exits (Büsch, Dittrich and Lieberum Reference Büsch, Dittrich and Lieberum2010; Delsen Reference Delsen1990; Nikolova and Graham Reference Nikolova and Graham2014). This could partially explain the finding that in some occupational groups men exit earlier than women (Figure 3). These groups are all female dominated, and there is a large percentage of women working part-time in the occupations covered, comprising trades such as office secretaries, shop attendants, hairdressers and waitresses. Another aspect is that years of part-time work in the course of a working life result in lower pension benefits; this creates an economic incentive for working up to the official pension age for those who ‘can and want to’. However, these conditions are true not only in Sweden, but in the EU at large, which means that also other factors must be sought in order to explain why the behaviour in men and women vis-à-vis exit from work now tends to equalise in Sweden in particular. Institutional frameworks may play a role; for instance, one factor may be the societal access to daycare for children and homecare for the elderly, which means that older individuals do not necessarily have to refrain from working in order to take care of their grandchildren, or their own parents.
Soidre (Reference Soidre2005) found that the strengths of various push and pull factors affecting retirement preferences were gender-specific: for women, a trying job tended to push them out of the labour market. Women felt less inclined to work after age 65 if they felt superfluous at work, and if they had a positive attitude to the private sphere. Men with a socially rewarding job tended to remain longer in the labour force than other groups. Men who worked mainly for economic reasons were more positive to an early exit; likewise, those who felt that they were unappreciated at work preferred early retirement. Büsch, Dittrich and Lieberum (Reference Büsch, Dittrich and Lieberum2010) found that high motivation was linked to the desire for continued employment among men; this did not apply to women; for them, work ability was the decisive criterion. Significant gender differences were also found by Ahlberg et al. (Reference Ahlberg, Marklund, Stenlund and Torgén2002) in a survey of Swedish working people in the age range 25–64 years. Among women, living alone as well as poor social support at work were factors that were negatively correlated to an expectancy of late exit. In men, negative factors included high physical workload, poor health and negative experiences of organisational changes at work. Only about 10 per cent of the respondents declared that they would consider continuing to work after official pension age. Those who were willing to do so included in particular white-collar professionals in high-demand, high-control jobs, whereas many blue-collar workers hoped for an early exit from work. In a study comprising Swedish men and women aged 45–60 years, it was found that high psychological demands, low-decision latitude and job strain were all confirmed as independent risk factors for subsequent disability pension. Women were more exposed to job strain than men, and the negative importance on disability pension of job strain was higher among women than men of the same age (Canivet et al. Reference Canivet, Choi, Karasek, Moghaddassi, Staland-Nyman and Östergren2013).
These findings comply with the demand–control model (Karasek Reference Karasek1979) as well as the mental/physical demand–experience model; here even high demands at work can be compensated for by organisational freedom and performance benefits from experience (Warr Reference Warr, Dunette and Hough1994, Reference Warr, Cooper and Robertson2001).
A majority of the push factors listed above relate to poor conditions at work. One possible explanation of the late exit of Swedish working women could be an improvement of workplace conditions generally in the last few years, affecting women more than men. Is such a development actually taking place? According to a survey published by the Swedish Work Environment Agency (2014), this does not appear to be the case, even though the work environment in Sweden is considered to be of a comparatively high standard in an international perspective (Eurofound 2012). Men are more exposed to physical agents, but women more than men feel that they have too much to do; they have more difficulties to sleep due to thoughts about work; and they feel more often threatened at work. There is a need for further research in order to clarify how these and other work environment exposures relate to work-life exit in both genders.
Implications
The present study showed that work-life exit ages in Sweden increased markedly in the time period 2006–2011, in virtually all occupations, and among men and women as well. This development complies with the governmental endeavour to increase the number of work years in the Swedish economy, thereby addressing the demographic challenge and securing financing of the pension system. Actions taken already include strengthening the financial incitements to work longer, and curtailing possibilities for disability pension. More of the same is likely to follow, according to the recommendations made by the parliamentarian Swedish Pension Age Commission (2012). But in the light of the present study, how are these incitements likely to work out? A major finding in the present study was that the exit patterns of blue and white collars prevail. Also those who presently exit work before age 65, for reasons of lacking adequate health or competence, are unlikely to be able to make use of enhanced opportunities to work into higher age. Reforming working life so as to entail preserved continued employability in all occupational groups may turn out to be a necessity.
In an international perspective, the experiences from the Swedish development may be of note, since Sweden has an already high, and still increasing, work participation among older people. Can opening up for those who can and want to continue working into even higher age take place without further widening the gap between socio-economic groups? It remains to be seen if Sweden might serve as a good or bad example in this respect.
Acknowledgements
The contributions made by Örjan Hemström and Stefan Vikenmark of Statistics Sweden in the course of the study are gratefully acknowledged. Financial support was given by AFA Insurance (project number 120119) and the Swedish Research Council for Health, Working Life and Welfare (Forte) (2012-1696; 2013-2300).


