Skip to main content Accessibility help
×
Hostname: page-component-745bb68f8f-hvd4g Total loading time: 0 Render date: 2025-01-23T00:06:10.730Z Has data issue: false hasContentIssue false

Bibliography

Published online by Cambridge University Press:  10 March 2022

Jose Manuel Magallanes Reyes
Affiliation:
Pontificia Universidad Católica del Perú and University of Washington
Get access

Summary

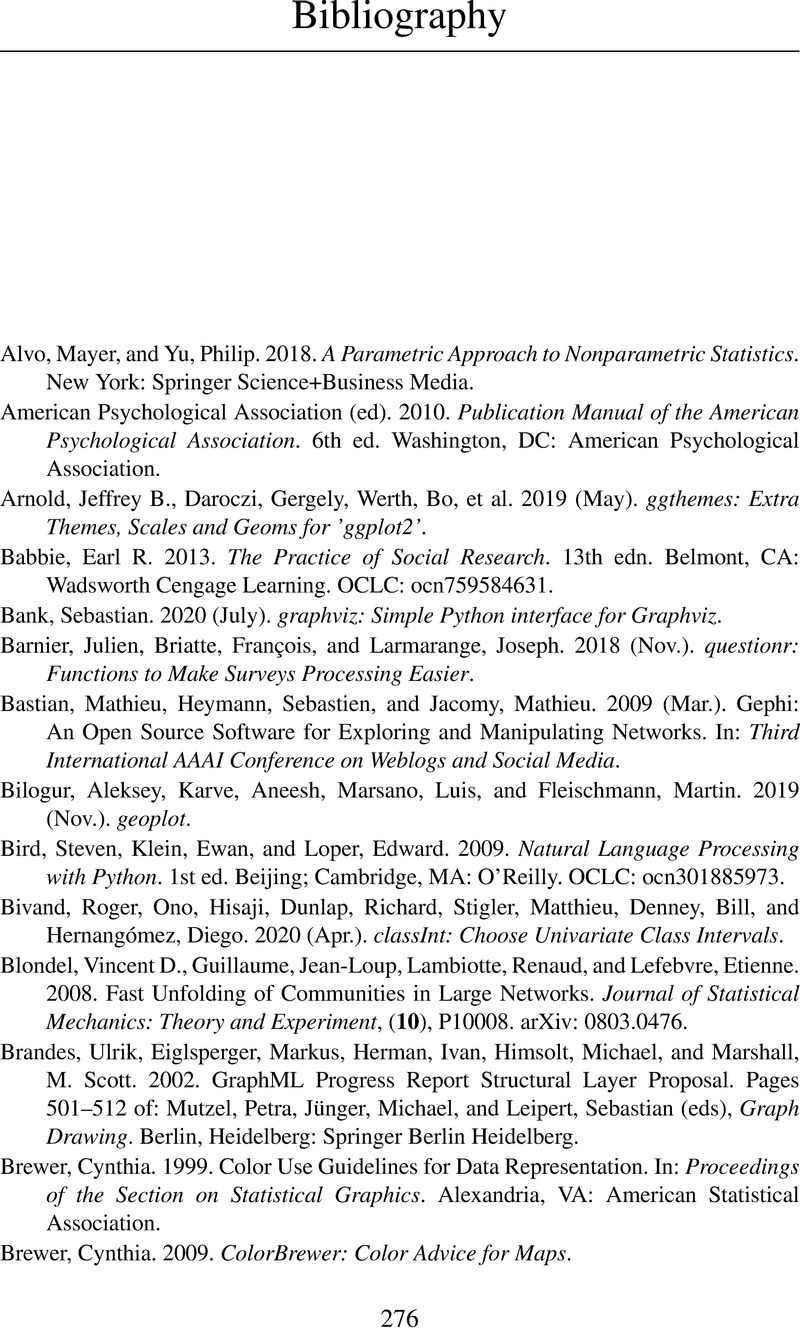
Image of the first page of this content. For PDF version, please use the ‘Save PDF’ preceeding this image.'
Type
Chapter
Information
Data Visualization for Social and Policy Research
A Step-by-Step Approach Using R and Python
, pp. 276 - 281
Publisher: Cambridge University Press
Print publication year: 2022

Access options

Get access to the full version of this content by using one of the access options below. (Log in options will check for institutional or personal access. Content may require purchase if you do not have access.)

References

Alvo, Mayer, and Yu, Philip. 2018. A Parametric Approach to Nonparametric Statistics. New York: Springer Science+Business Media.CrossRefGoogle Scholar
American Psychological Association (ed). 2010. Publication Manual of the American Psychological Association. 6th ed. Washington, DC: American Psychological Association.Google Scholar
Arnold, Jeffrey B., Daroczi, Gergely, Werth, Bo, et al. 2019 (May). ggthemes: Extra Themes, Scales and Geoms for’ggplot2’.Google Scholar
Babbie, Earl R. 2013. The Practice of Social Research. 13th edn. Belmont, CA: Wadsworth Cengage Learning. OCLC: ocn759584631.Google Scholar
Bank, Sebastian. 2020 (July). graphviz: Simple Python interface for Graphviz. Google Scholar
Barnier, Julien, Briatte, François, and Larmarange, Joseph. 2018 (Nov.). questionr: Functions to Make Surveys Processing Easier.Google Scholar
Bastian, Mathieu, Heymann, Sebastien, and Jacomy, Mathieu. 2009 (Mar.). Gephi: An Open Source Software for Exploring and Manipulating Networks. In: Third International AAAI Conference on Weblogs and Social Media.CrossRefGoogle Scholar
Bilogur, Aleksey, Karve, Aneesh, Marsano, Luis, and Fleischmann, Martin. 2019 (Nov.). geoplot.Google Scholar
Bird, Steven, Klein, Ewan, and Loper, Edward. 2009. Natural Language Processing with Python. 1st ed. Beijing; Cambridge, MA: O’Reilly. OCLC: ocn301885973.Google Scholar
Bivand, Roger, Ono, Hisaji, Dunlap, Richard, Stigler, Matthieu, Denney, Bill, and Hernangómez, Diego. 2020 (Apr.). classInt: Choose Univariate Class Intervals.Google Scholar
Blondel, Vincent D., Guillaume, Jean-Loup, Lambiotte, Renaud, and Lefebvre, Etienne. 2008. Fast Unfolding of Communities in Large Networks. Journal of Statistical Mechanics: Theory and Experiment, (10), P10008. arXiv: 0803.0476.Google Scholar
Brandes, Ulrik, Eiglsperger, Markus, Herman, Ivan, Himsolt, Michael, and Marshall, M. Scott. 2002. GraphML Progress Report Structural Layer Proposal. Pages 501512 of: Petra, Mutzel, Michael, Jünger, and Sebastian, Leipert (eds), Graph Drawing. Berlin, Heidelberg: Springer Berlin Heidelberg.CrossRefGoogle Scholar
Brewer, Cynthia. 1999. Color Use Guidelines for Data Representation. In: Proceedings of the Section on Statistical Graphics. Alexandria, VA: American Statistical Association. Google Scholar
Brewer, Cynthia. 2009. ColorBrewer: Color Advice for Maps.Google Scholar
Brewer, Cynthia A., and Pickle, Linda. 2002. Evaluation of Methods for Classifying Epidemiological Data on Choropleth Maps in Series. Annals of the Association of American Geographers, 92(4), 662681.CrossRefGoogle Scholar
Butler, H., Daly, M., Doyle, A., Gillies, S., Hagen, S., and Schaub, T. 2016 (Aug.). The GeoJSON Format. Tech. rept. RFC7946. RFC Editor.Google Scholar
Carrera, Ero. 2018 (Dec.). pydot: Python interface to Graphviz’s Dot. Google Scholar
Caswell, Thomas A., Droettboom, Michael, Hunter, John et al. 2019 (July). matplotlib.Google Scholar
Chen, J. J. 2018 (Feb.). gglorenz: Plotting Lorenz Curve with the Blessing of’ggplot2’.Google Scholar
Cioffi-Revilla, Claudio A. 2014. Introduction to Computational Social Science: Principles and Applications. London: Springer Verlag.CrossRefGoogle Scholar
City of Seattle. 2019 (Dec.). Crime Data/City of Seattle Open Data portal.Google Scholar
Clauset, Aaron, Newman, M. E. J., and Moore, Cristopher. 2004. Finding Community Structure in Very Large Networks. Physical Review E, 70(6).Google Scholar
Clayton, Mike. 2018 (May). The Pareto Principle/The 80-20 Rule.Google Scholar
Cleveland, William S., and McGill, Robert. 1984. Graphical Perception: Theory, Experimentation, and Application to the Development of Graphical methods. Journal of the American Statistical Association, 79(387), 531.Google Scholar
Cook, R. Dennis. 1979. Influential Observations in Linear Regression. Journal of the American Statistical Association, 74(365), 169.Google Scholar
Csardi, Gabor, and Nepusz, Tamas. 2006. The igraph software package for complex network research. InterJournal 9.Google Scholar
Cytoscape Consortium. 2020 (Sept.). cytoscape/cytoscape. original-date: 2013-01-16T22:12:17Z.Google Scholar
Dorin, Federico, Perrotti, Daniel, and Goldszier, Patricia. 2020. Index numbers and their relationship with the economy. OCLC: 1191896788.Google Scholar
Dunnington, Dewey. 2020 (Sept.). ggspatial. original-date: 2016-07-11T21:06:12Z.Google Scholar
Ellson, John, Gansner, Emden R., Koutsofios, Eleftherios, North, Stephen C., and Woodhull, Gordon. 2003. Graphviz and dynagraph - static and dynamic graph drawing tools. Pages 127148 of: Graph Drawing Software. Springer-Verlag.Google Scholar
Environmental Systems Research Institute. 1998. ESRI Shapefile Technical Description. July, 34.Google Scholar
Fisher, Walter D. 1958. On Grouping for Maximum Homogeneity. Journal of the American Statistical Association, 53(284), 789798.Google Scholar
Flyamer, Ilya. 2019 (Aug.). adjustText. original-date: 2016-01-10T02:11:06Z.Google Scholar
Fortunato, Santo. 2010. Community detection in graphs. Physics Reports, 486(3–5), 75174.Google Scholar
Fox, John, and Weisberg, Sanford. 2019. Appendix -Nonparametric Regression in R. Page 17 of: An R companion to applied regression, 3rd ed. Los Angeles, CA: SAGE.Google Scholar
Fruchterman, Thomas M. J., and Reingold, Edward M. 1991. Graph Drawing by Force-Directed Placement. Software: Practice and Experience, 21(11), 11291164.Google Scholar
Gansner, Emden R., Koren, Yehuda, and North, Stephen. 2005. Graph drawing by stress majorization. Pages 239250 of: János, Pach (ed.), Graph Drawing. Berlin, Heidelberg: Springer Berlin Heidelberg.Google Scholar
Gini, Corrado. 1912. Variabilità e mutabilità: contributo allo studio delle distribuzioni e delle relazioni statistiche. Tipogr. di P. Cuppini. Google-Books-ID: fqjaBP-MxB9kC.Google Scholar
Gini, Corrado. 1921. Measurement of Inequality of Incomes. The Economic Journal, 31(121), 124.CrossRefGoogle Scholar
Grey, Kenith. 2018 (Dec.). ggQC: Quality Control Charts for ‘ggplot’.Google Scholar
Grolemund, Garrett, and Wickham, Hadley. 2011. Dates and Times Made Easy with lubridate. Journal of Statistical Software, 40(3).Google Scholar
Hagberg, Aric, Schult, Dan, and Swart, Pieter. 2020 (Aug.). networkx/networkx. original-date: 2010-09-06T00:53:44Z.Google Scholar
Hickey, Walt. 2013 (June). The Worst chart in the world. Google Scholar
Hill, Aaron, and Roesslein, Joshua. 2020 (July). tweepy/tweepy: Twitter for Python! Google Scholar
Hunter, John D. 2007. Matplotlib: A 2D Graphics Environment. Computing in Science & Engineering, 9(3), 9095.CrossRefGoogle Scholar
Jenks, George F., and Caspall, Fred C. 1971. Error on Choroplethic Maps: Definition, Measurement, Reduction. Annals of the Association of American Geographers, 61(2), 217244.CrossRefGoogle Scholar
Jesus, Rogerio Prado de. 2019 (June). rogeriopradoj-paretochart - Fork from @tintrinh.Google Scholar
Jiang, Bin. 2013. Head/Tail Breaks: A New Classification Scheme for Data with a Heavy-Tailed Distribution. The Professional Geographer, 65(3), 482494.CrossRefGoogle Scholar
Jordahl, Kelsey, Bossche, Joris Van Den, Wasserman, et al. 2020 (Feb.). geopandas/-geopandas: v0.7.0.Google Scholar
Juran. 2019 (Mar.). Pareto Principle (80/20 Rule) & Pareto Analysis Guide.Google Scholar
Kabacoff, Robert. 2017. Graphical Parameters.Google Scholar
Kamada, Tomihisa, and Kawai, Satoru. 1989. An Algorithm for Drawing General Undirected Graphs. Information Processing Letters, 31(1), 715.Google Scholar
Kearney, Michael W., Heiss, Andrew, and Briatte, Francois. 2020 (Jan.). rtweet: Collecting Twitter Data.Google Scholar
Kibirige, Hassan. 2019 (Nov.). plotnine. original-date: 2017-04-24T19:00:44Z.Google Scholar
Kibirige, Hassan. 2020a (Jan.). mizani. original-date: 2016-06-30T15:02:41Z.Google Scholar
Kibirige, Hassan. 2020b (Jan.). scikit-misc. original-date: 2016-10-12T01:40:36Z.Google Scholar
Kim, Taehoon. 2015 (May). carpedm20/emoji. original-date: 2014-08-18T02:55:59Z.Google Scholar
Kroulek, Alison. 2016 (Dec.). International Marketing Cheat Sheet: Color Meanings Around the World.Google Scholar
Laakso, Markku, and Taagepera, Rein. 1979. Effective Number of Parties: A Measure with Application to West Europe. Comparative Political Studies, 12(1), 327.Google Scholar
Lang, Dawei, and Chien, Guan-tin. 2018 (Jan.). wordcloud2: Create Word Cloud by’htmlwidget’.Google Scholar
Lee, Abraham. 2013 (Sept.). paretochart: Pareto chart for python (similar to Matlab’s, but much more flexible).Google Scholar
Lorenz, M. O. 1905. Methods of Measuring the Concentration of Wealth. Publications of the American Statistical Association, 9(70), 209.Google Scholar
Mackinlay, Jock. 1986. Automating the design of graphical presentations of relational information. ACM Transactions on Graphics, 5(2), 110141.Google Scholar
Magallanes Reyes, Jose Manuel. 2017. Introduction to Data Science for Social and Policy Research: Collecting to Organizing Data with R and Python. Cambridge, United Kingdom; New York, USA; Port Melbourne, Australia; Delhi, India; Singapore: Cambridge University Press. OCLC: 998518603.Google Scholar
McKinney, Wes. 2010. Data Structures for Statistical Computing in Python. Pages 5156 of: Stéfan, van der Walt, and Jarrod, Millman (eds), Proceedings of the 9th Python in Science Conference.CrossRefGoogle Scholar
Mueller, Andreas. 2018 (July). amueller/word_cloud. original-date: 2012-11-04T22:57:59Z.Google Scholar
NCES National Center for Education Statistics. (2019). Common Core of Data. https://nces.ed.gov/ccd/schoolsearch/ Google Scholar
North, Stephen. 2004. Drawing graphs with NEATO. Jan.Google Scholar
OECD, European Union, and Joint Research Centre – European Commission. 2008. Handbook on Constructing Composite Indicators: Methodology and User Guide. Paris: OECD Publishing.Google Scholar
Osborne, Peter. 2013. The Mercator Projections. Zenodo, Zenodo. https://doi.org/10.5281/zenodo.35392.Google Scholar
Pebesma, Edzer. 2018. Simple Features for R: Standardized Support for Spatial Vector Data. The R Journal, 10(1), 439.Google Scholar
Pedersen, Thomas Lin. 2020 (May). Layouts.Google Scholar
Pedersen, Thomas Lin, and RStudio. 2020 (May). ggraph: An Implementation of Grammar of Graphics for Graphs and Networks.Google Scholar
Peterka-Bonetta, Jessica. 2017 (Mar.). Emojis Analysis in R.Google Scholar
Peterka-Bonetta, Jessica. 2019 (Nov.). today-is-a-good-day/emojis. original-date: 2015-09-10T10:16:25Z.Google Scholar
Pinard, Philippe. 2020 (Sept.). ppinard/matplotlib-scalebar. original-date: 2015-12-29T20:12:43Z.Google Scholar
Plotly Technologies Inc. 2015. Plotly Python Graphing Library. Library Catalog: plotly.com. Google Scholar
Pons, Odile. 2014. Statistical Tests of Nonparametric Hypotheses: Asymptotic Theory. [Hackensack] New Jersey: World Scientific.Google Scholar
QGIS.org. 2020. QGIS Geographic Information System.Google Scholar
Queiroz, Gabriela De, Fay, Colin, Hvitfeldt, Emil, Keyes et al. 2020 (July). tidytext: Text Mining using’dplyr’,’ggplot2’, and Other Tidy Tools.Google Scholar
Railsback, Steven F, and Grimm, Volker. 2012. Agent-Based and Individual-Based Modeling: A practical introduction. Princeton, NJ: Princeton University Press.Google Scholar
Rey, Sergio, Kang, Wei, Wolf, Levi John et al. 2020 (June). pysal/mapclassify: mapclassify 2.3.0.Google Scholar
Rossetti, Giulio. 2020 (Sept.). GiulioRossetti/cdlib. original-date: 2018-12-01T12: 56:29Z.Google Scholar
Rosvall, M., and Bergstrom, C. T. 2008. Maps of Random Walks on Complex Networks Reveal Community Structure. Proceedings of the National Academy of Sciences, 105(4), 11181123.Google Scholar
Russell, Matthew A., and Klassen, Mikhail. 2019. Mining the Social Web: Data Mining Facebook, Twitter, Linkedin, Instagram, Github, and More. 3rd edn. Sebastopol, CA: O’Reilly Media Inc. OCLC: 1059465439.Google Scholar
Saveljev, Vladimir, Kim, Sung-Kyu, and Kim, Jaisoon. 2018. Moiré Effect in Displays: A Tutorial. Optical Engineering, 57(03), 1.Google Scholar
Schmul, Michael. 2003. Graphopt layout algorithm.Google Scholar
Seabold, Skipper, and Perktold, Josef. 2010. Statsmodels: Econometric and Statistical Modeling with Python. Page 5 of: 9th Python in Science Conference.Google Scholar
Seeger, Marc. 2009. Key-Value stores: a practical overview. Medien Informatik, Sept., 21.Google Scholar
Signorell, Andri, Aho, Ken, Alfons, Andreas et al. 2019 (Dec.). DescTools: Tools for Descriptive Statistics.Google Scholar
Simpson, E. H. 1949. Measurement of Diversity. Nature, 163(4148), 688.CrossRefGoogle Scholar
Slowikowski, Kamil, Schep, Alicia, Hughes, Sean et al. 2020 (Mar.). ggrepel: Automatically Position Non-Overlapping Text Labels with’ggplot2’.Google Scholar
Spear, Mary Eleanor. 1969. Practical Charting Techniques. New York; Maidenhead: McGraw-Hill. OCLC: 924909765.Google Scholar
Stevens, Stanley S. 1946. On the Theory of Scales of Measurement. Science, 103(2684), 677680.Google Scholar
Tarawaneh, Raga’ad M., Keller, Patric, and Ebert, Achim. 2012. A General Introduction To Graph Visualization Techniques. 14 pages. Artwork Size: 14 pages Medium: application/pdf Publisher: Schloss Dagstuhl - Leibniz-Zentrum fuer Informatik GmbH, Wadern/Saarbruecken, Germany.Google Scholar
Teucher, Andy (support), Kenton, Russell (JavaScript, and library), Matthew, Bloch (mapshaper Javascript. 2020 (Apr.). rmapshaper: Client for’mapshaper’ for’Geospatial’ Operations.Google Scholar
The Economist Intelligence Unit. 2017. Safe Cities Index 2017. Tech. rept. The Economist, London, UK.Google Scholar
The Economist Intelligence Unit. 2019 (Nov.). Democracy Index. Page Version ID: 925222937.Google Scholar
Tufte, Edward R. 2001. The Visual Display of Quantitative Information. 2nd ed. Cheshire, CT: Graphics Press. OCLC: 248364903.Google Scholar
Tukey, John Wilder. 1977. Exploratory data analysis. Addison-Wesley series in behavioral science. Reading, MA: Addison-Wesley Pub. Co. Google Scholar
Washington State Legislature. 2019 (Aug.). House of Representatives.Google Scholar
Wickham, Hadley. 2014a. Tidy Data. Journal of Statistical Software, 59(10).Google Scholar
Wickham, Hadley. 2016. ggplot2: elegant graphics for data analysis. 2nd ed. UseR! Cham: Springer. OCLC: 958058958.CrossRefGoogle Scholar
Wickham, Hadley. 2018 (Oct.). reshape: Flexibly Reshape Data. Google Scholar
Wickham, Hadley, Chang, Winston, Henry, Lionel, Pedersen, Thomas Lin, Takahashi, Kohske, Wilke, Claus, Woo, Kara, Yutani, Hiroaki, and RStudio. 2019a (Aug.). ggplot2: Create Elegant Data Visualisations Using the Grammar of Graphics.Google Scholar
Wickham, Hadley, Seidel, Dana, and RStudio. 2019b (Nov.). scales: Scale Functions for Visualization.Google Scholar
Wickham, Hadley, François, Romain, Henry, Lionel, Müller, Kirill, and RStudio. 2020a (Mar.). dplyr: A Grammar of Data Manipulation.Google Scholar
Wickham, Hadley, Henry, Lionel, and RStudio. 2020b (July). tidyr: Tidy Messy Data.Google Scholar
Wickham, Hadley and Bache, Stefan Milton. 2014b (Nov.). magrittr: A Forward-Pipe Operator for R.Google Scholar
Wikimedia Foundation. 2019 (Oct.). List of cities and towns in Washington. Page Version ID: 923633362.Google Scholar
Wikipedia. 2020 (June). COVID-19 pandemic in Washington (state). Google Scholar
Wilkinson, Leland. 2006. Revising the Pareto Chart. The American Statistician, 60(4), 332334.Google Scholar
Woerheide, W. 1993. An Index of Portfolio Diversification. Financial Services Review, 2(2), 7385.Google Scholar
Yang, Zhao, Algesheimer, René, and Tessone, Claudio J. 2016. A Comparative Analysis of Community Detection Algorithms on Artificial Networks. Scientific Reports, 6(1), 30750. Number: 1 Publisher: Nature Publishing Group.Google Scholar

Save book to Kindle

To save this book to your Kindle, first ensure [email protected] is added to your Approved Personal Document E-mail List under your Personal Document Settings on the Manage Your Content and Devices page of your Amazon account. Then enter the ‘name’ part of your Kindle email address below. Find out more about saving to your Kindle.

Note you can select to save to either the @free.kindle.com or @kindle.com variations. ‘@free.kindle.com’ emails are free but can only be saved to your device when it is connected to wi-fi. ‘@kindle.com’ emails can be delivered even when you are not connected to wi-fi, but note that service fees apply.

Find out more about the Kindle Personal Document Service.

Available formats
×

Save book to Dropbox

To save content items to your account, please confirm that you agree to abide by our usage policies. If this is the first time you use this feature, you will be asked to authorise Cambridge Core to connect with your account. Find out more about saving content to Dropbox.

Available formats
×

Save book to Google Drive

To save content items to your account, please confirm that you agree to abide by our usage policies. If this is the first time you use this feature, you will be asked to authorise Cambridge Core to connect with your account. Find out more about saving content to Google Drive.

Available formats
×