Introduction
The atmospheric mineral dust load, mainly composed of insoluble mineral particles, is an important part of Earth’s climatic system as it is involved in direct and indirect radiative forcing processes (e.g.Reference Tegen and FungTegen and Fung, 1994). Equally, the amount, size distribution and composition of dust deposited on polar ice sheets may hold valuable information about both positions and climatic conditions of source areas, as well as about long-range transport and deposition processes (Reference BiscayeBiscaye and others, 1997; Reference Fuhrer, Wolff and JohnsenFuhrer and others, 1999). Over the last climatic cycle, Greenland as well as Antarctic mineral-dust records exhibit changes on a huge dynamic range (e.g. Reference HanssonHansson, 1994; Reference SteffensenSteffensen, 1997; Reference PetitPetit and others, 1999). In Greenland these changes occurred very rapidly and coincided with changes in δ18O at rapid climatic transitions within the last Pleistocene, as has been inferred from high-resolution measurements of Ca2+ and electrical conductivity measurements (ECM) on the Greenland Icecore Project (GRIP) and Greenland Ice Sheet Project 2 (GISP2) ice cores (Reference Taylor, Alley, Lamorey and MayewskiTaylor and others, 1997; Reference Fuhrer, Wolff and JohnsenFuhrer and others, 1999).
The concentration of Ca ions (Ca2+) is often used as a proxy parameter for total mineral dust in ice cores, as it represents the major part of the readily dissolved fraction of the dust aerosol. But the soluble proportion of dust is not constant over different climatic periods (Reference SteffensenSteffensen,1997), so using Ca2+ as a proxy may give a distorted view of the total dust concentration. However, dust measurement techniques also have disadvantages: only low-resolution profiles or selected continuous sections have been measured for insoluble microparticles using the well-established Coulter counting technique (e.g. Reference SteffensenSteffensen, 1997) since that requires extensive sample preparation and handling; and high-resolution continuous dust measurements using 90˚ laser light scattering off meltwater (Reference Hammer, Clausen, Dansgaard, Neftel, Kristinsdόttir, Johnson and LangwayHammer and others, 1985) or off ice (Reference Ram and KoenigRam and Koenig, 1997) yield no size-distribution information or are difficult to calibrate.
Here we introduce a novel laser sensor device for microparticle measurements deployed for continuous recordings of microparticle concentration and size distribution during the North Greenland Icecore Project (NorthGRIP) 2000 field season. Apart from the methodical aspects, we present and discuss case-studies of the dust concentration focusing on the Ca2+/dust ratio under inconspicuous conditions as well as in volcanic horizons.
Experimental Set-Up
During the NorthGRIP 2000 field season, extensive scientific processing was performed shortly after retrieval of the ice core. This included the operation of a warm laboratory for continuous flow analysis (CFA) of Ca2+, Na+, NH4 +, SO4 2–, NO3 –,H2O2 and HCHO concentrations, and of electrolytical conductivity (Reference RöthlisbergerRöthlisberger and others, 2000). Concurrently, continuous microparticle counting and sizing was performed. Discrete liquid samples were collected at 55 cm resolution for subsequent ion chromatography (IC) analysis; and over selected depths, discrete samples for IC and acidity measurements at approximately 6 cm resolution were also collected by an automatic sampler. the contamination-free sample water for all these analyses was drawn from the inner area of a melt head, where the ice was melted at approximately 4 cm min–1. for an overview of the set-up see Figure 1. By these means the core was continuously analyzed from approximately 1400 to 2930 mdepth.
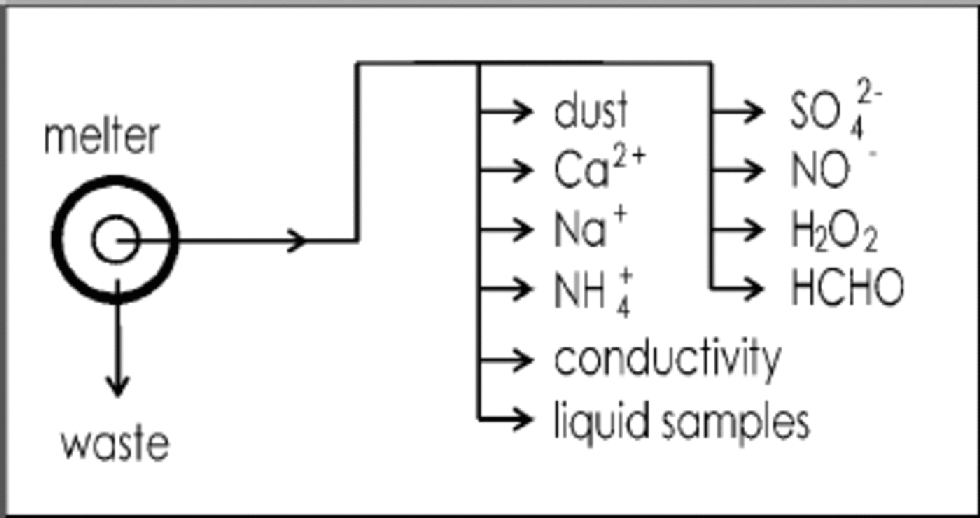
Fig. 1 Flow chart of the analytical set-up (highly simplified).
The particle sensor
The particle sensor for general-purpose laboratory applications is from Klotz GmbH, Bad Liebenzell, Germany, and was specifically modified in collaboration with the Institute for Environmental Physics of the University of Heidelberg (Reference SaeySaey,1998; Reference ArmbrusterArmbruster, 2000).The sample water is pumped through the detection cell, where it is illuminated by a 1.5 μm by 250 μm wide laser light beam of 670 nm wavelength. the transmitted light is measured by a photo diode detector (see Fig. 2).When a particle passes through the detection area the transmitted light is attenuated by shadowing and scattering which results in a negative peak of transmitted light. the peak is counted and sorted by height into 32 bins, which can be adjusted to appropriate size intervals.
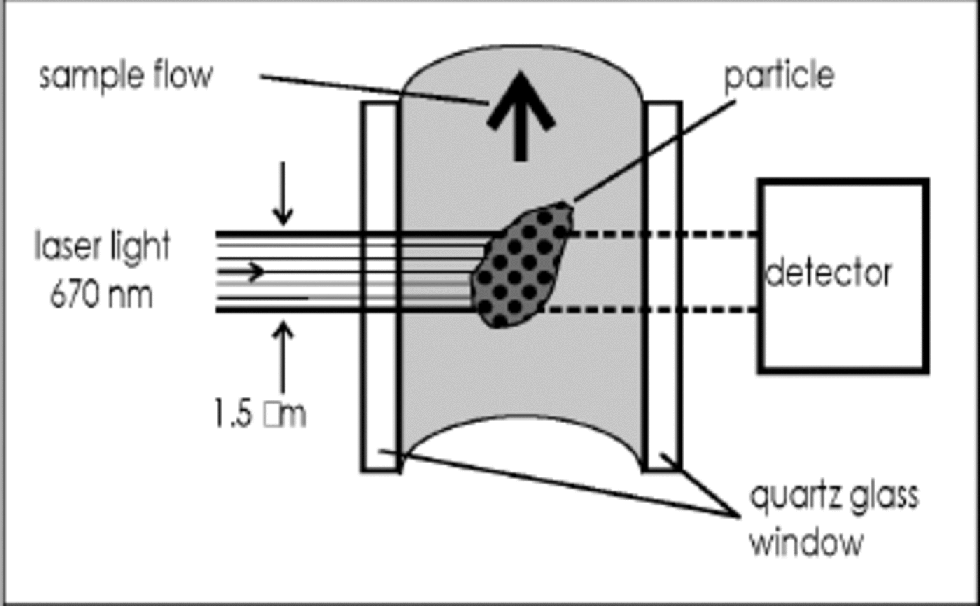
Fig. 2 Detection cell of the laser sensor (schematic).The cross section of the cell is 230 μm×250 μm; the laser beam is 250 μm×1.5 μm wide.
The interrelation of peak height and particle size is complex. Geometric shadowing is combined with scattering processes, both depending not only on particle volume but also on particle shape, material and orientation. A size calibration was achieved by measuring NorthGRIP ice-core samples from different climatic periods with a Coulter counter and tying the laser sensor measurements of identical depths to the Coulter counter spectra. the calibration measurements showed the particle detection limit to be approximately 0.8 μm of spherical equivalent particle diameter. for our measurements, we used 1.0 μm diameter as the lower detection limit, to be safely above the level of detector noise.
In our measuring procedure, size distributions were averaged over 1.65m intervals. Results including size calibration will be presented elsewhere. the bulk particle number concentration was obtained continuously. to do so, the momentary count rate, converted to an analogue output signal, was recorded and the flow rate regularly measured. the continuously recorded data were later reduced to 1mm depth intervals. Dust mass concentrations were inferred by integrating the particle-size distributions obtained for each 1.65 m section and a material density of 2.7 g cm–3; on average, this showed that 1000 count mL–1 are equivalent to 5.6 mg kg–1. for each section, the relative error of particle mass is about 15% due to size-calibration uncertainties and varying pump rates.
To avoid coincidence distortion of the measurements, the output signal is cut off by the counter electronics if the counting rate exceeds 4000 particles s–1, so the sample flow needs to be decreased for high particle concentrations. However, as flow rates of <1mL min–1 increase the sample dispersion in the flow system, the sample water from glacial-age ice, which has a considerably higher dust concentration, was diluted with 0.2 μm pre-filtered carrier water. Hereby an effective sample flow of approximately 0.15 mLmin–1 was established while the flow through the sensor was kept above 2 mLmin–1. the dilution set-up allowed for measuring concentrations of <15 mg kg–1 and >15 000 mg kg–1, thus, covering the full dynamic range from Holocene to Last Glacial Maximum (LGM).When used without the dilution system, the detection limit in terms of minimal count rate was about 200 particles mL–1, although this value depends on the flow rate.
As used in our set-up, the depth resolution of the microparticle measurement, expressed as the observed 1/e depth of a step signal, is ≤1cm. It is generally similar to, and often slightly better than, the depth resolution of most other CFA components. Apart from the melt rate, the depth resolution is limited by the conical surface of the melt head, by dead volumes and by longitudinal sample dispersion in the flow system. the impairment in depth resolution from using the dilution system was around 10%. In ice with low particle concentration, the counting statistics also impose a limit on the depth resolution by raising the error of a data point if the number of counts for this data point is low, thus demanding an increase of interval width for each data point. However, the contribution of this statistical effect is more than one order of magnitude less than that of the physical factors mentioned.
Microparticle concentrations are reported here for the size fraction 1.0–11.5 μm spherical equivalent diameter in mg kg–1. the mass fraction not measured below 1.0 μm accounts for about 10%, assuming a typical lognormal volume distribution.
List of samples
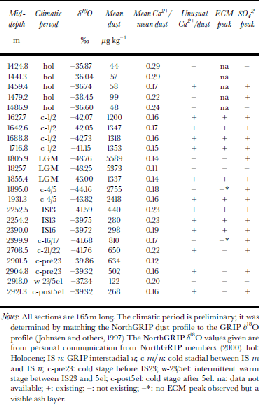
From the whole NorthGRIP core profile, 23 sections, each 1.65m long, are taken for this study. These cover depths from 1420 to 2921 m and represent various climatic periods including the Holocene and LGM. for all sections, δ18O data are already available (personal communication from NorthGRIP members, 2000). for some sections, acidity and standard IC anion data are also available and will be included in our discussion. Table 1 gives an overview of all selected sections, many of which contain volcanic horizons.
Table 1. Overview of the NorthGRIP core sections used for this study
Results and Discussion
The high-resolution profiles
Articulate variations of the dust concentration are observed throughout large sections of the core. Figure 3 shows two 1.65m long sections of the microparticle and Ca2+ profiles, one from the Holocene and one from the LGM. Typical peak heights for microparticles are about 6 times (Ca2+: 4 times) the background value in the Holocene and about 2.2 times (Ca2+: 2.0 times) the value in the LGM section. Based on a preliminary estimate of annual-layer thicknesses λ, made by applying the GRIP ages fromReference JohnsenJohnsen and others (1997) to identified horizons in the NorthGRIP core, we expect that the variations may correspond to annual variations in the Holocene section; in the LGM section partly annual and partly multi-annual variations may be resolved. the insoluble-dust profile, therefore, may assist the dating by annual-layer counting based on other high-resolution profiles, such as ECM, Ca2+, Na+ or visual stratigraphy (e.g. Reference MeeseMeese and others, 1997).
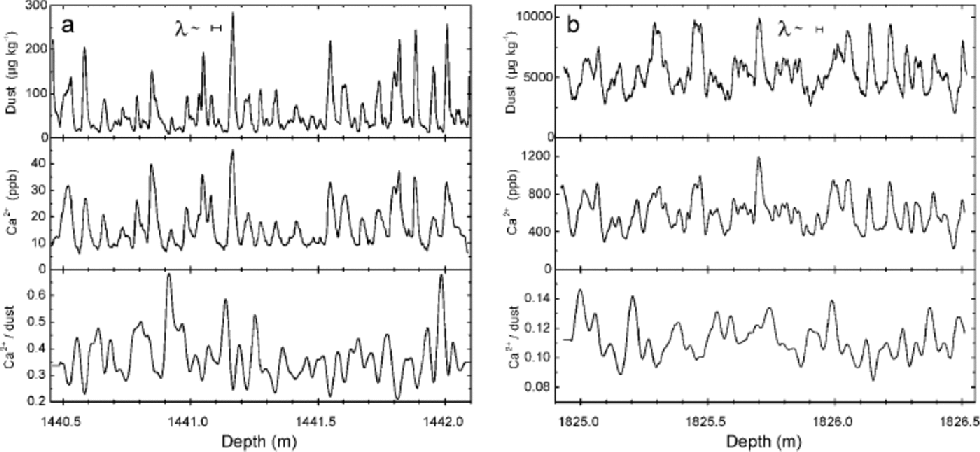
Fig. 3 Examples of the insoluble dust and the Ca2+ measurements: (a) during the Holocene, (b) during the LGM. Also shown is the Ca2+/dust ratio, which is smoothed (see text). A preliminary estimate of expected annual layer thicknesses λ is included. Note the different scales in all panels for (a) and (b).
Variation of the Ca2+/dust ratio
Normally, a good correspondence is observed between insoluble microparticle and Ca2+ concentrations for Holocene ice as well as for glacial-age ice. the correlation coefficients for the two examples shown in Figure 3 are 0.92 (Holocene) and 0.89 (LGM) after slight smoothing of both signals (see below). A similarly high correlation is found throughout the whole core. This at first sight may seem to be a general confirmation for the use of Ca2+ concentrations as a proxy for the insoluble-mineral-dust variability.
A more detailed examination of the Ca2+/dust ratio reveals, however, distinct differences between the Holocene and the glacial section. to inspect these, the Ca2+/dust ratio was calculated for each data point and smoothed to weaken artifacts arising from incorrect peak phasings and from different peak shapes caused by signal noise, different sample dispersion or different response characteristics of the two detection systems. for the smoothing, a 5.0 cm wide hanning window was used, i.e. a gliding average using a cosinusoidal weighting function. the smoothed Ca2+/dust ratio is included in Figure 3. It varies significantly on the same depth scale, as peaks occur in the crustal concentrations, and tends to be enhanced at low dust levels. the (mean Ca2+)/(mean dust) ratio of the two sections is ~0.29 for the Holocene and ~0.11 for the LGM, which is similar to earlier findings by Reference SteffensenSteffensen (1997) based on established Coulter counter and standard IC measurements.
For all ice-core sections listed in Table 1, the Ca2+/dust mean ratios were calculated; hereby horizons with strong acid inputs, which showed unusually high Ca2+/dust values (see below), were excluded. Figure 4 shows the derived (mean Ca2+)/(mean dust) ratios plotted against δ18O; mean microparticle concentrations are also shown. A gradual trend to lower mean ratios for isotopically colder samples is apparent. It can be excluded that the observed trend is an artifact arising from possibly higher relative errors of the measurements for isotopically warmer samples, which have lower concentrations of Ca2+ and dust; even Holocene concentrations are well above the detection limit, and both systems responded very linearly to sample concentrations. Also the Ca2+ fraction derived from sea-salt aerosol does not contribute significantly.

Fig. 4 Ca2+/dust ratio and mean dust concentration for all 23 sections plotted against δ18O. Each data point represents a 1.65 m long interval.
In order to compare the measured R0 =(Ca2+)/(insoluble dust) ratios with data on the elemental composition of airborne mineral dust or source material, the ratios R0 need to be converted to R (total Ca)/(total dust). That is: ![]() where
where ![]() is the ratio of total Ca to dissolved Ca2+, b ≈ 0.9 is the correction for the dust fraction not measured below 1.0 μm, and c = 2.5 is the mass ratio of CaCO3 to Ca, assuming that the dissolved dust fraction predominantly consisted of CaCO3 or of species with similar mass. This approximation yields ratios of 0.16 for the Holocene and 0.08 for the LGM. This Holocene value is in weak agreement with a mean ratio of 0.09 (range: 0.06–0.18) deduced from measurements of total Ca and Al in recent Greenland firn by atomic absorption spectroscopy (Reference BoutronBoutron,1978), but is larger than the value of 0.05 deduced from total Ca and Al analyses in Summit aerosol by Reference ColinColin and others (1997). for comparison to both references, the reported Al masses were used to infer the total dust mass by assuming a crustal abundance of 8%.
is the ratio of total Ca to dissolved Ca2+, b ≈ 0.9 is the correction for the dust fraction not measured below 1.0 μm, and c = 2.5 is the mass ratio of CaCO3 to Ca, assuming that the dissolved dust fraction predominantly consisted of CaCO3 or of species with similar mass. This approximation yields ratios of 0.16 for the Holocene and 0.08 for the LGM. This Holocene value is in weak agreement with a mean ratio of 0.09 (range: 0.06–0.18) deduced from measurements of total Ca and Al in recent Greenland firn by atomic absorption spectroscopy (Reference BoutronBoutron,1978), but is larger than the value of 0.05 deduced from total Ca and Al analyses in Summit aerosol by Reference ColinColin and others (1997). for comparison to both references, the reported Al masses were used to infer the total dust mass by assuming a crustal abundance of 8%.
The trend to lower observed values of Ca2+/dust for lower δ18O is a matter of dispute, as several explanations may be invoked. These include possible changes of source areas and properties, or of fractionating transformation and removal processes during long-range transport or deposition (e.g. Reference HanssonHansson, 1994; Reference Wurzler, Reisin and LevinWurzler and others, 2000). the observed effect might also be explained by slower dissolution of Ca2+ due to alkaline conditions of glacial-age ice, which would lead to lower observed Ca2+ concentrations using the immediate CFA detection method used here.
Changes of mineral dust source areas are a controversial topic in the literature. Reference De Angelis, Steffensen, Legrand, Clausen and HammerDe Angelis and others (1997), by comparing their Ca2+/Mg2+ ratios to Reference BowenBowen (1979), deduce mean sediment sources for the present day, and marine carbonate sources for the last glacial. Reference BiscayeBiscaye and others (1997), based on mineralogical and isotopic studies, propose no significant change of source area during times of variable dust fluxes with-in the last glacial. Reference Hinkley, Pertsiger and ZavjalovaHinkley and others (1997), on the basis of mineralogical studies, presume a present-day tropospheric background aerosol uniformly composed of average crustal rock and not of carbonates. Reference MaggiMaggi (1997) finds that weathering processes may have changed with climate; but little is known about how this might have affected the relative abundances of CaCO3 or CaSO4 in the dust aerosol (Reference PyePye,1987). A comparison of our data with Ca abundances in crustal material (Reference BowenBowen,1979) (see Table 2) suggests that marine carbonates or limestone sediments contributed significantly only during the Holocene and that during the LGM mean crust and other sediments dominated. Various soils could have contributed at all times.
Table 2. Mean weight fractions of Ca in different types of crust material (adapted from Bowen, 1978)

In the data presented here, the variations of the Ca2+/ dust ratio that occur on an annual to multi-annual scale follow the same pattern as the variations just discussed on a long time-scale. As can be seen in Figure 3, the Ca2+/dust ratio is small during large dust concentrations, which at least for the Holocene may be driven by variability in the transport efficiency, as known for the Arctic haze phenomenon (Reference Rahn and BorysRahn and Borys, 1977). It seems possible that also on an annual time-scale these variations may be attributed to changing source areas or may be closely linked to changing fractionation processes during long-range transport.
Special events in the microparticle and Ca2+ profiles
Figure 5 shows an example of a 1.65 m long section from the time between GRIP interstadials 1 and 2 which exhibits several anomalies (denoted by α – δ). Event α is a strong dust layer (note that the microparticle concentration was cut off by the detector electronics). Event δ is an increase of the Ca2+/dust ratio caused by a Ca2+ peak that has no corresponding microparticle peak; only NO3 – exhibits a pronounced peak that may be related (e.g. Reference WolffWolff, 1984). Events β and γ arise from two very strong Ca2+ peaks coinciding with only small insoluble-dust peaks; they have a Ca2+/dust ratio about 100% and 200% higher than the typical value. Coinciding are very strong peaks in SO4 2– and also enhancements of ECM, acidity and F– (not shown) indicating volcanic horizons. These phenomena were observed mainly during cold glacial times, but also occurred during warm interstadials.
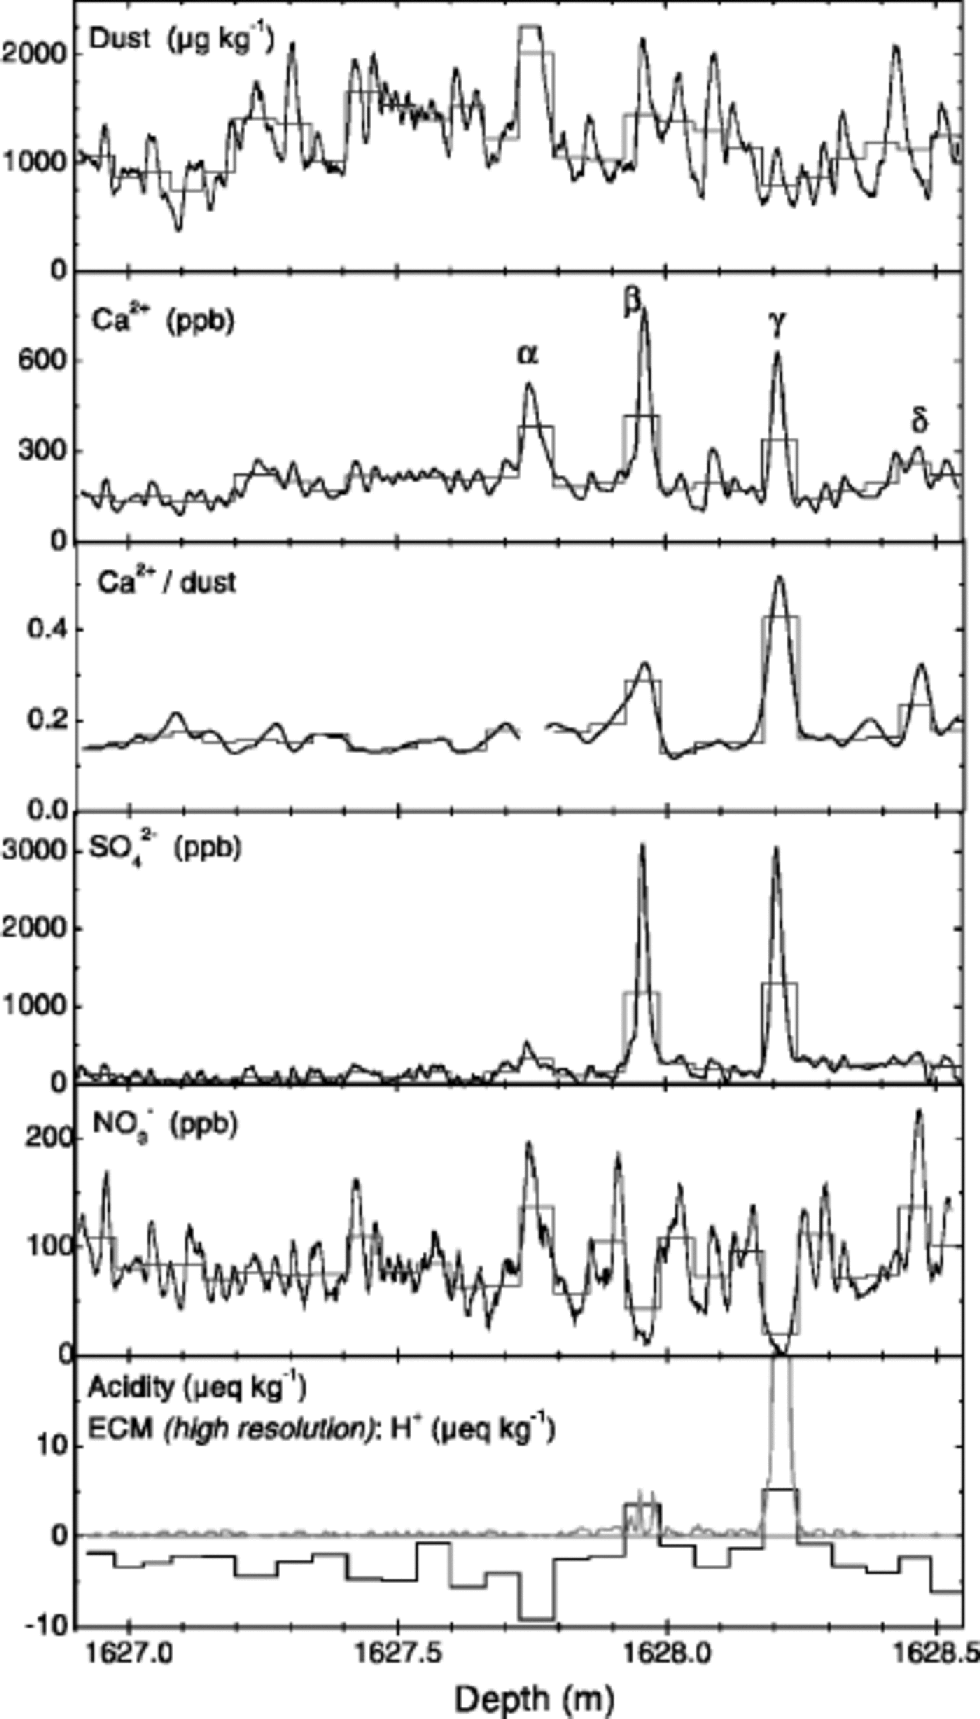
Fig. 5 Examples of anomalous events in the microparticle and Ca2+ profiles. the sample is from the cold stadial between interstadials 1 and 2. the data for dust, Ca2+, SO4 2– and NO3 – were obtained by CFA; the Ca2+/dust ratio was smoothed (see text); acidity was measured at approximately 6 cm depth resolution; in the same panel the ECM data are shown in high resolution (preliminary calibration). the fine histogram-style lines represent the high-resolution data reduced to the resolution of the acidity measurement. Labelled Ca2+ peaks refer to events discussed in text.
From our size-distribution measurements we can rule out that the observed increase of the Ca2+/dust ratio during events β and γ is only an artifact resulting from a dust size distribution severely shifted towards larger particles during these events. High inputs of acid, however, may lead to enhanced Ca2+/dust ratios by promoting the rapid dissolution of calcite particles or CaCO3 coatings. Indeed, all 13 anomalous Ca2+/dust enhancements investigated in this study are accompanied by a clear SO4 2– peak, indicating a strong input of acid (see Table 1).
An ionic balance was evaluated using major-ion concentrations and acidity data for 10 of these sections, and it was found to be rather constant−not zero, at a low μeq kg–1 level−across the disturbed horizons, which indicates that no unmeasured ionic species contributed substantially during these events. from the ionic balance, of course, it still cannot be distinguished to what extent SO4 2– derived from H2SO4 or from mineral CaSO4. But it seems much more probable that during volcanic events SO4 2– originates mainly from volcanic H2SO4 and that the Ca2 + peak is produced by enhanced dissolution of CaCO3 during in-cloud processing or pre-analytical sample melting.
Conclusions
The novel particle sensor proved to be a reliable tool even under field conditions; it provided the total particle concentration at ≤1cm depth resolution backed up by size-distribution information. Thus, calibrated records of insoluble-particle mass concentrations are obtained. Variations of the Ca/dust mass ratio were seen during long-term climatic changes, as well as on annual or multi-annual time-scales. This suggests variable source properties or variable fractionation during transfer, which should be investigated in more detail. If Ca2+ measurements are used as a quantitative proxy for mineral dust, care must be taken when considering data across climatic transitions, at volcanic horizons or at subseasonal resolution.
A dedicated investigation of Ca ion solubility in glacial-age meltwater and its implications for the CFA and IC analytical methods is essential as we are currently limited in our interpretation by this uncertainty. to elucidate possible variations in dust source areas and properties, or changes in fractionation processes during long-range transport, routine analyses of crustal reference elements like Al are needed, as they would help to infer the total, i.e. soluble and insoluble, crustal concentration.
Acknowledgements
The NorthGRIP project is directed and organized by the Department of Geophysics at the Niels Bohr Institute for Astronomy, Physics and Geophysics, University of Copenhagen. It is supported by funding agencies in Denmark, Belgium, France, Germany, Iceland, Japan, Sweden, Switzerland and the United States of America. We wish to thank all the funding bodies and field participants. C.M. Zdanowicz is thanked for his helpful comments to improve the manuscript.


