Dietary surveys represent an important source of data on population dietary behaviours associated with health and disease, and are a prerequisite for the creation and tracking of nutrition-related public health policies and programmes. While mean nutrient and food intakes on a population level are valuable, they can often mask inadequate or excess intakes in specific demographic or socio-economic subgroups that may require additional attention. The literature from high-income countries( Reference Wang, Leung and Li 1 – Reference Beghin, Dauchet and De Vriendt 3 ) has shown significant and widening differences in diet quality by socio-economic status (SES), with disadvantaged socio-economic groups consuming more affordable, nutrient-poor foods compared with high-SES groups. The nutrition transition from traditional diets to more Western-style diets has been well documented in many low- and middle-income countries of Asia, Africa and Latin America( Reference Popkin 4 – Reference Mayen, Marques-Vidal and Paccaud 7 ). These eating patterns are characterized by increased intakes of energy, meat, SFA, sugar and refined grains coupled with reduced intakes of fibre, fruits and vegetables. While the positive gradient in diet quality by SES is clear in high-income countries, some low- and middle-income countries undergoing nutrition transition have experienced a different pattern( Reference Popkin 5 , Reference Popkin 6 ). Specifically in these low- and middle-income countries, urban and high-income groups seem to more readily embrace unhealthy Western-style diets, while low-income and rural groups tend to preserve traditional diet features over a longer period of time by consuming more vegetables, oils and whole grains, and less meat and SFA.
Bosnia and Herzegovina (B&H) was a part of the socialist Yugoslavia until its breakdown in 1992, followed by an armed conflict in 1992–1995. The country is organized into two administrative units, the Federation of Bosnia and Herzegovina (FB&H) and the Republika Srpska. B&H’s economy underwent transition to a market economy in the late 1990s, but is still catching up with more developed neighbouring countries( 8 , Reference Stiblar 9 ). Located in the Balkan Peninsula, its northern parts are characterized by mountain ranges and a moderate continental climate, while southern parts bordering with the Adriatic have a significantly warmer, Mediterranean climate. The Bosnian and Adriatic fishery is a great source of both wild and farmed fish( 10 , Reference Farrugio and Soldo 11 ), while the diverse terrain is suitable for growing an assortment of fruits and vegetables, nuts and other crops. Among the locally available foods rich in key nutrients and affordable are trout, sardines, mackerel, walnuts, rye, buckwheat, carrots and collard greens.
Health statistics indicate that B&H is at an advanced stage of epidemiological transition with CVD as the leading cause of mortality( 12 , 13 ) and type 2 diabetes and diet-related cancers on the rise( 12 , 13 ). Overweight and obesity affect over half of the country’s population( 12 ). While the literature on pre-war and post-war dietary habits of former Yugoslavian and Bosnian populations is sparse, the Seven Countries Studies( Reference Buzina, Suboticanec and Saric 14 , Reference Buzina, Ferber and Keys 15 ) identified geographic variations in the type of fat consumed among men in pre-war Yugoslavia, while a study among Bosnian immigrants in Sweden( Reference Jonsson, Wallin and Hallberg 16 ) and the 2012 B&H Health Survey( 13 ) suggested high intakes of refined wheat flour and sugary products (such as white bread, pies and sweet pastry) in Bosnian diets. We were, however, unable to find literature on Bosnian or West Balkans changes in dietary habits over the past decades, nor data on demographic (e.g. sex, age, marital status) or socio-economic (e.g. education, wealth, place of residence) differences in diet within the country. It is therefore unclear whether nutrition transition in this region has followed the patterns identified in other low- and middle-income countries. To address this gap, we evaluated the demographic and socio-economic predictors of nutrient and food intakes, as well as of the overall diet quality, among adults in B&H.
Methods
Study design and population
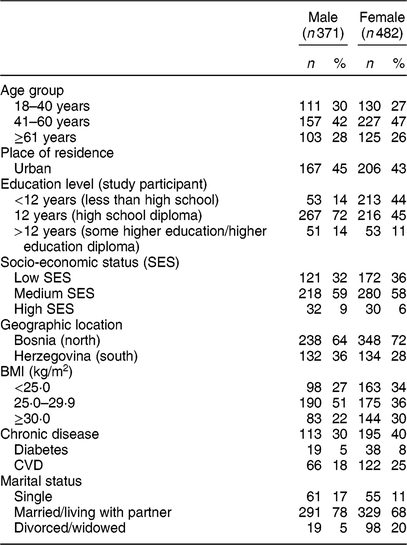
We used data from the 2017 B&H dietary survey that included a population-based sample of 872 persons aged 18 years or over residing in FB&H. This was a cluster randomized sub-sample of households participating in the 2015 Household Budget Survey (HBS 2015)( 17 ) in B&H, used to minimize sampling costs and to allow linking of dietary and socio-economic data. HBS is a nationally representative, stratified random sample of households. The non-response rate of 34 % in our study was partially due to an outdated sampling frame and frequent in-country migrations, and is similar to other dietary surveys( Reference Merten, Ferrari and Banner 18 ). Nineteen persons were excluded due to systematic interviewer error, resulting in the final sample of 853 persons (482 women and 371 men; Table 1). Dietary data were collected by trained interviewers in the form of two non-consecutive 24 h recalls (the first one in person, the second one over the telephone 4–30 d later) uniformly across four seasons with the weekday to weekend ratio of 7:3. Data were subsequently linked to socio-economic data from the HBS 2015. Weight and height data were self-reported; participants were, however, given a chance to use an interviewer-provided portable scale, measuring tape and written instructions to take these measures during interview if they were unsure.
Table 1 Characteristics of participants in the Bosnia and Herzegovina dietary survey (2017)
Demographic and socio-economic variables
We used the Organisation for Economic Co-operation and Development-modified equivalence scale( Reference Hagenaars, de Vos and Zaidi 19 ) to standardize household spending levels by household size and then classified this variable into tertiles (low, medium, high). Education level of the head of household was categorized as follows: less than high school (<12 years), high school completed (12 years) and some higher education or higher education diploma (>12 years). A composite socio-economic (SES) score (Table 1) was created to combine the effect of education and wealth. Participants were categorized into the ‘high SES’ category if the household head had >12 years of education and the household spending was in the highest tertile; into ‘low SES’ if the household head’s education was <12 years and the spending was in the lowest tertile; everyone else was categorized as ‘medium SES’. We also stratified participants by the place of residence using the official national statistics agency classification into ‘urban’, defined as residing in settlements with a ‘city’ status, and ‘non-urban’, that included semi-urban and rural settlements. Further, participants were classified by geographic location into those residing in the ‘north’ (municipalities in Bosnia, northern and central regions) or ‘south’ (municipalities in Herzegovina, southern regions). We also classified our participants by age group (18–40, 41–60 and ≥61 years), BMI (<25·0, 25·0–29·9 and ≥30·0 kg/m2) and marital status (single, married/cohabitating and divorced/widowed).
Dietary assessment
To determine intake quantities during interviews, we utilized the DIET-ASSESS Food Atlas( Reference Gurinovic, Milesevic and Kadvan 20 , Reference Nikolić, Milešević and Zeković 21 ) which uses colour images of eating utensils, dishes, foods and meals to aid in the estimation of portion sizes during the in-home interviews. A short version of this food atlas was left with respondents to be used during telephone interviews. Nutrient intakes were calculated by DIET ASSESS & PLAN advanced dietary assessment software( Reference Gurinović, Milešević and Kadvan 22 ) linked to the Balkans food composition database. We focused on the key nutrients associated with health and disease, and further restricted our analysis to nutrients with confirmed validity in the Balkans food composition database. Data on trans-fatty acids and free/added sugars were not available in the database; hence we excluded these nutrients from our analyses. Individual foods were categorized into food groups of interest. ‘Fruit’ and ‘vegetables’ categories included only whole fruits and vegetables, while juices and spreads were categorized separately. Low-fat dairy included products with 2 % milk fat or less. Ingredients of composite dishes were incorporated into several categories as appropriate (e.g. sugar from a cake with nuts would be added to the ‘sweets’ category while nuts would be counted as ‘nuts’). All values were calculated as grams or millilitres per day and included non-consumers.
Prime Diet Quality Score
The Prime Diet Quality Score (PDQS)( Reference Fung, Isanaka and Hu 23 , Reference Gicevic, Gaskins and Fung 24 ) is a food-based, twenty-one-component, dietary score consisting of twelve ‘adequacy’, seven ‘moderation’ and two population-specific components (for adults, only low-fat dairy foods are coded as an adequacy component, while high-fat dairy and eggs are not coded). The score was developed and successfully evaluated by comparison with a comprehensive FFQ in a high-income country setting( Reference Fung, Isanaka and Hu 23 , Reference Gicevic, Gaskins and Fung 24 ). In two studies of US women, higher score on the PDQS was found to predict lower risk of CHD( Reference Fung, Isanaka and Hu 23 ) and gestational diabetes mellitus( Reference Gicevic, Gaskins and Fung 24 ). We adapted the scoring criteria for use with the two days of 24 h recall data. Specifically, for each ‘adequacy’ component, participants were assigned a ‘0’ if no foods from a component were consumed in at least a minimum quantity during both days, a ‘1’ if foods from a component were consumed in an amount above the minimum cut-off point on one day out of the two, and ‘2’ if at least one food from a food component was consumed at or above minimum amount on both days. The coding was reversed for the ‘moderation’ components. The number of occasions a person consumed foods during a day from a component were not taken into account, i.e. any frequency above 1 was coded as ‘1’. In order to preserve the original scoring of up to 42 points (representing a high-quality diet), we assigned 2 points to all participants for the ‘eggs’ component, keeping it as a neutral component. We set ‘minimum amount per meal’ cut-off points for each component based on expert knowledge, specific food portion sizes and distributions of actual intakes in the 2017 Bosnia diet survey( Reference Gicevic, Gaskins and Fung 25 , Reference Gicevic, Kremic and Fung 26 ). The online supplementary material, Supplemental Table S1, gives details about foods included in each component and the cut-off points per meal.
Statistical analysis
We calculated nutrient and food intakes as a simple average of two days for each participant while the total PDQS was based on intakes from both days. Geometric means and se were calculated from log-transformed nutrients. Gamma distribution of food groups was assumed to accommodate their skewed distributions. The PDQS was normally distributed in our population. Multivariable linear regression analysis was used to examine associations between demographic and socio-economic indicators and nutrients, food groups and the PDQS. Nutrient and food models were adjusted for sex, age and energy intake. We evaluated homogeneity of intakes across subgroups using a trend test across categories of SES, household spending, age category, education and BMI, and a Wald test (with Tukey correction for multiple comparisons by marital status category) for sex, place of residence, geographic location and marital status. We did not present data for low-fat dairy and alcoholic beverages due to very low consumption of these food groups in our sample. We detected dietary outliers (none for energy intake and up to twelve extreme values for MUFA, linoleic acid, and vitamins A, B12 and C) using the %esd macro for performing generalized extreme Studentized deviate many-outlier detection( Reference Rosner 27 ). We conducted sensitivity analyses by excluding the extreme values for each log-transformed nutrient and compared the results with those from the full sample. Results were similar with and without inclusion of these outliers and so all observations were included. Due to suspected problems with the validity of the data collected by one of five interviewers, we excluded data from nineteen participants (2 %) whose energy and nutrient intakes were systematically and significantly higher compared with those of the other four interviewers. In a sensitivity analysis, we also adjusted the models for the season effects and compared the results with our initial findings. Sampling weights were included in the models to account for the sampling and participation effects and so that results would be representative of the general adult population in the FB&H. All the analyses were performed in the statistical software package SAS version 9.4. All P values were two-tailed (α = 0·05).
Results
Energy and nutrients
Reported mean energy and macronutrient intakes were similar across all three socio-economic indicators (Table 2 and online supplementary material, Supplemental Table S2). Participants in the high socio-economic group consumed less fibre, α-linolenic acid (both P < 0·001), K, Fe, and vitamins C and E (all P = 0·01), in models adjusted for sex, age and energy, compared with those in the low and medium socio-economic groups. Participants residing in urban areas had lower fibre (P = 0·01), all PUFA, linoleic acid (P = 0·01), Se, K and vitamin E intakes (all P = 0·02) compared with those residing in non-urban areas, while participants from the southern parts of the country reported lower average intakes of fibre, all PUFA, α-linolenic acid, K (all P < 0·001), total sugars (P = 0·01), linoleic acid (P = 0·03), niacin (P = 0·05), and vitamins C and D (P = 0·01) compared with participants from northern and southern regions.
Table 2 Socio-economic and geographic variations in nutrient intakes among adults in the Bosnia and Herzegovina dietary survey (2017)
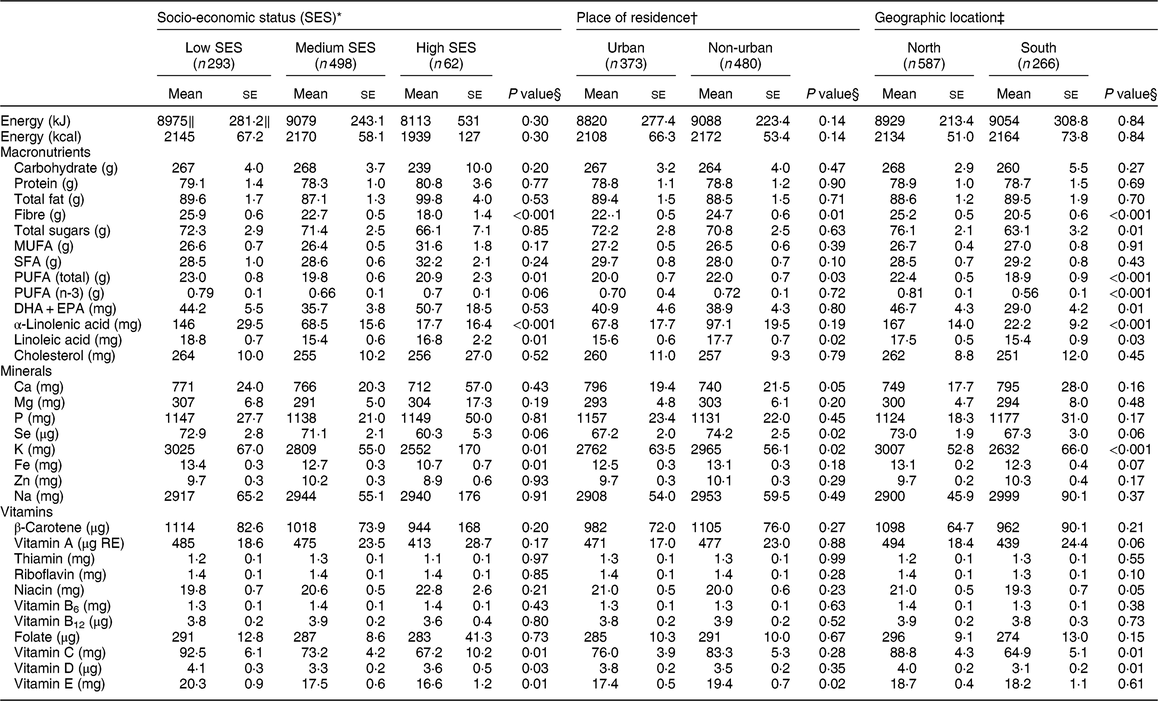
* SES is a composite measure composed of the total household consumption category standardized using the Organisation for Economic Co-operation and Development-modified equivalence scale and the highest educational attainment of the head of household.
† ‘Urban’ includes settlements in Bosnia and Herzegovina that have been awarded a ‘city’ status. ‘Non-urban’ includes all other settlements, including semi-urban areas.
‡ ‘North’ refers to central and northern parts of the country, mainly Bosnian municipalities; ‘south’ to Herzegovinian municipalities.
§ P values for homogeneity of means estimated by the linear trend test (SES) and the Wald F test (place of residence, geographic location).
‖ Data are presented as geometric means and se (adjusted for sex, age and energy intake).
Foods and food groups
Women reported higher mean intakes of fruits (P = 0·04), and sugar and sweets, and lower intakes of refined grains, red meat (all P < 0·001), potatoes, poultry (both P = 0·05) and processed meats (P = 0·03) than men in age- and energy-adjusted models (Table 3). Older participants consumed significantly more vegetables (P < 0·001), vegetable products and whole grains (both P = 0·01), fish and seafood (P < 0·001), legumes and pulses (P = 0·01), and liquid fats and oils (P = 0·01), and less sugar and sweets, sugar-sweetened beverages (SSB), processed meats (all P < 0·001) and solid fats (P = 0·03) compared with the youngest age group. Participants from the high-SES group consumed significantly higher mean amounts of whole grains, processed meat (both P = 0·01) and SSB (P < 0·001), and significantly lower amounts of vegetables, liquid oils, eggs, fish and seafood (all P = 0·01; Table 4). Participants in urban areas consumed lower quantities of vegetables, legumes and fruit products (P = 0·01), potatoes (P = 0·02) and liquid oils (P < 0·001), and more nuts and seeds (P < 0·001) compared with those in non-urban areas, while participants from the southern parts of the country consumed less fruits, vegetables, poultry, nuts and seeds (all P = 0·01), fruit products (P = 0·04), potatoes (P = 0·05), high-fat dairy (P = 0·03), liquid oils and eggs (both P < 0·001), and more processed meats, solid fats, SSB (all P = 0·01) and whole grains (P < 0·001), compared to people residing in northern and central parts.
Table 3 Demographic variations in intakes of selected foods among adults in the Bosnia and Herzegovina dietary survey (2017)
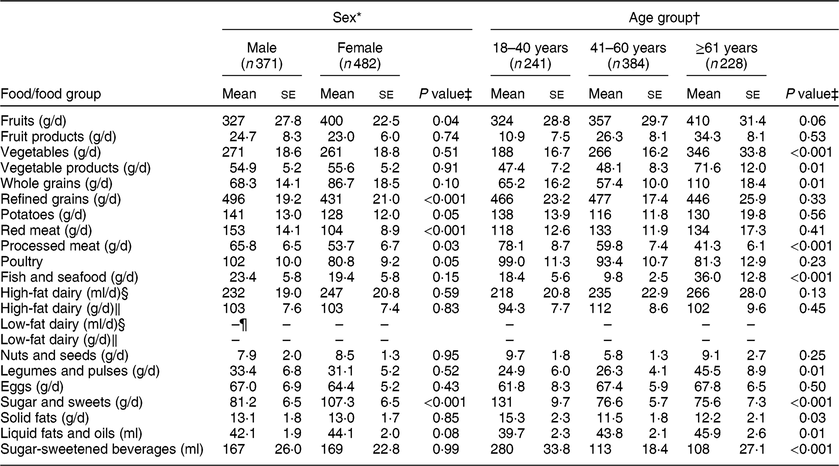
* Age- and energy-adjusted mean and se.
† Sex- and energy-adjusted mean and se.
‡ P values for homogeneity estimated by the Wald χ 2 and a trend test for subgroup effect with a Gamma distribution
§ Milk, yoghurt and other dairy drinks.
‖ Solid dairy products (except butter and ghee).
¶ Foods consumed by very few participants.
Table 4 Socio-economic variations in intakes of selected foods among adults in the Bosnia and Herzegovina dietary survey (2017)
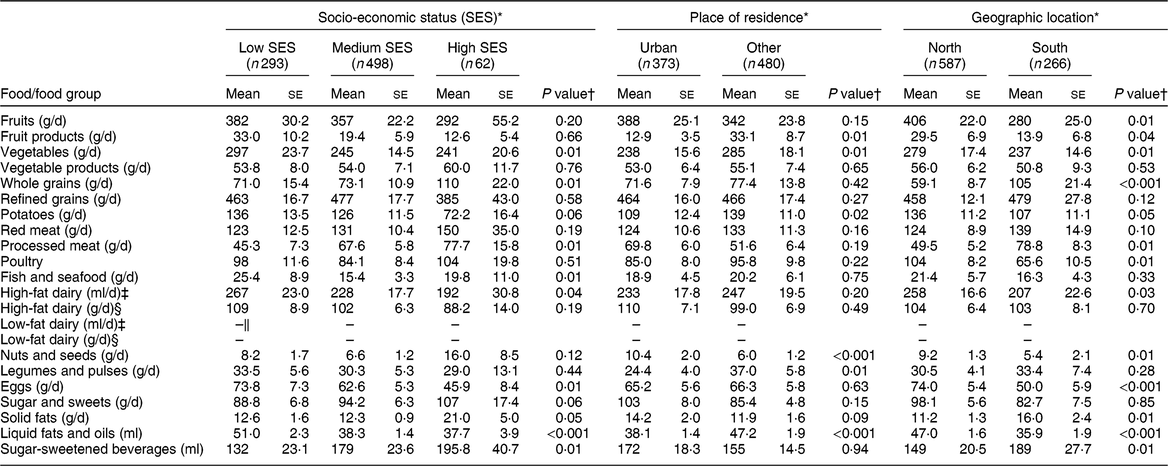
* Age-, energy- and sex-adjusted mean and se.
† P values for homogeneity of means estimated by the Wald χ 2 test and a trend test for subgroup effect with a Gamma distribution.
‡ Milk, yoghurt and other dairy drinks.
§ Solid dairy products (except butter and ghee).
‖ Foods consumed by very few participants.
Prime Diet Quality Score
The mean PDQS was 15·8 (Table 5), with a range of 7–28 (out of possible 42 points). There were no differences in diet quality by sex or place of residence. In energy-adjusted models, SES (P = 0·04) and tertile of household spending (P = 0·002) were inversely associated with the PDQS. These differences did not persist in the multivariable-adjusted models. Diet quality varied strongly by age group, with persons in the highest age group having, on average, a 2·5-point higher PDQS compared with the youngest category (P < 0·0001). Geographic location was also significantly associated with the PDQS, with participants from the north having a mean PDQS that on average was 1·4 points higher compared with those from the south (P < 0·0001). Married/cohabitating individuals had a 1·4-point higher PDQS than single participants (P = 0·02). Participants in higher BMI categories reported having higher diet quality compared with those with lower BMI (P = 0·04). Finally, CVD (in energy-adjusted models, P = 0·009) and type 2 diabetes (in multivariable-adjusted models, P = 0·03) were directly associated with diet quality. Evaluation of the contribution of individual fruit and vegetable PDQS components revealed low intakes of dark orange fruits and vegetables (consumers: n 60 or 7 %), dark green leafy vegetables (n 138 or 16 %) and citrus fruits (n 174 or 20 %). Overall, our results did not change considerably after adjusting for the season effects (data not shown).
Table 5 Predictors of diet quality measured by the Prime Diet Quality Score (PDQS) among adults in Bosnia and Herzegovina (2017)
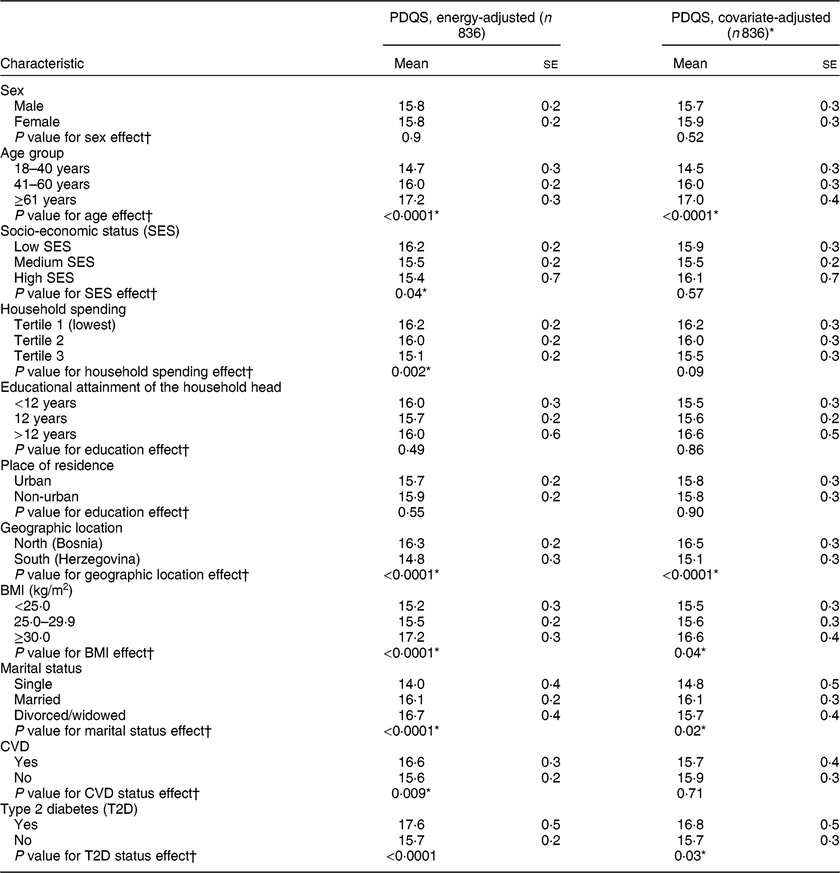
* Adjusted for total energy intake (continuous), sex (male, female), age group (18–40, 41–60, ≥61 years), SES (tertiles; except for education subgroups, which are adjusted for tertile of household spending, and household spending subgroups, which are adjusted for the educational attainment of the head of household (<12 years, 12 years, >12 years)), place of residence (urban, non-urban) and geographic location (Bosnia/north or Herzegovina/south).
† P values for homogeneity estimated by the Wald F test (for sex, place of residence, geographic location and marital status, using Tukey correction to adjust for multiple comparisons for marital status) and trend test (for age, SES, household spending, education and BMI) in multivariate linear regression analyses, adjusted for covariates listed above.
Discussion
In the present cross-sectional study of diet quality among adults in B&H we found generally poor diet quality as measured by the PDQS across all subgroups of our sample, and this was largely characterized by low intakes of nutrient-rich fruits and vegetables, low-fat dairy, fish, and nuts and seeds, and high intakes of processed meats and refined grains. We also observed that the diet quality of Bosnian adults varied significantly by age, geographic location, BMI, type 2 diabetes status and marital status, but contrary to our initial hypothesis, did not vary by markers of SES.
Our results regarding all three levels of analysis, including nutrients, food groups and dietary pattern, suggested that diet quality among young and middle-aged persons is lower compared with those in the older age group. One possible explanation for this finding is that older participants may have changed their diet as a result of disease, not to prevent it, given the high prevalence of chronic disease in this sample. However, our results did not change after adjusting for chronic disease in our models. An alternative explanation could be that older individuals are more immune to the nutrition transition occurring in the country compared with younger people. We also found significant differences in overall diet quality by geographic location, with the participants living in the south having poorer dietary habits than those living in northern and central parts. Low intakes of n-3 fatty acids in this group were especially worrisome given their role in prevention of CVD( Reference Willett 28 , Reference Willett and Stampfer 29 ). This is surprising, as participants from the south would be expected to have more access to fresh produce and fish and dietary habits that are thought to resemble those of a Mediterranean diet. However, studies( Reference Buzina, Suboticanec and Saric 14 , Reference Tur, Romaguera and Pons 30 ) have found similar changes in dietary habits in other Mediterranean areas, where olive oil and fish were being replaced by solid fats and red meat. Also, the HBS 2007( 17 ) found that households that produced fruits and vegetables had significantly lower consumption of fresh produce compared with those that purchased them. Therefore, a possible explanation for our findings could be that participants living in the south tend to sell the fruits and vegetables they produce to purchase less healthy foods, such as SSB and processed meats, for their own consumption.
Diet quality measured by the PDQS was inversely associated with SES in the energy-adjusted models, but these associations were no longer significant after adjusting for covariates. While the PDQS was slightly higher as the level of education of the head of household increased, diet quality score was lower with higher household spending. Our SES findings can, to some extent, be explained by the socio-economic history of the country. First, correlations between education level and wealth have traditionally not been as strong in socialist countries as in capitalist economies( Reference Carnevale, Rose and Cheah 31 , Reference Boshara, Emmons and Noeth 32 ). Second, an economic transition from a planned to market economy in the 1990s followed by 4 years of armed conflict led to major demographic and economic changes in form of internal and external migrations, loss of wealth and the post-war accumulation of profits among less-educated groups( Reference Sorensen 33 ). Lower diet quality among persons in the high SES category is in line with the nutrition transition patterns observed in low- and middle-income countries where high-income individuals are first to be hit by the transition( Reference Popkin 6 ). Recent internal migrations could explain why the present study did not find any significant differences in rural v. urban overall diet quality. It is plausible that, as people migrated from rural to urban areas leaving lands behind and accumulating wealth, the adoption of Western dietary patterns increased( Reference Popkin 4 , Reference De Haen, Stamoulis and Shetty 34 ). As the nutrition transition in the country progresses, however, it may become more evident that the urban poor are at highest risk of eating poor diets and having adverse health outcomes, as documented over the past few decades in other countries( Reference Monsivais, McLain and Drewnowski 35 ).
Higher diet quality score among married/cohabitating participants reaffirms the importance of marital status in promoting healthy dietary behaviour( Reference Lee, Cho and Grodstein 36 , Reference Eng, Kawachi and Fitzmaurice 37 ). Together with the data on diet quality variation by age group it also underlines the importance of teaching cooking skills to the younger population so that they will be able to prepare their own healthy meals when they leave the family home( Reference da Rocha Leal, de Oliveira and Pereira 38 ). Obese individuals in our cohort tended to report eating healthier diets compared with those with a normal BMI. One possible explanation for this is that obese individuals made dietary changes in order to lose weight. Since our study was cross-sectional, these findings may be prone to reverse causality( Reference Willett 39 ). Alternatively, it is entirely possible that people with higher BMI tended to have higher PDQS because they tended to eat larger quantities of food from all the food groups. While we attempted to control for total energy intake to account for this bias, there may be residual confounding that is still driving this association. Finally, it does not surprise that persons with diabetes had higher diet quality scores compared with healthy individuals given dietary modifications are a part of routine medical treatment for this condition( 40 ).
While more work is needed before the PDQS is validated for use with 24 h recall data and as a standalone data collection tool, it is promising to see that it is in concordance with the nutrient-based and food-based findings. For example, participants in the highest age group reported consuming more vegetables, whole grains, fish, legumes and oils, and less processed meat, solid fats, sweets and SSB, and were awarded significantly more PDQS points compared with younger participants. They also reported lower intakes of sugar, K, Na and Ca and higher intakes of β-carotene compared with younger groups( Reference Gicevic, Gaskins and Fung 25 ). Similarly, participants living in the south reported consuming less fibre, n-3 and n-6 fatty acids, K, thiamin, niacin, and vitamins C and D, fruit and vegetables, poultry, nuts and oils, and more processed meats, solid fats and SSB than those living in the northern and central parts of the country, and the PDQS was able to distinguish between these two groups well.
Food-based analysis indicated very high intakes of refined grains (white bread, pastries and rice), high-fat dairy, processed meats and low intakes of whole grains, nuts and fish across all groups. Mean intakes of fruits and vegetables were above the WHO recommendation( 41 ) and liquid oils were used more than solid fats. This, however, does not necessarily imply adequate intakes among all participants. The analysis of the individual PDQS fruit and vegetable components indicated the need for consuming a higher variety of fruits and vegetables by including more citrus fruits, dark green leafy vegetables, and dark orange fruits and vegetables. Nutrient-based analysis suggested that mean intakes of some of the key nutrients commonly found in fruits, vegetables and seafood (e.g. fibre among high SES, β-carotene, vitamin C and all PUFA)( 42 , 43 ) were below the WHO recommendations, while intakes of SFA and Na were beyond recommended intakes( 41 , 44 ); these data support our findings using the PDQS.
Limitations of our study should be considered. First, we inevitably have some level of measurement error in both dietary and socio-economic variables, as both were based on self-report. This source of error is, however, expected to be largely random, producing valid estimates for the population as a whole just with somewhat higher se. While we did find a systematic error by one of the interviewers (who collected data from nineteen persons before leaving the study) and excluded these observations from our analysis, our findings, with the exception of mean energy intakes, did not change notably. Second, the education level of the female who is usually in charge of food preparation may be more relevant than that of a male head of household( Reference Beghin, Dauchet and De Vriendt 3 ). Unfortunately, we were unable to evaluate the impact of this variable on participant diet quality as there were too few female participants in our sample with high levels of education. Among the strengths of the present study is that it links standard socio-economic data with dietary data and allows analysis of diet quality by SES indicators. Further, it included a sample representative of the FB&H’s adult population and a sample similar to the B&H’s general adult population across multiple strata (see online supplementary material, Supplemental Table S3). Thus, the study findings may be generalized to the whole population of adult men and non-pregnant, non-breastfeeding women in FB&H, and likely to the entire B&H. While the cross-sectional nature of the study did not allow for a longitudinal evaluation of these indicators on dietary intakes and diet quality, it will serve as an anchor for future trend analyses once several cycles of dietary intakes are obtained.
Low diet quality across all demographic and socio-economic indicators was evident in this sample of adults from B&H, with even lower quality diet scores recorded among younger participants and those living in the south. Overall diet quality score could be improved by incorporating into meals some locally available, highly nutritious, yet in our sample neglected foods such as carrots, collard greens, trout, sardines, mackerel, walnuts, rye and buckwheat. Future research should address reasons behind dietary choices among populations identified as being at elevated risk of inadequate diets.
Acknowledgements
Financial support: This work was supported by the Nutrition Department of the Harvard T.H. Chan School of Public Health and the Institute of Statistics of the Federation of Bosnia and Herzegovina, who had no role in the design, analysis or writing of this article. Conflict of interest: None. Authorship: S.G.: manuscript writing, data collection, data analysis; A.J.K.: data analysis, manuscript editing; T.T.F.: study design, data analysis, manuscript editing; B.R.: study design, data analysis, manuscript editing; E.K.: funds acquisition, data collection, manuscript editing; E.S.: data analysis; A.K.: data analysis; J.M.: data collection, data analysis, manuscript editing; W.W.: study design and supervision, funds acquisition, final manuscript approval. Ethics of human subject participation: This study was conducted according to the guidelines laid down in the Declaration of Helsinki and all procedures involving research study participants were approved by the Ethics Committee of the Public Health Institute of the Federation of Bosnia and Herzegovina and the Harvard T.H. Chan School of Public Health Office of Human Research Administration. Written informed consent was obtained from all participants.
Supplementary material
To view supplementary material for this article, please visit https://doi.org/10.1017/S1368980019001988


