


In response to high rates of obesity(Reference Flegal, Kruszon-Moran and Carroll1,Reference Ogden, Carroll and Lawman2) , diabetes(Reference Magliano, Zimmet and Shaw3,Reference Menke, Casagrande and Geiss4) , diet-related diseases(5), poor diet quality(Reference Wang, Leung and Li6,Reference Wilson, Reedy and Krebs-Smith7) and insufficient consumption of fruit and vegetables(Reference Casagrande, Wang and Anderson8–Reference Middaugh, Fisk and Brunt10), promoting more cooking at home has been identified by policy makers and public health practitioners as a key strategy to improve eating habits in the USA(Reference Lichtenstein and Ludwig11–14). The focus on cooking as an important health behaviour is based on both the evidence as to the benefits of home cooking(Reference Mills, White and Brown15) and the strong associations of fast-food and other away-from-home food consumption with the aforementioned outcomes(Reference Todd, Mancino and Lin16–Reference Kant, Whitley and Graubard22). Evidence suggests that cooking meals at home more frequently is associated with lower energy intake(Reference Wolfson and Bleich23), lower consumption of sugar and fat(Reference Wolfson and Bleich23,Reference Taillie and Poti24) , higher consumption of fruits and vegetables(Reference Wolfson and Bleich25) and higher overall diet quality(Reference Tiwari, Aggarwal and Tang26). In smaller studies with non-nationally representative samples, cooking at home has been associated with higher Healthy Eating Index (HEI) scores(Reference Tiwari, Aggarwal and Tang26–Reference Larson, Perry and Story28). But in the USA, the association between frequency of cooking at home and an overall measure of diet quality has not yet been examined in a large, nationally representative sample.
Understanding the association between cooking meals at home and overall diet quality is important to better understand the potential of home cooking as a health behaviour that could help improve diet quality and address diet-related diseases. Cooking is a complex behaviour that encompasses multiple steps and competencies(Reference Wolfson, Bostic and Lahne29,Reference Short30) and is perceived and practised differently depending on contextual factors such as income or food access(Reference Virudachalam, Long and Harhay31–Reference Wolfson, Smith and Frattaroli33). Cooking more frequently may shift diets away from fast foods and other restaurant foods, and, depending on the cooking method and ingredients, cooking at home results in lower consumption of processed foods that are strongly associated with poor diet and diet-related health outcomes(Reference Hall, Ayuketah and Brychta34,Reference Monteiro, Levy and Claro35) . Cooking at home can also provide more control over the precise ingredients used, which, depending on what and how a person cooks, could have a positive influence on dietary intake, HEI scores and diet-related diseases such as obesity, diabetes and hypertension.
Overall, Americans spend less time cooking than in the past(Reference Smith, Ng and Popkin36). Moreover, there are substantial differences in cooking frequency based on income and socio-economic status(Reference Smith, Ng and Popkin36), with lower socio-economic groups more likely to cook at home always or never, and higher-income and higher socio-economic groups more likely to cook sometimes(Reference Virudachalam, Long and Harhay31). On average, low-income Americans also consume a higher proportion of their daily energy intake from at-home food sources than higher-income Americans(Reference Smith, Ng and Popkin36).
Of course, not all foods prepared at home are healthy; there is a large degree of heterogeneity in the nutritional content of meals prepared at home based on ingredients used and methods of preparation. Similar to disparities in diet quality based on income or socio-economic status(Reference Grimm, Foltz and Blanck9,Reference Darmon and Drewnowski37) , the relationship between cooking frequency and diet quality may also differ based on income(Reference Taillie and Poti24,Reference Wolfson and Bleich25) . Time, money for healthy ingredients and the availability of healthy food retailers in neighbourhood food environments are all factors that could account for differences in cooking practices that would result in differential associations between cooking frequency and diet quality based on income(Reference Wolfson, Bleich and Clegg Smith32,Reference Lavelle, McGowan and Spence38) .
The objective of the present study was to examine the relationship between cooking frequency and global diet quality, as measured by the HEI-2015, among American adults overall and among lower- and higher-income Americans. We hypothesized that diet quality would be higher among higher-income Americans, but that regardless of income, greater cooking frequency would be associated with higher diet quality.
Methods
Data and design
Data were obtained from the National Health and Nutrition Examination Survey (NHANES)(39). The NHANES is a cross-sectional, nationally representative, population-based survey designed to collect information on the health status, dietary intake and health-related behaviours of the US population. Participants are selected based on a multistage, clustered, probability-based sampling strategy(39). As part of data collection, NHANES participants answer questions about individual and household behaviours and characteristics and complete two 24 h dietary recalls fielded 3–10 d apart. The first 24 h dietary recall is conducted in-person with a trained NHANES health interview professional in a mobile examination centre. During the interview, survey respondents report detailed descriptions of the type and quantity of all foods and beverages they consumed during the previous 24 h. The second 24 h dietary recall occurs over the telephone. NHANES does not collect data regarding whether or not the food was cooked at home.
The present study used data from two waves of data collection (2007–2010) which are the only years in which the consumer behaviour module of the NHANES fielded a question about frequency of cooking dinner. A complete description of data collection procedures and analytic guidelines are available elsewhere(40).
Study sample
The study sample included adults aged 20 years or older with complete and reliable data from two 24 h dietary recalls (as determined by NHANES staff). The first dietary recall was conducted in-person during the NHANES data collection, the second was conducted over the telephone 3–10 d later. Participants were excluded if they were pregnant at the time of data collection (n 125). To eliminate implausible values and reduce the risk of misreporting dietary intake, participants with energy intake <2092 kJ (<500 kcal; n 40) or >20 920 kJ (>5000 kcal; n 82) were also excluded(Reference Leung, Ding and Catalano41). We excluded individuals who refused to answer or responded ‘I don’t know’ for cooking frequency (n 106) or if data on income were missing (n 757). The final analytic sample included 8668 adults.
Measures
Cooking frequency
Cooking frequency was measured by the following survey question, ‘During the past seven days, how many times did you or someone else in your family cook food for dinner or supper at home?’ This question was asked of all survey participants regardless of their living arrangements. Cooking frequency was categorized into the following four categories: (i) 0–2 times/week; (ii) 3–4 times/week; (iii) 5–6 times/week; and (iv) ≥7 times/week.
Diet quality
Diet quality was assessed using the HEI-2015(42), a measure of diet quality that assesses how well dietary intake aligns with key recommendations from the 2015–2020 Dietary Guidelines for Americans(43). Total HEI-2015 score ranges from 0 to 100, with 100 being the best and high scores indicating better diet quality. The HEI-2015 score is based on thirteen component parts measuring both adequacy and moderation food groups. Adequacy components are dietary elements that are encouraged, and higher scores reflect higher intake. Moderation components represent dietary elements that are recommended to be limited, and higher scores reflect lower intake. Adequacy components include total fruit (0–5 points), whole fruits (0–5 points), total vegetables (0–5 points), greens and beans (0–5 points), whole grains (0–10 points), dairy (0–10 points), total protein foods (0–5 points), seafood and plant proteins (0–5 points) and fatty acids (0–10 points). Moderation components include refined grains (0–10 points), sodium (0–10 points), added sugars (0–10 points) and saturated fats (0–10 points). Each component part is given a score and then component scores are summed to generate a total HEI-2015 score. For the present analysis, total HEI-2015 scores (and component scores) were calculated using dietary intake data averaged between the two 24 h dietary recall data points.
Other dietary intake measures included as control variables were total energy intake (averaged across the two 24 h dietary recalls) and, in supplemental analyses, number of fast-food meals per week (0–21), number of ready-to-eat meals consumed in the past 30 d (0–90) and number of frozen meals consumed in the past 30 d (0–90).
Income status
Household income was self-reported and then recalculated (by NHANES staff) as a percentage of the federal poverty level (FPL). We categorized individuals as either lower-income (<300 % FPL) or higher-income (≥300 % FPL).
Socio-economic and demographic study covariates
Covariates of interest included sex, age (20–30 years; 40–64 years; ≥65 years), race/ethnicity (non-Hispanic White; non-Hispanic Black; Hispanic; other), country of birth (born in the USA; foreign born), education (less than high school; high-school diploma or General Education Development (GED); more than high school), employment status (unemployed; working part-time; working full-time), marital status (not married; married or living with a partner), household size (<4 people; ≥4 people), participation in the Supplemental Nutrition Assistance Program (SNAP), participation in the Special Supplemental Nutrition Program for Women, Infants, and Children (WIC) and food security status (full; marginal; low; very low). Missing indicators were used to account for missing information regarding education status (n 9), employment status (n 59), marital status (n 5), SNAP participation (n 2), WIC participation (n 1148) and food security status (n 1).
Analysis
To produce nationally representative estimates, all analyses used dietary 2 d sample weights, as well as strata and psu survey weights provided by NHANES staff to account for the unequal probability of being selected due to the complex sampling strategy employed by NHANES, non-response for initial participation, non-response for each day of dietary recall and whether dietary recall data were collected on weekend days or weekdays. Multivariable linear regression models were used to examine the association between cooking frequency and HEI-2015 score, overall and stratified by income status, first adjusted for sex and age, and then adjusted for the covariates described above as well as total energy intake (averaged between both days of dietary recall). In fully adjusted models, all covariates were included regardless of significance based on prior literature showing a relationship between both cooking frequency and diet quality(Reference Virudachalam, Long and Harhay31,Reference Lang, Caraher and Dixon44) . We also conducted Wald tests of the interaction term between cooking frequency and income in the overall model and found the interaction to be statistically significant. Post-estimation margins commands were used to examine the predicted mean HEI-2015 score at different frequencies of cooking dinner. Generalized linear models with a gamma family and log link (to account for the skewed distribution of the individual component score data), also controlling for the covariates described above, were used to examine the relative difference in HEI-2015 component scores based on cooking frequency among lower- and higher-income American adults. Relative differences are interpreted as the percentage difference from the reference group. For all analyses, cooking 0–2 times/week was considered the reference group. Analyses were performed using the statistical software package Stata version 15.0, all tests were two-sided and significance was considered at P < 0·05.
In sensitivity analyses, we replicated the analyses described above with a lower income cut-off (200 % FPL) and with different treatments for the cooking frequency measure (continuous 0–7 times/week; and a three-category measure of cooking frequency 0–1, 2–5 and 6–7 times/week). Finally, in supplemental analyses, we also replicated HEI-2015 score models, overall and stratified by income, with additional adjustment for intakes of fast foods, ready-to-eat foods and frozen foods.
Results
Table 1 presents the characteristics of the study sample overall and stratified by household cooking frequency. Overall, 13 % of American adults aged ≥20 years lived in households where someone cooked dinner 0–2 times/week, 21 % lived in households where someone cooked dinner 3–4 times/week, 31 % lived in households where someone cooked dinner 5–6 times/week and 36 % lived in households where someone cooked dinner ≥7 times/week. Differences in cooking frequency based on age, race/ethnicity, country of birth, education, employment status, income status, marital status, household size, food security status, and SNAP and WIC participation were all significant at P < 0·001. Individuals who were ≥65 years old, Hispanic, foreign born, had less than a high-school education, were unemployed, had lower household income, were married or living with a partner, had ≥4 people in their household, received SNAP benefits, received WIC benefits and had less than full food security were more likely to cook ≥7 times/week. Cooking frequency did not differ based on sex.
Table 1 Sample demographics, overall and by frequency of cooking dinner at home, of US adults aged ≥20 years in the National Health and Nutrition Examination Survey (NHANES), 2007–2010 (n 8668)

GED, General Education Development; FPL, federal poverty level; SNAP, Supplemental Nutrition Assistance Program; WIC, Special Supplemental Nutrition Program for Women, Infants, and Children.
Analyses are weighted cross-tabulations among NHANES participants with valid 2 d dietary intake data and complete income and cooking frequency data; P value based on Pearson χ 2 test. Totals among covariates may not sum to 8668 or to 100 % due to missing data.
The association between cooking frequency and total HEI-2015 score, age- and sex-adjusted, and then also adjusted for sociodemographic covariates and total energy intake, is presented in Table 2 for the full sample and among lower- and higher-income adults. In age- and sex-adjusted models, in the full sample and among lower- and higher-income adults, greater cooking frequency was associated with higher total HEI-2015 score compared with cooking 0–2 times/week. Compared with cooking 0–2 times/week, cooking dinner ≥7 times/week resulted a 2·96-point increase in HEI-2015 score (P < 0·001) overall. Among lower-income individuals the increase was 2·68 points (P < 0·001) and among higher-income individuals the increase was 5·08 points (P < 0·001). In fully adjusted models, overall, compared with cooking dinner 0–2 times/week, greater cooking frequency was associated with higher total HEI-2015 score (3–4 times/week: +2·37 points, P = 0·005; 5–6 times/week: +3·01 points, P < 0·001; ≥7 times/week: +3·57 points, P < 0·001). Among lower-income adults, cooking dinner 3–4 times/week was associated with a 3·25-point increase in total HEI-2015 score (P < 0·001). Among lower-income adults, total HEI-2015 score was still higher among those who cooked dinner 5–6 times/week (+2·83 points, P = 0·005) and ≥7 times/week (+2·55 points, P = 0·001) compared with those who cooked dinner only 0–2 times/week, but the magnitude of the difference was less than for those who cooked 3–4 times/week. Among higher-income adults, cooking dinner frequently at home was associated with higher total HEI-2015 score (5–6 times/week: +3·23 points, P = 0·005; ≥7 times/week: +5·07 points, P < 0·001) compared with cooking 0–2 times/week.
Table 2 Associations between frequency of cooking dinner at home and total Healthy Eating Index-2015 score, overall and stratified by income, among US adults aged ≥20 years in the National Health and Nutrition Examination Survey, 2007–2010 (n 8668)

Coef., coefficient; SNAP, Supplemental Nutrition Assistance Program; WIC, Special Supplemental Nutrition Program for Women, Infants, and Children; FPL, federal poverty level.
Fully adjusted models adjusted for total energy intake, sex, age, race/ethnicity, country of birth, education, marital status, household size, SNAP participation, WIC participation and food security status. Lower-income defined as <300 % FPL, higher-income defined as ≥300 % FPL.
**P < 0·01, ***P < 0·001.
When consumption of fast foods, ready-to-eat foods and frozen foods were added to the models as additional control variables (see online supplementary material, Supplemental Table S1), the relationship between greater cooking frequency and higher diet quality remained significant in the full sample (3–4 times/week: +1·75 points, P = 0·029; 5–6 times/week: +1·87 points, P = 0·009; ≥7 times/week: +2·20 points, P = 0·001) and among higher-income (≥7 times/week: +3·60 points, P = 0·003) and lower-income (3–4 times/week: +2·51 points, P < 0·001; 5–6 times/week: +1·76 points, P = 0·050; ≥7 times/week: +1·31 points, P = 0·048) adults, but the magnitude of the effect was attenuated. Of the additional measures of dietary intake, fast food was significantly associated with differences in total HEI-2015 score (overall: −0·83 points, P < 0·001; lower-income: −0·66 points, P < 0·001; higher-income: −1·00 points, P < 0·001), as was frozen food (overall: −0·11 points, P = 0·006; lower-income: −0·15 points, P < 0·001).
Figure 1 displays the predicted total HEI-2015 scores based on the fully adjusted models shown in Table 2. Overall, HEI-2015 score increased from 50·57 points among American adults living in households where dinner was cooked 0–2 times/week to 54·54 points among adults living in households where dinner was cooked ≥7 times/week. Predicted total HEI-2015 score among adults who cooked 3–4 times/week (overall: 53·34 points; lower-income: 52·93 points; higher-income: 54·24 points) and 5–6 times/week (overall: 53·97 points; lower-income: 52·51 points; higher-income: 55·50 points) was similar regardless of income status. Among adults in households in which dinner was cooked ≥7 times/week, total HEI-2015 score differed significantly based on income status (lower-income: 52·51 points; higher-income: 57·35 points; P = 0·003).
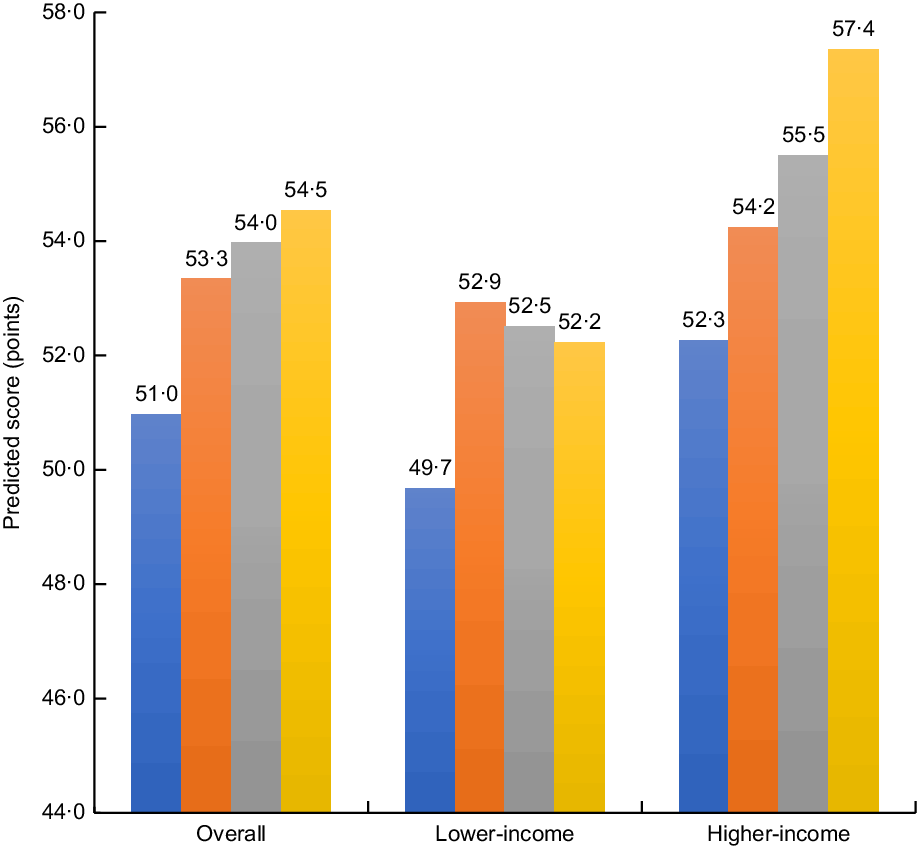
Fig. 1 Predicted total Healthy Eating Index-2015 scores from fully adjusted models according to frequency of cooking dinner at home (![]() , 0–2 times/week;
, 0–2 times/week; ![]() , 3–4 times/week;
, 3–4 times/week; ![]() , 5–6 times/week;
, 5–6 times/week; ![]() , ≥7 times/week), overall and by income, among US adults aged ≥20 years in the National Health and Nutrition Examination Survey 2007–2010 (n 8668). Predicted margins based on post-estimation margins command after linear regression models adjusted for total energy intake, age, sex, race/ethnicity, country of birth, education, employment status, marital status and household size. Lower-income defined as <300 % of the federal poverty level (FPL), higher-income defined as ≥300 % FPL
, ≥7 times/week), overall and by income, among US adults aged ≥20 years in the National Health and Nutrition Examination Survey 2007–2010 (n 8668). Predicted margins based on post-estimation margins command after linear regression models adjusted for total energy intake, age, sex, race/ethnicity, country of birth, education, employment status, marital status and household size. Lower-income defined as <300 % of the federal poverty level (FPL), higher-income defined as ≥300 % FPL
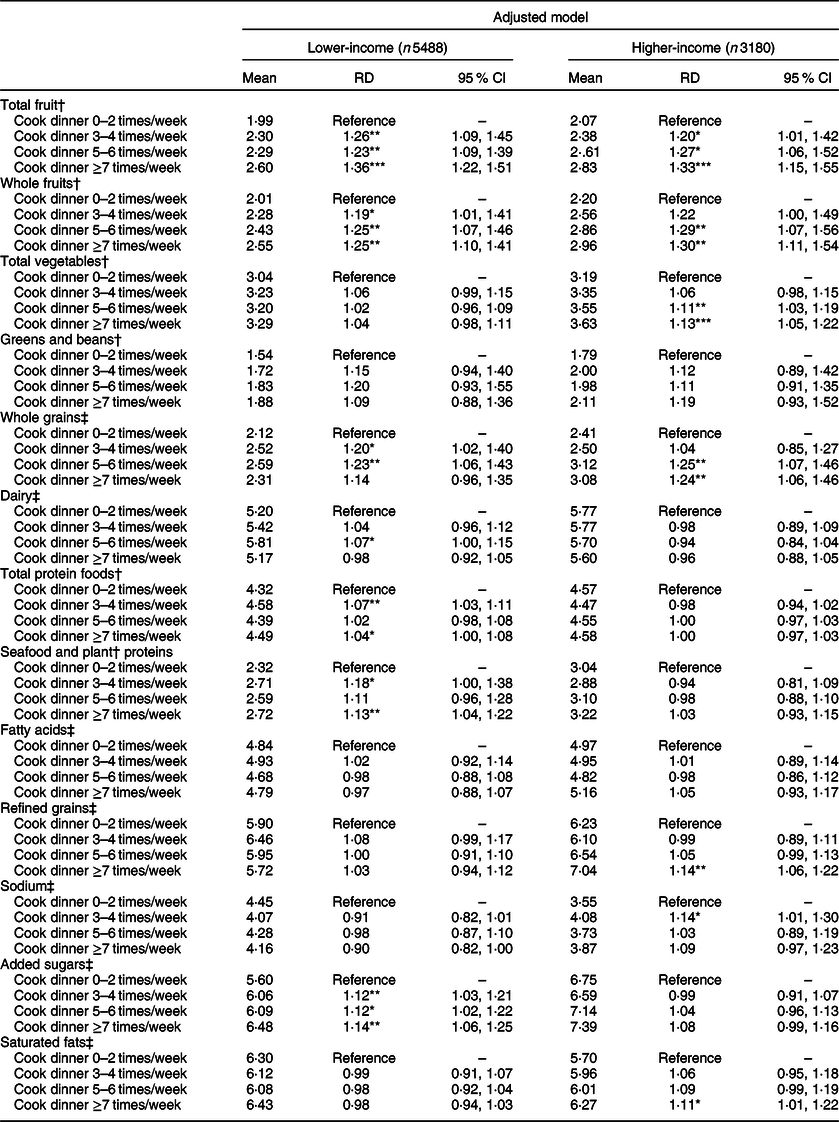
Table 3 presents the mean scores and relative differences based on cooking frequency for the dietary components that comprise the total HEI-2015 score among lower-income and higher-income adults. Greater cooking frequency was associated with higher score on several key HEI-2105 adequacy and moderation components. Among lower-income adults, compared with cooking dinner 0–2 times/week, more frequent cooking at home (≥7 times/week) was associated with a higher score for the following adequacy components: total fruit (+36 %; 95 % CI 22, 51 %), whole fruits (+25 %; 95 % CI 10, 41 %) and seafood and plant proteins (+13 %; 95 % CI 4, 22 %); and with higher score for the following moderation component: added sugars (+14 %; 95 % CI 6, 25 %). Among higher-income adults, compared with cooking dinner 0–2 times/week, more frequent cooking at home (≥7 times/week) was associated with a higher score for the following adequacy components: total fruit (+33 %; 95 % CI 15, 55 %), whole fruit (+30 %; 95 % CI 11, 54 %), total vegetables (+13 %; 95 % CI 5, 22 %) and whole grains (+24 %; 95 % CI 6, 46 %). Among higher-income adults, more frequent cooking at home was associated with a higher score for the following moderation components: refined grains (cooking ≥7 times/week: +14 %; 95 % CI 6, 22 %) and sodium (cooking 3–4 times/week: +14 %; 95 % CI 1, 30 %).
Table 3 Predicted Healthy Eating Index-2015 component scores, by frequency of cooking dinner at home, among US adults aged ≥20 years in the National Health and Nutrition Examination Survey, 2007–2010 (n 8668)
RD, relative difference; SNAP, Supplemental Nutrition Assistance Program; WIC, Special Supplemental Nutrition Program for Women, Infants, and Children; FPL, federal poverty level.
Adjusted model results are from glm models (with gamma family and log link) adjusted for age, sex, race/ethnicity, country of birth, education, marital status, household size, SNAP participation, WIC participation, food security status and total energy intake. Lower-income defined as <300 % FPL, higher-income defined as ≥300 % FPL.
*P < 0·05, **P < 0·01, ***P < 0·001.
† Maximum score = 5.
‡ Maximum score = 10.
In sensitivity analyses using different treatments of the cooking frequency measure and lower income defined as <200 % FPL, results were robust to these different definitions.
Discussion
In the present study, we used NHANES data from 2007 to 2010 to examine the relationship between household cooking frequency and diet quality overall and by income status. To our knowledge, the present study is the first nationally representative one in the USA of the relationship between cooking frequency and diet quality. We found that higher frequency of cooking dinner was associated with better diet quality overall, and among higher- and lower-income Americans. However, the magnitude of the positive increase in HEI-2015 score associated with cooking frequency was much greater among higher-income Americans than it was among lower-income Americans. The positive association between cooking frequency and higher HEI-2015 score remained significant even after adjusting for consumption of fast foods, ready-to-eat foods and frozen foods. Examination of the individual components of the total HEI-2015 score revealed that while scores for total fruit and whole fruits increased with greater cooking frequency for both lower- and higher-income Americans, cooking frequency was associated with better scores for total vegetables, whole grains, refined grains and sodium only among higher-income Americans. Results from the study provide nationally representative evidence that cooking meals more frequently at home is associated with better diet quality, although this positive association is strongest among higher-income Americans.
Our findings are consistent with a growing body of evidence showing that home cooking is associated with better diet quality(Reference Mills, White and Brown15,Reference Tiwari, Aggarwal and Tang26,Reference Blake, Wethington and Farrell27) , including nationally representative evidence from the UK(Reference Mills, Brown and Wrieden45). In other smaller and regional studies of cooking frequency and HEI score in the USA, more frequent cooking at home has been associated with higher HEI score(Reference Tiwari, Aggarwal and Tang26,Reference Blake, Wethington and Farrell27) . Another study of African-American youths in Baltimore, however, found that cooking frequency was not associated with HEI score(Reference Sattler, Hopkins and Anderson Steeves46). Our finding regarding the difference in the magnitude of the positive association between cooking and diet quality based on income is also consistent with prior research showing differential effects of cooking at home among lower-income groups compared with those with higher incomes and that cooking frequency or practices may differ based on income or socio-economic status(Reference Mills, White and Brown15,Reference Wolfson and Bleich25,Reference Virudachalam, Long and Harhay31) . Our results are inconsistent with those from a recent study from the UK which found that preparing meals at home was not associated with diet quality(Reference Clifford Astbury, Penney and Adams47). However, the latter study differed from ours in several important respects. Two of the most important differences that may account for the conflicting findings are that: (i) their sample was limited to individuals who scored within the top tertile for diet quality and were therefore systematically different from the broader, nationally representative sample from which they were drawn; and (ii) their measure of home food preparation was based on proportion of energy intake from foods prepared at home (and whether foods counted as being prepared at home was determined by the authors) rather than frequency of cooking meals (in the case of the present study, dinner) at home. In the present study, it should be noted that while cooking frequency was associated with differences in diet quality, the HEI-2015 is scored on a 100-point scale (with 100 being best) and the improvements to diet quality associated with greater cooking frequency were comparatively modest.
The definition of ‘cooking dinner or supper at home’ may be understood differently(Reference Wolfson, Bleich and Clegg Smith32) and there may be heterogeneity in the kinds of foods NHANES participants included when they answered that question. It has also been posited that focusing on cooking frequency may really capture the effect of consuming fewer fast foods, rather than an independent effect of cooking more meals at home. When they adjusted for fast foods in their models, Smith Taillie and Poti(Reference Taillie and Poti24) found that the effect of cooking frequency on overweight/obesity was no longer significant. The fact that our estimate of the association between cooking and total HEI-2015 score remains significant (although the magnitude of the effect was attenuated) after adjustment for fast foods, ready-to-eat foods and frozen foods indicates that, in both higher- and lower-income populations in the USA, there is a robust positive association between cooking frequency and diet quality.
It is notable that we find such a disparity in the magnitude of the association between cooking frequency and diet quality between higher- and lower-income Americans. The fact that more frequent home cooking was not associated with higher scores for vegetables, whole grains, refined grains and sodium among lower-income Americans suggests some systematic differences in the ingredients that higher- and lower-income Americans use when they cook at home. Numerous studies have documented barriers that lower-income Americans face to procuring and preparing healthy foods including lack of access to grocery stores, lack of time to cook, and difficulty affording fresh, perishable or unprocessed ingredients(Reference Wolfson, Bleich and Clegg Smith32,Reference Rose, Bodor and Hutchinson48–Reference Bowen, Elliott and Brenton51) . Increasing availability of healthy frozen foods, particularly frozen vegetables, in neighbourhoods with low access to healthy foods may help decrease barriers to healthy home cooking. Frozen vegetables are often more affordable, less perishable and have equal (or, in some instances, higher) nutritional content than fresh vegetables. Efforts to increase access to frozen vegetables in low-income neighbourhoods may be easier and more affordable for consumers and store owners than current efforts that focus more on fresh produce(52). In addition, the fact that the highest HEI-2015 score among lower-income Americans was associated with cooking 3–4 times/week, rather than more frequently, suggests that the ‘forced choice’ between cooking always or never documented by Virudachalam et al.(Reference Virudachalam, Long and Harhay31) may reflect that lower-income Americans who cook frequently may do so because they lack resources to eat out and therefore may also struggle to procure high-quality, healthy ingredients to cook at home. In addition to affordability of high-quality ingredients, lack of time to prepare food, unpredictable schedules and other conflicting priorities may also lead lower-income individuals to use more highly processed ingredients that tend to be time-saving, but are less nutrient-dense(Reference Monteiro, Levy and Claro35,Reference Moubarac, Martins and Claro53,Reference Bowen, Brenton and Elliott54) . The majority of Americans do cook frequently, on average five or more times per week(Reference Wolfson and Bleich23). However, the ingredients and products they are able to purchase vary greatly, which may contribute to disparities in diet quality between lower- and higher-income Americans regardless of how frequently they cook.
The 2015–2020 Dietary Guidelines for Americans recommend cooking at home to achieve a healthy diet(43). However, food cooked at home is not inherently healthy and it is entirely possible to consume a high-quality diet without cooking at home at all, assuming one has access to healthy ‘away-from-home’ food sources and can afford to purchase healthy foods. Similarly, as the results of the present study indicate, for lower-income Americans, cooking frequently at home is not associated with improved diet quality to the same degree as it is for those with higher incomes. Therefore, while the focus on cooking at home as an important determinant of diet quality is not misplaced, it requires a more nuanced approach. Numerous interventions to improve cooking skills and build cooking knowledge, generally targeted towards lower-income groups, have been implemented and evaluated (with somewhat mixed results) in recent years(Reference Reicks, Kocher and Reeder55,Reference Reicks, Trofholz and Stang56) . Such interventions may address important gaps in knowledge and skills, but should also consider other more structural barriers to healthy cooking at home, in particular the role of time/convenience, price/affordability of ingredients and physical access to food outlets selling affordable, high-quality ingredients. Meal delivery kits have gained popularity in recent years in the USA as they tend to decrease the time and mental energy needed to cook meals at home. Meal delivery kits may increase frequency of cooking and may help develop cooking skills and foster greater enjoyment of cooking at home, which could have spillover effects for cooking without the meal delivery kits. However, while meal delivery kits are highly convenient and address many barriers to cooking at home, not all are healthy and most are not affordable for low-income groups. It remains to be seen whether or how meal delivery kits shift cooking attitudes, skills and behaviour, and whether they increase disparities in cooking and diet quality between high- and low-income populations. Cooking at home, and doing so healthfully, is a complex and difficult task with numerous structural barriers, particularly for lower-income individuals(Reference Bowen, Elliott and Brenton51). From a policy perspective, encouraging cooking at home is a laudable goal, but efforts must also be made enable individuals to easily and affordably consume a healthy diet regardless of how frequently they cook.
Our results regarding differences in the HEI-2015 component scores based on cooking frequency and the differences between the higher- and lower-income groups highlight some important areas for future research. First, the fact that fruits, but not vegetables, were associated with cooking frequency among the lower-income groups is somewhat counter-intuitive because fruits generally require little, if any, cooking to be consumed. The fact that cooking was associated with higher vegetable consumption for the higher-income group, but not the lower-income group, highlights the need for additional research into whether this may be a function of access and affordability, or other factors. Additional research is needed to better understand potential differential access to fruits v. vegetables or other factors that might influence how cooking is related to consumption of specific foods and food groups, as well as how this relationship might vary based on income.
Study limitations
The present study should be considered in light of several limitations. First, the cross-sectional nature of the NHANES does not allow us to make causal inferences regarding the effect of cooking on diet quality. Second, cooking frequency and dietary intake are both self-reported, which could result in recall and social desirability bias, including over-reporting of cooking frequency and under-reporting of the dietary data. Third, we measure diet quality using HEI-2015, which is tied to adherence to the 2015–2020 Dietary Guidelines for Americans and a validated, comprehensive measure of dietary intake. However, there are other measures of diet quality (e.g. Dietary Approaches to Stop Hypertension (DASH)) that could also be used and may produce different results. Fourth, we excluded individuals without 2 d of valid dietary recalls from our analytic sample which could have biased our results regarding the association between cooking frequency and diet quality. In our sample, the unweighted percentage of individuals with only the first day of dietary recall was 12 % compared with 80 % with 2 d of valid dietary recalls. In unweighted cross-tabulations, individuals with only the first day of dietary recall data differed from those with 2 d of dietary recall data based on demographics and cooking frequency. They also had lower HEI-2015 scores than those with 2 d of dietary recalls. However, the sample weights we used account for additional non-response to the second 24 h dietary recall in addition to accounting for the complex survey design and sampling strategy, which may mitigate some of this concern and still allows for nationally representative estimates. Fifth, in the NHANES, cooking frequency was measured only via the single question about household frequency of cooking dinner, and this question was asked only from 2007 to 2010. How frequently the particular respondent consumed the meals cooked at home remains unknown. As mentioned above, there is considerable room for interpretation regarding what ‘counts’ as cooking and there could be wide variation in the types of foods and ingredients NHANES participants considered when answering this question. However, our supplemental analyses adjusting for fast foods, ready-to-eat foods and frozen foods mitigate some of this concern. Furthermore, it is possible that individuals with living arrangements other than living with families (e.g. young adults who live in house shares or with roommates) may interpret this question differently. NHANES also does not collect information about availability of kitchen tools or equipment, which could influence cooking frequency as well as the types of food prepared. It is also possible that cooking practices may have shifted since the years in which this question was asked in the NHANES in such a way that would produce different results should this study be replicated with more recent nationally representative data.
Conclusion
In this large, nationally representative sample of American adults, we find that having someone in the household cook dinner more frequently at home is associated with better diet quality, as measured by the HEI-2015, overall and among higher- and lower-income groups. The magnitude of the association between cooking frequency and diet quality is lower among lower-income adults compared with those having higher incomes, however. Results from the present study add to a growing body of evidence showing that cooking meals more frequently at home is a key strategy for improving diet quality, although this positive association is more nuanced among lower-income Americans. Efforts to help Americans cook healthy meals at home should reflect this nuance and should be paired with other interventions to reduce barriers to procuring, preparing and consuming healthy foods, regardless of how frequently one cooks at home.
Acknowledgements
Financial support: C.W.L. was supported by grant 4R00 HD084758 from the Eunice Kennedy Shriver National Institute of Child Health and Human Development, which had no additional role in the design, analysis or writing of this article.. Conflict of interest: The authors have no conflicts of interest to report. Authorship: J.A.W. conceived of the study and developed the hypotheses. C.W.L. assembled the analytic data set. J.A.W. performed the statistical analyses. All authors contributed to the interpretation of the study findings. J.A.W. drafted the manuscript and all authors contributed to the final draft. Ethics of human subject participation: Not subject to institutional review board approval as this study consisted of secondary data analysis of de-identified, publicly available data.
Supplementary material
To view supplementary material for this article, please visit https://doi.org/10.1017/S1368980019003549


