Introduction
Mount Logan (summit 60˚34’ N, 140˚24’W; 5957 m) in the heavily glaciated Saint Elias Mountains is the highest mountain in Canada. It is situated at the end of the North Pacific storm track (Reference BlackmonBlackmon,1976) along the main atmospheric pathway by which water vapor enters the Mackenzie River basin (Reference Smirnov and MooreSmirnov and Moore,1999). It is also located in the center of the region that experiences one of the largest extratropical responses to the El Niño–Southern Oscillation (ENSO) (Reference Horel and WallaceHorel and Wallace,1981). A recent analysis of the Mount Logan ice core has identified a statistically significant correlation that exists between snow accumulation at the site and the ENSO over the past 150 years (Reference Moore, Holdsworth and AlversonMoore and others, 2001). A contributory factor leading to this correlation is the high elevation of the site that allows it to sample the mid- and upper-tropospheric flow where the extratropical response to ENSO has its largest amplitude (Reference DeWeaver and NigamDeWeaver and Nigam, 1995).
Our focus in this paper is on identifying the relationships that exist between snow accumulation at the site and climate variability over the Pacific Ocean and North America. In the following section, we describe the data and methods used in this paper. This is followed by a presentation of the results obtained. We conclude with a discussion of our results and a summary of the paper.
Data and Methods
In this paper we make use of the annually resolved snow-accumulation time series obtained from an ice core drilled at an elevation of 5340 ma.s.l. on Mount Logan (Reference Holdsworth, Krouse, Nosal, Bradley, D and JonesHoldsworth and others, 1992). Details on the stratigraphic techniques used in dating of the core can be found in Reference HoldsworthHoldsworth (1986), Reference Holdsworth, Krouse, Nosal, Bradley, D and JonesHoldsworth and others (1992) and Whitlow and others (1994). the record of the ice core extends from 1693 to 1987. the section prior to 1736 does not have annual snow accumulations assigned due to a lack of reliable seasonal indicators. Snow accumulation is based on a calendar-year basis. for the period of interest in this paper, 1948–87, the dating error is estimated to be ±3months. This is comparable with dating errors of Greenland ice cores (Reference Bolzan and StrobelBolzan and Strobel, 1994).
We use a compositing technique to extract information regarding the climate signal contained in the snow-accumulation time series. This technique attempts to identify coherent structures in the atmosphere that are associated with anomalous snow accumulation at the Mount Logan site. This is accomplished by constructing composites or averages of atmospheric fields for years in which snow accumulation at the site was either anomalously high or low. the composites are compared to climatology, and their significance assessed by comparison to the statistics of randomly selected composites of the same size. the composites are constructed with global meteorological fields contained within the U.S. National Centers for Environmental Prediction (NCEP) re-analysis data. the NCEP re-analysis covers the period from 1948 to the present with a horizontal resolution of approximately 2˚ at the surface and at 17 levels in the troposphere and stratosphere. the key innovation employed in this and other re-analyses is the use of a “frozen” or time-invariant data-assimilation system that is used to assimilate all available historical data with the objective of producing time series of the state of the atmosphere that are free of discontinuities and errors resulting from changes in the model physics or the data-assimilation system (Reference TrenberthTrenberth, 1995). There are nevertheless concerns that the changing mix, density and location of observations that go into a re-analysis may introduce spurious trends. This is especially true with regard to the introduction of space-based observations in the late 1970s and 1980s (Reference SanterSanter and others, 1999; Reference Trenberth, Stepaniak, Hurrell and FiorinoTrenberth and others, 2001). Much of the focus of these concerns is on stratospheric temperature trends. As we restrict our attention to the troposphere, we feel that these trends have a negligible impact on our results.
We use the 250 mbar geopotential height and winds to characterize the atmospheric circulation associated with snow accumulation at Mount Logan. This pressure surface is located in the upper troposphere where the extratropical response to ENSO is largest (Reference DeWeaver and NigamDeWeaver and Nigam, 1995) and where the flow provides information on the intensity and position of the mid-latitude jet stream. the extratropical large-scale flow in the mid- and upper troposphere consists mainly of horizontal motions, so the circulation at 250 mbar is representative of a wide range of heights, roughly from 200 to 700 mbar. Tropospheric temperatures are characterized using the so-called “MSU 2LT” temperature which represents a weighted average of tropospheric temperatures, with the largest contribution coming from the 750 mbar pressure level (Reference SanterSanter and others, 1999). It is based on a temperature that is retrieved from data obtained by the Microwave Sounding Unit (MSU) that is flown on the U.S. National Oceanic and Atmospheric Administration (NOAA) family of polar orbiting satellites. This temperature has been widely used in assessing and reconciling tropospheric temperature trends as observed from space and from radiosonde data (Reference SanterSanter and others, 1999; United States National Research Council, 2000). It is computed from the 17 levels of air-temperature data in the re-analysis according to weights that simulate the response of the MSU (Reference Spencer and CristySpencer and Cristy, 1992; Reference SanterSanter and others, 2000). the temperature at the Earth’s surface is of particular importance for human concerns, as well as being a key indicator of natural climate variability and anthropogenic climate change. Accordingly we also investigate the relationship between surface temperature variability and snow accumulation at the Mount Logan site. In the NCEP re-analysis, the surface temperature is a hybrid field. Over the ocean, the surface temperature is prescribed, while over land and sea ice the surface temperature is an analyzed variable (Reference KalnayKalnay and others, 1996).
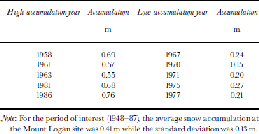
Our period of interest, 1948–87, spans the overlap between the snow-accumulation time series and the NCEP re-analysis. Figure 1 shows the annual snow-accumulation time series over this period. Years with anomalous snow accumulation are defined as those years when the snow accumulation is one standard deviation above or below the mean. These years are listed in Table 1. for each field, composites of years with high and low snow accumulation are constructed. In all cases, annual mean fields from the re-analysis, calculated on a calendar-year basis, are used in the construction of the composites.
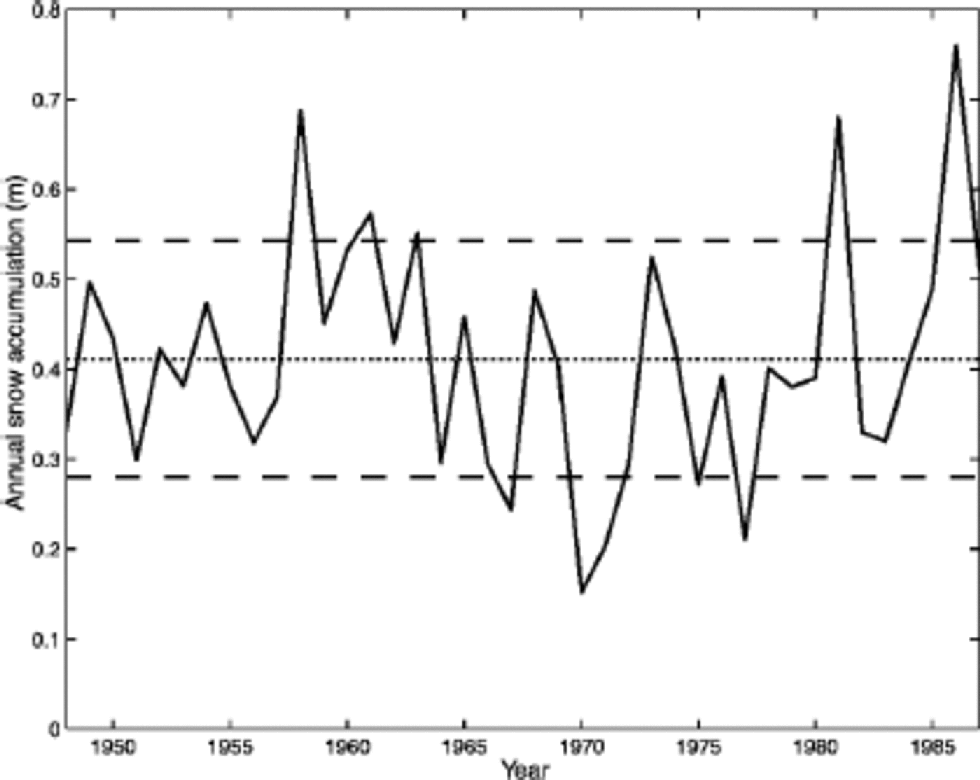
Fig. 1 Annual snow-accumulation time series from the Mount Logan ice core, 1948–87. the dotted line indicates the mean value over this period. the upper and lower dashed lines indicate one standard deviation above and below the mean value.
Table 1. Classification of years with anomalously high and low snow accumulation at the Mount Logan site
The statistical significance of the signal contained in these composites is assessed using resampling theory (Reference EfronEfron,1982). This is done by comparing the magnitude of the composite signal at each gridpoint to the probability distribution of noise associated with random samples of the same size (Reference Gershunov, P and BernettGershunov and Barnett, 1998). In addition, the stability of the composite is tested. This is done by comparing the magnitude of the intracomposite standard deviation to the probability distribution of intracomposite standard deviation obtained with random samples of the same size. to estimate the probability distributions, a Monte Carlo technique is used in which 500 randomly chosen samples were selected without replacement from the set of all 40 years of data in the period 1948–87. At a given gridpoint, a given composite is considered statistically significant at the 95% level if both test results are in excess of the 95th percentile of the underlying probability distribution. Composites are displayed as anomalies with respect to the long-term means,1948–87.
Results
In Figure 2 we present the composites of the 250 mbar geopotential-height and horizontal wind fields for high and low snow-accumulation conditions at the Mount Logan site. Both composites exhibit statistical significance at the 95% level over large regions of the Pacific Ocean as well as over North America. the extrema in the vicinity of Mount Logan are significant at the 99% level. the structure of these composites is similar to those of the spatial cross-correlation fields derived using an independent method and presented in Reference Moore, Holdsworth and AlversonMoore and others (2001). This similarity provides a confirmation of the interpretation that anomalous snow accumulation at the Mount Logan site is associated with a wave-like pattern in the upper troposphere that radiates from the central equatorial Pacific towards northwestern North America. Anomalously heavy snow accumulation at the Mount Logan site is associated with a dipole anomaly in the geopotential height field, with a region of low values over the eastern North Pacific and a region of high values over western North America. the wind field associated with this anomaly results in a southward movement of the upper-level jet stream over the eastern North Pacific and its northward displacement along the west coast of North America. This anomaly in the wind field results in an enhanced advection of moisture from the tropics into the vicinity of the Mount Logan site and is thus consistent with enhanced snow accumulation at the site.
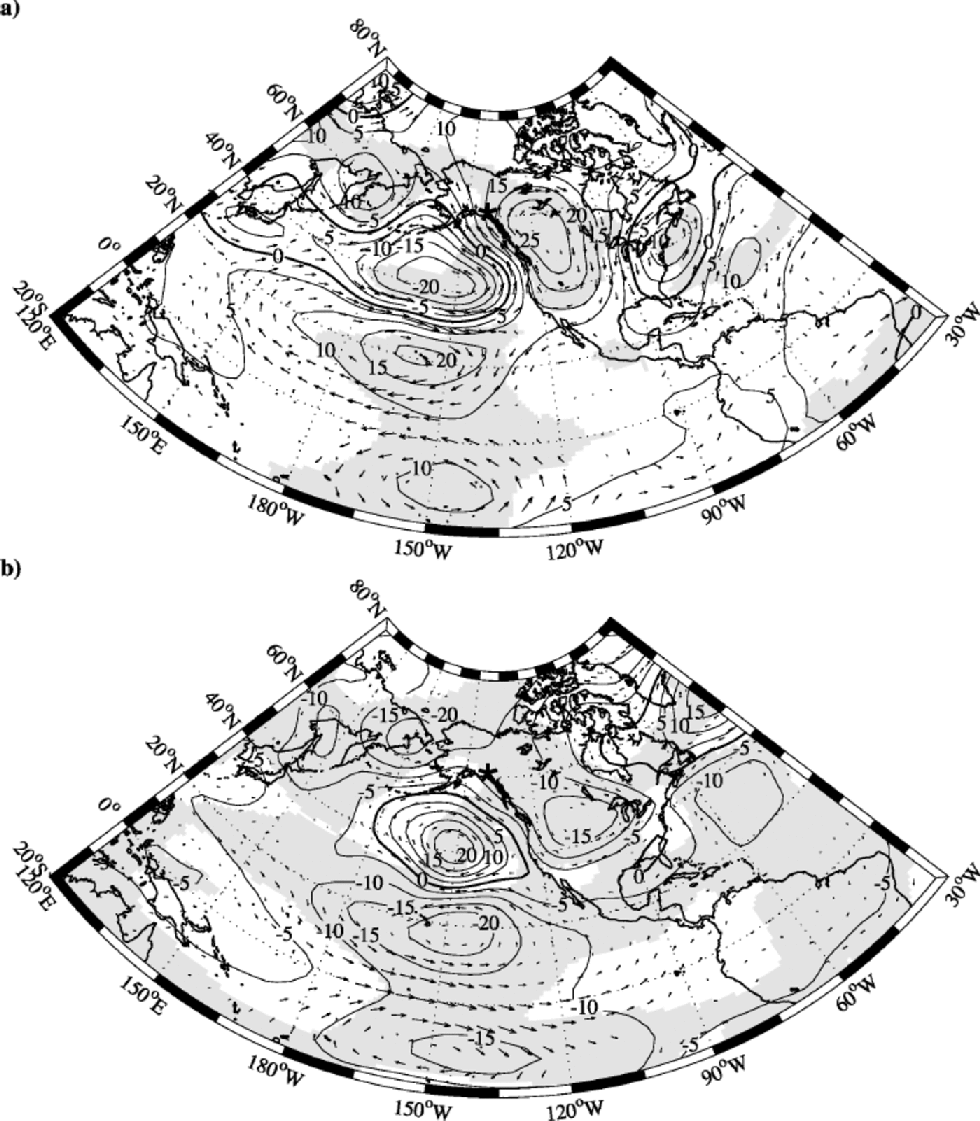
Fig. 2 Composites of the annual mean 250 mbar geopotential-height and horizontal wind fields for the years in which snow accumulation at Mount Logan (indicated by the asterisk) was anomalously high (a) and anomalously low (b). Difference fields from the long-term means (determined for the period 1948–87) are shown. Thus negative (positive) values indicate regions where the composite is smaller (larger) in magnitude than the long-term mean. Shaded regions are those where the height anomaly is statistically significant at the 95% level. the horizontal wind field is only shown at those locations where at least one of its components is significant at the 95% level.
The “low”composite has essentially the opposite structure, with a region of anomalously high geopotential heights over the eastern North Pacific and anomalously low values over western North America. the sense of the upper-level flow is also reversed, implying that the Mount Logan site is in a flow regime with a reduction in the advection of moist tropical air over the site. In addition to the correlation with height anomalies in the tropical Pacific noted by Reference Moore, Holdsworth and AlversonMoore and others (2001), the composites indicate that there are correlations between snow accumulation at the Mount Logan site and upper-level height anomalies in Siberia and the western North Atlantic.
In Figure 3, we present the “high” and “low” composites of the MSU 2LT temperature. As was the case for the 250 mbar flow, there are large regions of the North Pacific Ocean and North America where the anomalies are statistically significant at the 95% level. the extrema of the anomalies in the vicinity of Mount Logan are significant at the 99% level. the “high” composite anomaly indicates that enhanced snow accumulation at the Mount Logan site is associated with a band of warmer tropospheric temperatures extending eastwards from the central tropical Pacific to encompass much of western North America. the structure of this region of warm temperatures is consistent with the corresponding geopotential-height and wind anomalies shown in Figure 2a. There is a large region of the mid-latitude Pacific extending from Japan to approximately 120˚W where lower tropospheric temperatures are associated with anomalously heavy snow accumulation at the Mount Logan site. There is also a similar region situated over southeastern North America.
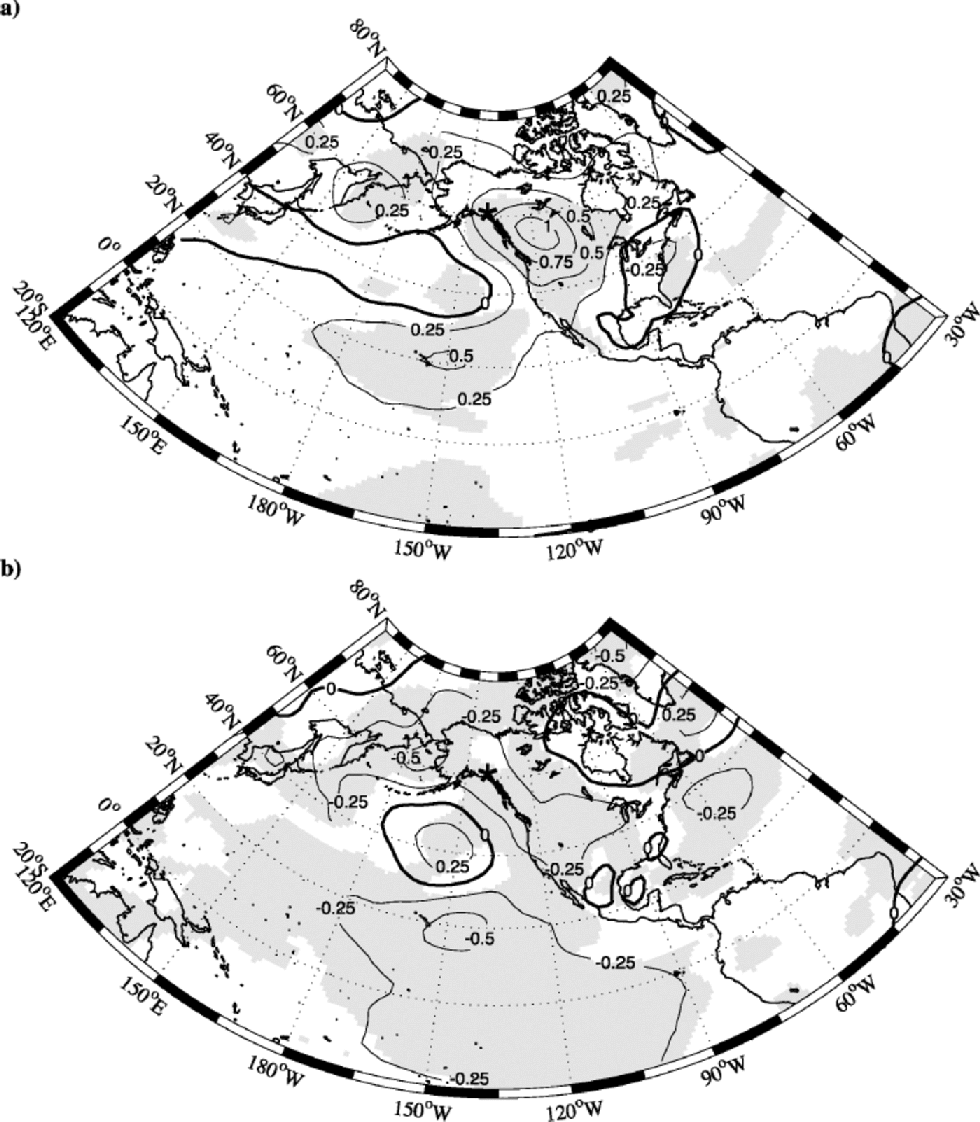
Fig. 3 As in Figure 2 except for the MSU 2LT temperature.
The “low” composite shows that reduced snow accumulation at the Mount Logan site is associated with low tropospheric temperatures over much of the central tropical Pacific and western North America. However, the magnitude of the anomaly is considerably smaller than that observed in the “high” composite. Furthermore, unlike the “high” composite, there is only an isolated region in the central Pacific where an anomaly of the opposite sign is observed. Over eastern North America there are also differences between the “high” and “low” composites. Most notably, the region where the anomaly is of opposite sign to that over western North America is located over the southeastern United States in the “high” composite, and over eastern Canada and the western Atlantic in the “low” composite.
In Figure 4, we present the “high” and “low” composites of the surface temperature field from the NCEP re-analysis. In these composites, no data are presented north of 60˚N due to complications introduced by interannual variability in sea-ice cover. the composites for this field are considerably noisier than the others presented. This is partly due to the prescribed nature of the field over the ocean and partly due to topographic influences over land. Notwithstanding this noise, the composites are statistically significant at the 95% level over extensive regions of the North Pacific Ocean and North America, with the extrema in the vicinity of Mount Logan significant at the 99% level. the structure of the composites is broadly similar to that of the MSU 2LT composites. This is not surprising given the coupling that exists between surface and lower-tropospheric temperatures (United States National Research Council, 2000). This similarity is reinforced by, but not solely attributable to, the small contribution that the surface temperature makes to the MSU 2LT temperature (Reference SanterSanter and others, 1999). With regard to the ocean, the “high” composite shows that enhanced snow accumulation at the Mount Logan site is associated with elevated sea-surface temperatures over much of the tropical Pacific and eastern North Pacific and a band of depressed sea-surface temperatures extending eastwards from Japan to approximately 140˚W. Over the North American continent, the composite has a dipole structure similar to that observed in Figure 3a, with elevated temperatures in the northwest and depressed temperatures in the southeast. the “low”composite is for the most part oppositely structured. In particular, reduced snow accumulation at Mount Logan is associated with depressed sea-surface temperatures over the tropical Pacific, most notably along the Equator, and elevated sea-surface temperatures extending eastwards from Japan. There is evidence of another warm tongue extending from Indonesia to the northeast. Reduced snow accumulation at the Mount Logan site is also associated with elevated surface temperatures over Hudson Bay and the Labrador Sea. This is similar to what is observed in the “low” MSU 2LT composite, except that the elevated surface temperatures are restricted to oceanic regions in the latter case.
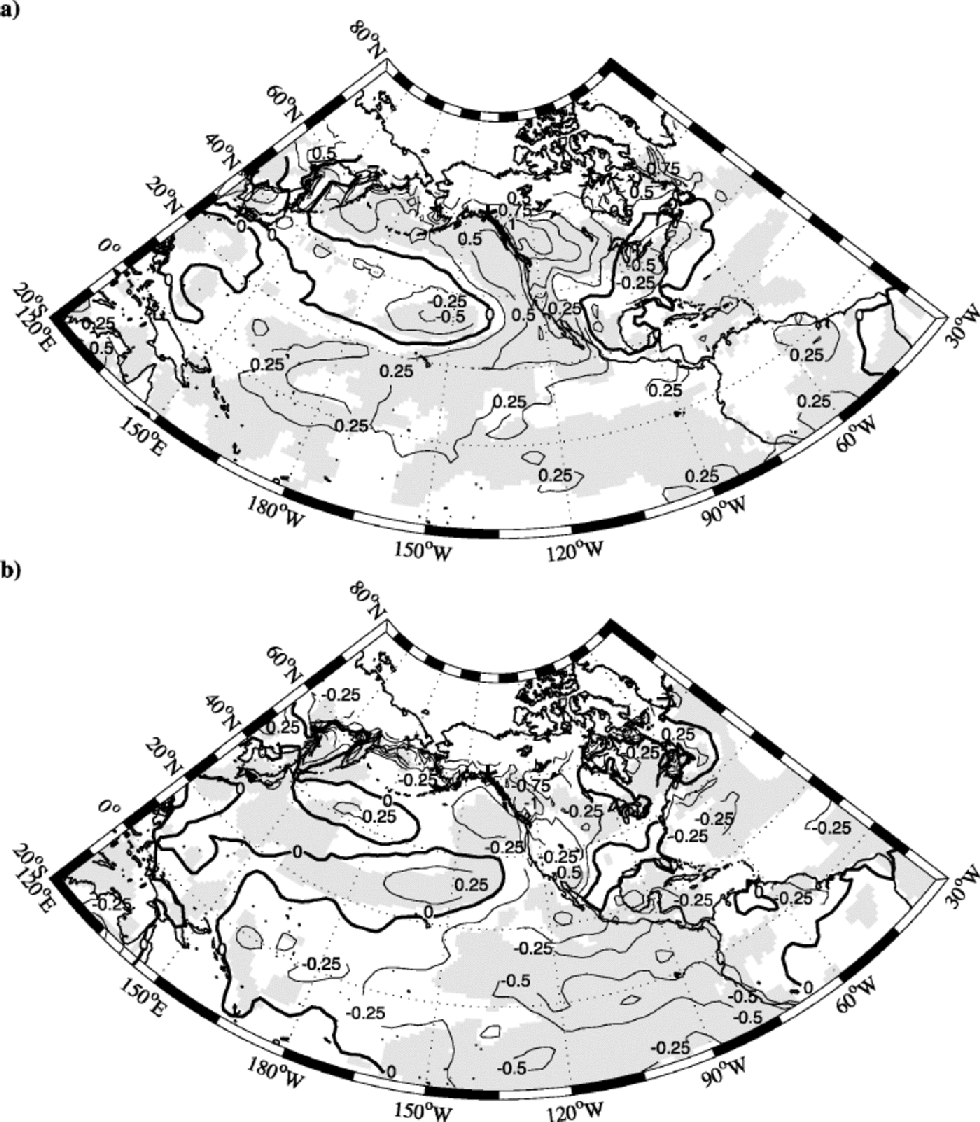
Fig. 4 As in Figure 2 except for the surface temperature.
Discussion
The compositing technique employed in this study has several advantages over the cross-correlation technique of Reference Moore, Holdsworth and AlversonMoore and others (2001). Most notably, it independently determines the climate signal associated with anomously high and low snow accumulation at the site. for the fields that we have investigated, we have identified instances where there are significant differences, both in magnitude and in spatial pattern, in the climate signal associated with these two states. the statistical significance of the composites is determined using resampling theory. Unlike other tests of statistical significance, resampling theory makes no assumptions regarding the characteristics of the underlying, and inherently unknown, probability distributions. Rather, by using a Monte Carlo technique, it constructs an approximation to these distributions.
The results presented here provide an independent methodological confirmation of previous conclusions reached by Reference Moore, Holdsworth and AlversonMoore and others (2001), namely, that anomalous snow accumulation at the site is associated with a wave-like pattern of alternating high and low geopotential-height anomalies radiating out of the central tropical Pacific towards northwestern North America. As discussed by Reference Moore, Holdsworth and AlversonMoore and others (2001), this pattern is similar in structure to the so-called Pacific North America teleconnection that is associated with the extratropical response to ENSO (Reference Horel and WallaceHorel and Wallace, 1981; Reference Trenberth, Brantstator, Karoly, Kumar, Lau and RopelewskiTrenberth and others, 1998). the anomaly in the upper-level wind field in the “high” composite results in the enhanced advection of moist tropical air towards Mount Logan, consistent with enhanced snow accumulation at the site. In the “low” composite, the upper-level flow is such as to diminish this advection, andis thus consistent with a reduction in snow accumulation at the site. In addition to this primary structure, the 250 mbar geopotential-height and wind-field composites suggest that anomalous snow accumulation at the Mount Logan site is also associated with upper-level circulation anomalies in Siberia and along the western boundary of the North Atlantic. the mechanism(s) that couple these distant regions to snow accumulation on Mount Logan are at present unclear, although the high elevation of the site makes it sensitive to mid- and upper-tropospheric long-range circulation anomalies, and this most likely plays a role (Reference DeWeaver and NigamDeWeaver and Nigam, 1995).
The composites of the MSU 2LT temperature field are broadly consistent with the circulation patterns described above. In addition, they show that enhanced snow accumulation at the site is associated with anomalously high tropospheric temperatures in a large area extending from the central subtropical Pacific to western North America. Diminished snow accumulation at the Mount Logan site is associated with reduced tropospheric temperatures in this same region. There is also a region in the central mid-latitude Pacific where tropospheric temperatures are out of phase with those in the Mount Logan region. As was the case for the upper-level circulation patterns, there are distant regions where the tropospheric temperature anomalies are correlated with snow accumulation at the Mount Logan site.
The composites of the surface temperature field are again consistent with the other composites. the most important new result from these composites relates to sea-surface temperature anomalies in the Pacific Ocean. Enhanced snow accumulation at the Mount Logan site is associated with anomalously high sea-surface temperatures in a horseshoe-shaped pattern extending from the central tropical Pacific along the western coast of North America and up into the North Pacific in the vicinity of the Bering Strait. In the center of this horseshoe is a region of anomalously low sea-surface temperatures that extends eastwards from Japan. Elevated sea-surface temperatures to the south and west of the site would result in enhanced evaporation and an enhanced flux of atmospheric moisture directed towards the site by the circulation pattern associated with the “high” composite of Figure 2a. What is perhaps most interesting regarding this “horseshoe” pattern is that it is similar to one associated with recently identified decadal-scale variability in the North Pacific, the so-called Pacific Decadal Oscillation (PDO) (Reference Mantua, Hare, Y., Wallace and CMantua and others, 1997; Reference Zhang, Wallace and SZhang and others, 1997). Reference Moore, Holdsworth and AlversonMoore and others (2001) have shown that there is statistically significant decadal-scale variability in the snow-accumulationtime series from the Mount Logan ice core. It remains to be seen if the PDO is responsible for this variability, but the similarity of patterns in the sea-surface temperature field suggests that it may be a contributory factor. Evidence of an ENSO signature is also evident in the surface temperature composites, with the largest-amplitude signal occurring in the “low” composite.
Conclusions
This paper shows that snow accumulation at the Mount Logan site is associated with a number of long-range statistically significant and coherent structures in the atmosphere and at the surface. In particular, heavy snow accumulation at the site is associated with a dipole structure in the upper-level geopotential-height field that results in an intensification and displacement of the upper-level jet stream over the North Pacific Ocean and western North America such as to enhance the advection of warm moist tropical air over the site. Consistent with this circulation anomaly, heavy snow accumulation at the site is associated with warmer air and surface temperatures throughout these regions. Reduced snow accumulation is associated with anomalies that generally are of similar magnitude and extent, but of opposite sign, although some differences are evident. the existence of these relationships allows for the possibility that one can use the snow-accumulation time series from the site as a proxy for paleoclimatic reconstructions of atmospheric circulation, including ENSO, the PDO, tropospheric and surface temperatures.
Acknowledgements
We thank the reviewers for their helpful comments. NCEP re-analysis data was provided by the NOAA–CIRES Climate Diagnostics Center, Boulder, Colorado. the MSU 2LT weights were provided by B. Santer.


