INTRODUCTION
The time-dependent change of a lake's water level is an important measure of regional climate. Water level or depth registers the dynamic balance between runoff into and evaporation out of a lake. Fluctuations of water level, particularly those of an endorheic lake, are an inherently sensitive indicator of changes in hydrologic balance. Thus, lake levels record and integrate the hydrology of a lake and its catchment in terms of runoff, precipitation, temperature, and evaporation (Adrian et al., Reference Adrian, O'Reilly, Zagarese, Baines, Hessen, Keller and Livingstone2009; Williamson et al., Reference Williamson, Saros, Warick and Smol2009). Mormon Lake occupies a closed 103 km2 basin in the montane semiarid ponderosa pine (Pinus ponderosa Law; Thompson, Reference Thompson2000) forest of the southwest Colorado Plateau (Fig. 1A and B). Because of the plateau's location in the dry interior of the western United States, plateau ecosystems are highly vulnerable to climate change (Schwinning et al., Reference Schwinning, Belnap, Bowling and Ehleringer2008). The lake's water-level chronology, therefore, is a potentially useful measure of climate change—change that has already affected the forest ecosystems of the study region (Ganey and Vojta, Reference Ganey and Vojta2011; Thorne et al., Reference Thorne, Choe, Stine, Chambers, Holguin, Kerr and Schwartz2017).
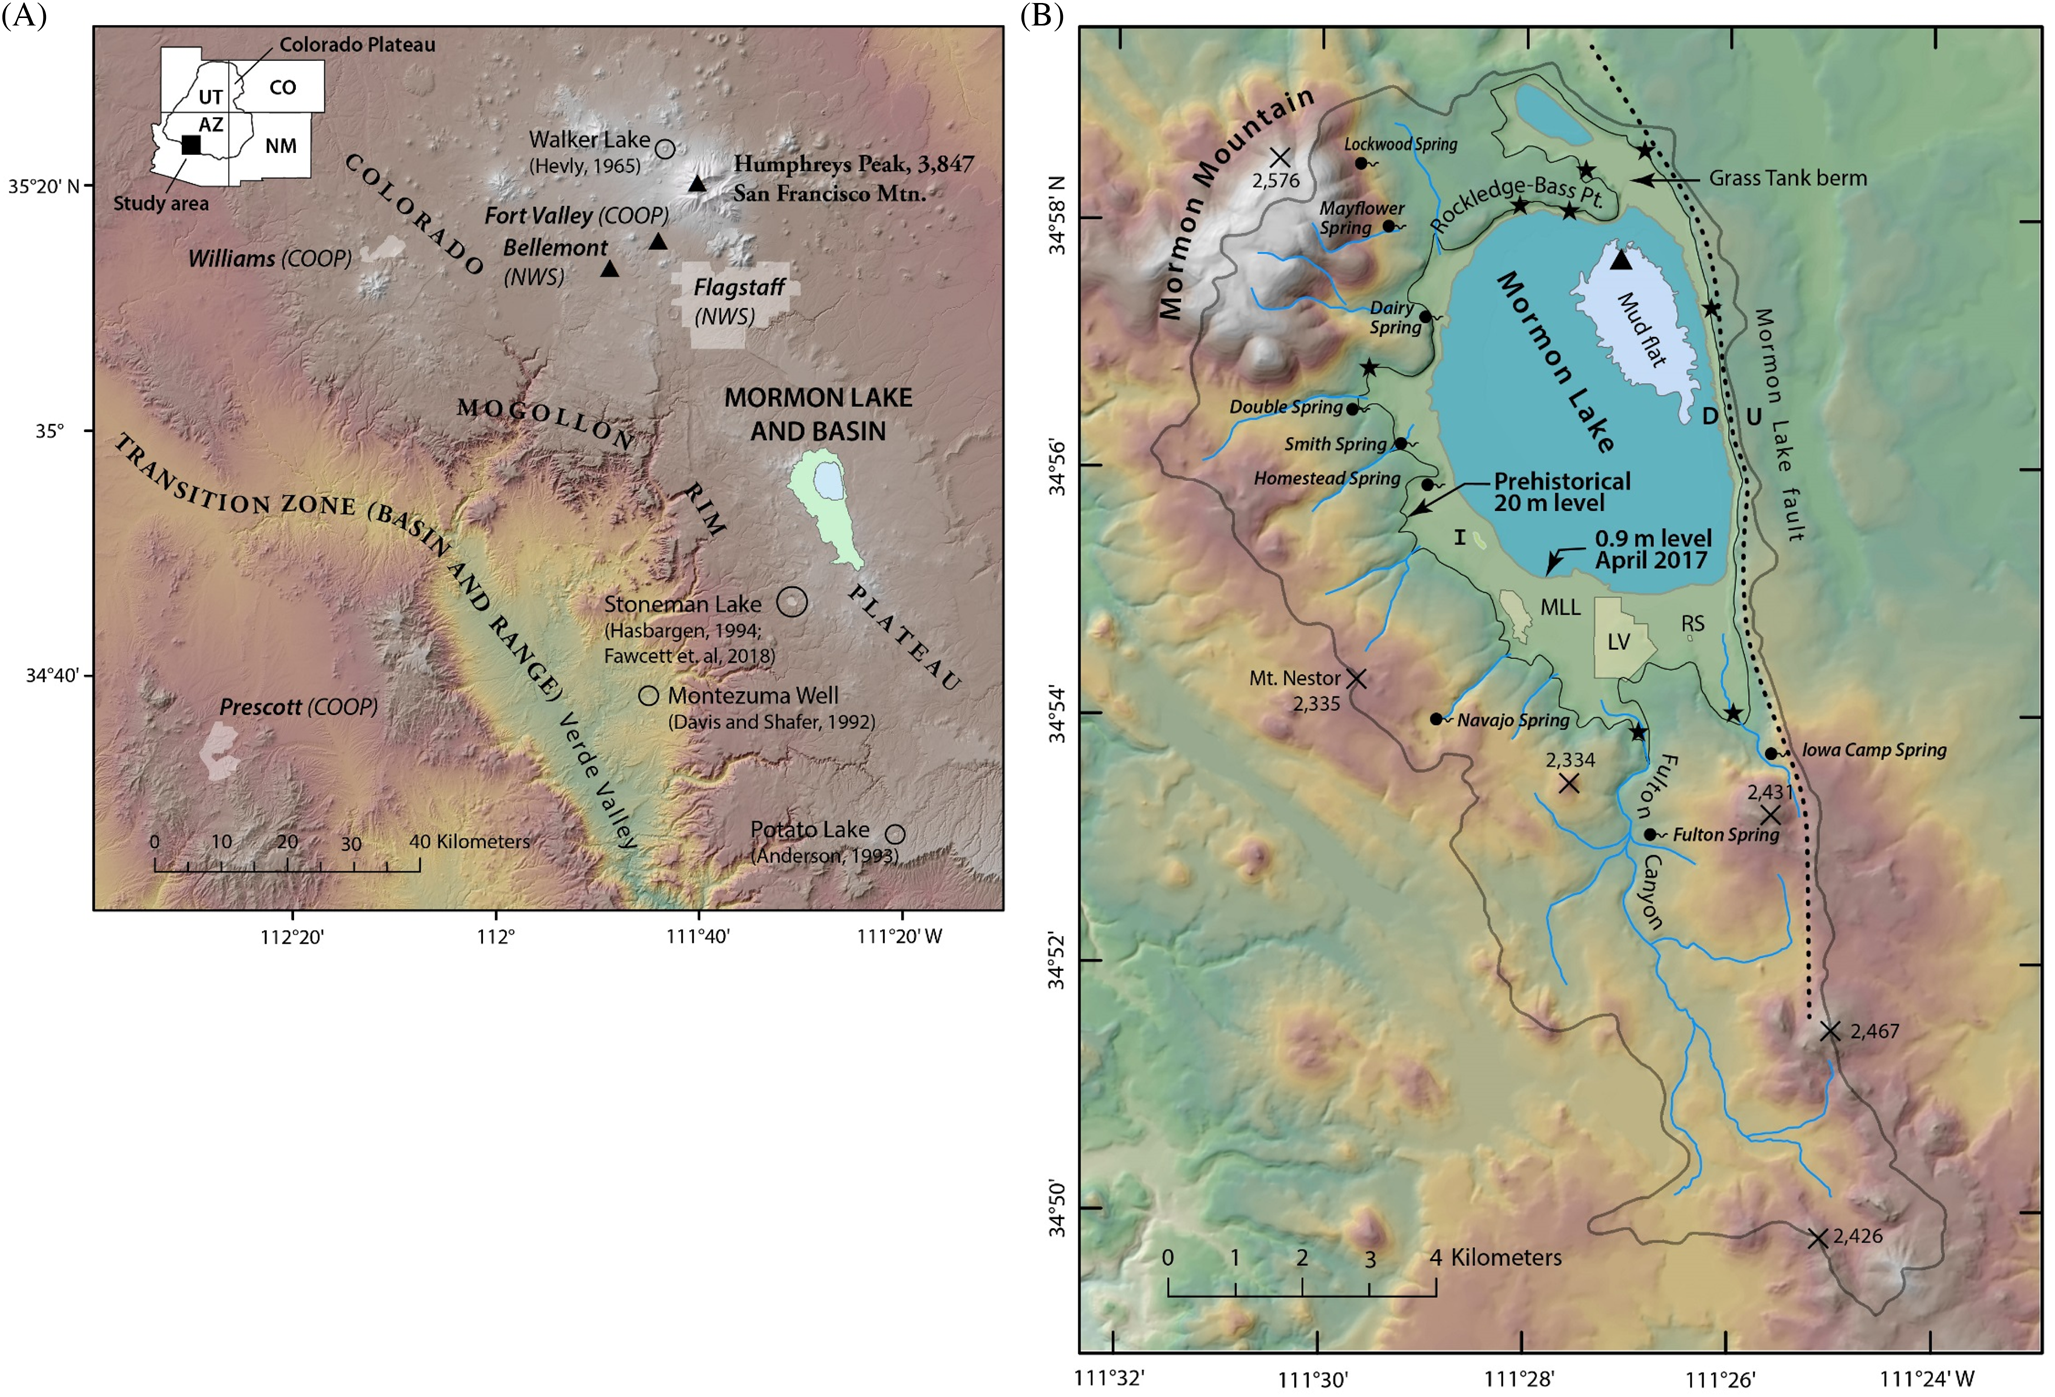
Figure 1. Shaded relief maps of the Mormon Lake study region. (A) The study region on the southwestern Colorado Plateau of the American Southwest. Previously studied lakes are circled. Weather stations in cities and towns are labeled: NWS, National Weather Service; COOP, Cooperative weather station. (B) Mormon Lake drainage basin in the Mormon Mountain volcanic field (Holm, Reference Holm1994); I (NW of MLL), MLL, LV, and RS are island, Mormon Lake Lodge, Lakeview subdivision, and ranger station, respectively. Elevation of selected mountainous volcanic features are labeled. Stars show occurrences of high-level prehistoric lake sediment. The solid triangle is the lowest surveyed point and zero-depth reference elevation of 2165.60 m. Mudflat is the dry unvegetated lake floor as exposed in June 2007 (Hevly, Reference Hevly1965; Anderson, Reference Anderson1993; Hasbargen, Reference Hasbargen1994; Fawcett et al., Reference Fawcett, Anderson, Staley, Brown, Petronis, Lauricella and Werne2018; Supplementary Data 1).
Unaltered closed-basin freshwater lakes larger than several square kilometers are rare on the Colorado Plateau. The lake's surface area in the early 1900s, when it reached maximum historic level, was 31.4 km2. Since the 1940s, Mormon Lake has been relatively shallow or dry most of the time. For example, in April 2017, following near-normal snowfall, lake area was 19 km2 and maximum level was only 0.9 m. Mormon Lake, nonetheless, is the largest body of freshwater on the 337,000 km2 plateau. Yet water levels of the late Holocene (e.g., historical and prehistorical eras as defined herein) and their relation to climate of the plateau are unknown.
Although many studies address the effects of drought on forest ecosystems and wildfire frequency (Breashears et al., Reference Breshears, Cobb, Rich, Price, Craig, Balice and Romme2005; Westerling et al., Reference Westerling, Hidalgo, Cayan and Swetnam2006; Williams et al., Reference Williams, Allen, Millar, Swetnam, Michaelsen, Still and Leavitt2010, Reference Williams, Allen, Macaldy, Griffin, Woodhouse and Meko2013, Reference Williams, Seager, Macaldy, Berkelhammer, Crimmins and Swetnam2014; Fiedler and Arno, Reference Fiedler and Arno2015; Chikamoto et al., Reference Chikamoto, Timmermann, Widlansky, Balmaseda and Scott2017), the impact of previous and ongoing droughts on hydrologic elements of the forest ecosystem—lakes, ponds, wetlands, and springs—is not well understood. Wetlands, such as Mormon Lake in its present state, and springs are important, as they are keystone ecosystems whose ecological importance is disproportionate to their limited extent (Bianca and Stevens, Reference Bianca, Stevens, Stevens and Meretsky2008; Springer et al., Reference Springer, Stevens, Anderson, Parnell, Kreamer, Levin, Flora, Stevens and Meretsky2008).
This study provides new information on the historical and prehistorical (before settlement of the area in AD 1878; McClintock, Reference McClintock1921) water levels of Mormon Lake and their relation to the historical hydroclimate, that is, precipitation and temperature, of the study region. The objectives of the study were to reconstruct historical lake levels, correlate them with available instrumental climate records, and identify the global-scale climate drivers of lake-level variability during the twentieth and early twenty-first centuries. This will permit inferences about future lake levels. Another objective was to date and tentatively interpret formerly unrecognized prehistorical high-level lacustrine sediment (Fig. 1B). Dating the sediment permits preliminary correlation of the highstands with regional late Holocene paleoclimate. With additional work, hydroclimatic interpretation of these highstands is possible using the historical climate–lake level relationship developed from climate records.
The projections of most climate models indicate that arid conditions in the Southwest United States will intensify over the twenty-first century as a function of long-term trends in precipitation and evaporation (Seager et al., Reference Seager, Ting, Held, Kushnir, Jian and Vecchi2007; Cayan et al., Reference Cayan, Das, Pierce, Barnett, Tyree and Gershunov2010; Cook et al., Reference Cook, Ault and Smerdon2015; Jones and Gutzler, Reference Jones and Gutzler2016). The study region is currently experiencing a severe drought (Woodhouse et al., Reference Woodhouse, Meko, MacDonald, Stahle and Cook2010; Garfin et al., Reference Garfin, Franco, Blanco, Comrie, Gonazalez, Piechota, Smyth, Waskom, Melillo, Richmond and Yohe2014); however, it is uncertain if this aridity is a transient multiyear drought or a long-term trend toward drier conditions. Distinguishing between transient and long-term climate states is a challenge for climate monitoring (Jones and Gutzler, Reference Jones and Gutzler2016). Mormon Lake's historical water-level chronology is physical evidence that speaks to the beginnings of aridification, its negative influence on water resources, and whether aridification results from a long-term trend of increasing temperature related to global warming.
Previous studies
The weather and climate of the study region are understood through detailed statistical analysis of weather at Flagstaff, Arizona (Staudenmaier et al., Reference Staudenmaier, Preston, Sorenson and Johndrow2014; Fig. 1A), which is 33 km NW of Mormon Lake. However, the influence of long-term variability of late nineteenth- through early twenty-first-century temperature and precipitation on Mormon Lake water levels is unknown. Historical precipitation patterns and their influences on the geomorphology and ecosystems of the southern Colorado Plateau and adjacent climatically similar Mojave Desert region were addressed in Schwinning et al. (Reference Schwinning, Belnap, Bowling and Ehleringer2008) and Hereford et al. (Reference Hereford, Webb and Longpŕe2006, Reference Hereford, Bennett and Fairley2014).
Late Quaternary paleoenvironments of the Colorado Plateau have been studied at 46 sites (as of Anderson et al., Reference Anderson, Betancourt, Mead, Hevly and Adam2000). Three of these are small lakes or ponds that lie within the present study area along the Mogollon Rim and northwest of San Francisco Mountain (Hevly, Reference Hevly1965; Anderson, Reference Anderson1993; Hasbargen, Reference Hasbargen1994; Fawcett et al., Reference Fawcett, Anderson, Staley, Brown, Petronis, Lauricella and Werne2018; Fig. 1A). Another study in the nearby Verde Valley addressed the Sonoran Desert paleoenvironments of Montezuma Well (Davis and Shafer, Reference Davis and Shafer1992). These studies reconstructed late Quaternary paleoclimate using lake-sediment cores. Biological proxy evidence was used to infer relative water levels during the last glacial maximum through the Holocene. The lacustrine cores in most cases are several meters long, and the time represented by the dated sediment is much longer than the brief several thousand years of the late Holocene. Thus, limited core length and long time span reduce the temporal resolution of lake levels during the late Holocene. Generally, the lacustrine studies found that late Holocene levels were higher than those of the dry mid-Holocene, although specific fluctuations of late Holocene water levels were not identified.
Periglacial activity on nearby San Francisco Mountain, which is near the southernmost limit of late Pleistocene alpine glaciation in North America, is relevant to interpretation of the unusually high stands of Mormon Lake during the late Holocene. Late Holocene periglacial features are present in the former glaciated cirques of the Inner Basin and on the north side of the mountain (Sharp, Reference Sharp1942; Péwé and Updike, Reference Péwé and Updike1976; Poellot, Reference Poellot2000; Fig. 1A). These physical indicators of intense freeze–thaw activity suggest that the late Holocene climate was at times cool and probably wet. Mormon Lake water levels, as reported here, rise following increased winter precipitation and reduced summer temperatures.
Physical setting and climate
Regionally, the lake lies on the high-elevation southwest Colorado Plateau east of the Mogollon Rim, a prominent NW-trending escarpment and orographic barrier separating the plateau from the Transition Zone and Basin and Range Provinces (Fig. 1A). The elevation of this portion of the plateau reaches a maximum of 3847 m on Humphreys Peak of San Francisco Mountain. Generally, elevation in most of the study area is >2000 m. Mormon Lake and its drainage basin occupy a late Miocene through Pliocene volcano-tectonic basin in the Mormon Lake volcanic field. The main edifice is Mormon Mountain, which forms the west side of the lake basin (Fig. 1B). Rocks of the volcanic field are primarily basalt, andesite, and dacite that form flows, vents, cones, domes, and shields (Holm, Reference Holm1994). The Mormon Lake fault, a north-trending normal fault downthrown to the west, borders the east side of the lake near the water level. The fault displaces late Miocene basalt 50-m without exposing underlying permeable Paleozoic bedrock on the footwall. The fault was active in the Pleistocene; Holocene surface ruptures are unknown (Pearthree et al., Reference Pearthree, Vincent, Brazier and Hendricks1996). Evidence at lake level of groundwater seepage into the fault or springs emerging from the fault is unknown.
The lake basin is mostly unaltered by human activity, although cattle and elk graze the lake floor and managed logging in the surrounding forests began in 1908. Historical photographs of the lake dating to the early 1900s show undisturbed forests near the shore on the west and south sides of the lake. This and the lack of extensive gullying suggest that logging had little influence on surface runoff into the lake. Water is not diverted from the lake, tributary streams flow freely into the lake, domestic water consumption is low (2.5 ha-m annually), and leakage into the subsurface through the largely impermeable clay-rich lacustrine sediment of the lake bed is probably minimal. Furthermore, seepage of four nearshore springs on the west side of the lake feeds (Fig. 1B) shallow, short, and narrow streams that locally moisten the nearshore lake floor with no apparent influence on lake level. Double and Dairy Springs were diverted historically. Their combined annual flow is ca. 7 ha-m, which is substantially less than the area and volume of Mormon Lake.
Runoff from the fully closed drainage basin enters the lake mainly through Fulton Canyon, which drains the large southern portion of the basin (Fig. 1B). Shorter, mainly first-order streams reach the lake from the west and southwest sides of the basin. Grass Tank basin is a small subbasin at the north end of the lake. A natural berm or shelf separates the subbasin from the main basin; the subbasin was inundated, before modification in the 1970s, when water level exceeded 4.8 m. Since about 2000, the lake has risen from dry to ca. 1 m following favorable spring runoff from snowmelt or rain on snow events.
Precipitation in the region is biseasonal. Rain and snow occur in the cool season from mid-October to mid-April, and rain occurs during the warm season from mid-June to October. Late spring is typically dry with little or no precipitation. Cool-season moisture results mainly from extratropical cyclones of the North Pacific Ocean that occur in conjunction with synoptic and global-scale tropospheric depressions and with the polar and subtropical jet streams. Rain or snow during the cool season is widespread in the study region and of relatively long duration. Based on 41 yr of Snow Course Data (https://www.wrcc.nrcs.usda.gov/snow; accessed July 18, 2016), snow of widely varying amounts is essentially an annual occurrence at the elevation of the lake and on Mormon Mountain. Snowfall amounts at lake level and on the summit of Mormon Mountain average, respectively, 67 ± 48 and 233 ± 135 cm annually. Warm-season rainfall results largely from isolated or organized convective thunderstorms. Broadly speaking, this seasonal pattern results from the northerly expansion into the Southwest of the North American Monsoon. The monsoon is a seasonal reversal of atmospheric circulation that transports maritime tropical moisture from the gulfs of California and Mexico onto the Colorado Plateau region. During the latter part of the warm season, in late summer and early fall, tropical cyclones occasionally penetrate northeast into the region, producing copious, widespread precipitation (Sheppard et al., Reference Sheppard, Comrie, Packin, Angersbach and Hughes2002).
Three global-scale patterns of atmospheric and sea-surface temperature (SST) variability are teleconnected with the hydroclimate of western North America, including the southern Colorado Plateau. These patterns are the Atlantic Multidecadal Oscillation (AMO), Pacific Decadal Oscillation (PDO), and El Niño-La Niña (ENSO). For at least the past millennium, these phenomena have caused widespread variations of temperature and precipitation that are associated with long-term drought or pluvial conditions (Routson et al., Reference Routson, Woodhouse, Overpeck, Betancourt and McKay2016). Thus, they are the potential causes of subdecadal to multidecadal fluctuations of Mormon Lake water levels. The AMO is a 60–80 yr climate cycle of alternating warm and cool SSTs of the North Atlantic Ocean from the equator to 70°N (Enfield et al., Reference Enfield, Nuñez and Trimble2001; Chylek et al., Reference Chylek, Dubey, Lesins, Jiangnan and Hengartner2014). The PDO is an index of SST and atmospheric pressure of the North Pacific Ocean that has a global ENSO-like influence on climate (Mantura and Hare, Reference Mantura and Hare2002). In the Southwest, the phase (±) of the PDO relates to alternating decadal to multidecadal episodes resembling warm El Niño (EN) wet or cool La Niña (LN) dry conditions. The AMO and the PDO together are associated with multidecadal drought or pluvial conditions across the Southwest specifically and the continental United States generally (McCabe et al., Reference McCabe, Palecki and Betancourt2004, Reference McCabe, Betancourt, Gray, Palecki and Hidalgo2008), although the PDO is not an independent predictor of climate (Newman et al., Reference Newman, Alexander, Ault, Cobb, Deser and Di Lorenzo2016). Subdecadal climate variability is forced by ENSO, particularly during winter (Cayan et al., Reference Cayan, Redmond and Riddle1999).
DATA AND METHODS
Generally, Mormon Lake water levels vary annually according to cool-season precipitation on the lake plus surface runoff of tributary streams minus warm-season evaporation of the lake's surface. Neither lake level nor surface runoff of the lake's several tributaries is monitored. Various methods were used to recognize and date former lake levels, but tributary runoff is difficult to directly estimate. Although tributary runoff and evaporation are unknown, both vary as a function of fluctuating precipitation and temperatures, of which the latter substantially influences evaporation. In addition, local wind velocity and direction enhance evaporation of the lake's surface; such data do not exist for Mormon Lake. Actually, local rather than regional wind observations are necessary, because Mormon Mountain is a major topographic barrier that modifies regional wind velocity and direction.
Instrumental weather data from 1898 to 2016 were used to analyze the influence of climate on lake levels. Weather data from Mormon Lake are incomplete and generally not useful. In the studied region, however, five long-term weather stations (Fig. 1A) record climate variation. The stations are at similar elevation and lie within the lower montane pine forest of the southwest Colorado Plateau, which alone suggests that climate is broadly similar across the region. Daily precipitation, temperature (maximum and minimum), and snowfall data were downloaded from the U.S. National Climate Data Center (https://www.ncdc.noaa.gov/cdo-web). Two of the stations (Bellemont and Flagstaff) are National Weather Service (NWS) Forecast Offices, also known as first-order stations. The others (Fort Valley, Prescott, and Williams) are cooperative stations (COOP) staffed by volunteers under the guidance of NWS personnel. The number of reporting stations increases through the record from one to five. One or both of Prescott and Williams stations reported from 1898 to the present, Fort Valley operated as a COOP station from 1910 to 2010, Flagstaff and Bellemont are operating NWS stations that began functioning in 1950 and 1996, respectively. Data are available for each year except 1907 and 1908; the record consists of 116 yr of valid climate data.
The Palmer Drought Severity Index (PDSI) is a valuable record of regional hydroclimate that complements the instrumental climate data. The PDSI integrates precipitation, evapotranspiration, and soil moisture as hydrologic determinants of water supplies in streams and lakes (Alley, Reference Alley1984). The average annual PDSI indices used in this study are those of the NE Arizona Climate Division 2, which are available online at https://www.esrl.noaa.gov/psd/data/usclimdivs. Monthly AMO, PDO, and ENSO SST (Niño 3.4) data used in the hydroclimate analysis of lake levels are online at https://www.esrl.noaa.gov/psd/data/climateindices/list. We hypothesize that variability of the AMO, PDO, and ENSO cause short- and long-term fluctuations of Mormon Lake water levels and the regional PDSI.
Lake levels were reconstructed from anecdotal evidence, historical photographs, mapping aerial-photographic surveys (https://www.earthexplorer.usgs.gov), Landsat (https://www.earthexplorer.usgs.gov) and Google Earth© satellite imagery, tree-ring dating of nearshore trees, and geologic identification of lacustrine sediment and other lake-level indicators. Anecdotal evidence includes historical mention of whether the lake was dry or water was present. Ground-based photographs of the lake when dry are unknown from the early 1900s, probably because the lake contained water throughout this period (Gatewood et al., Reference Gatewood, Wilson, Thomas and Kister1964). Photographs taken in the early 1900s document high-water levels (Supplementary Data 1). Precise elevation of the waterline in historical photographs and aerial photography involved extrapolation of the line to or intersection with 196 surveyed points in 24 lake-floor traverses that trend perpendicular to the lake's perimeter.
Former shorelines of Mormon Lake are not traceable continuously around the perimeter of the lake. The only method of shoreline correlation is by using the elevation of lacustrine deposits and geomorphic features. A survey-grade GPS receiver established the elevation of prehistorical and historical shorelines. After differential correction, 90% of the individual measurements had vertical precision (standard deviation) of 5–15 cm. The standard error of mean station elevations is 0.5–1.4 cm. The reference coordinate system is WGS 84 (World Geographic System 1984); the vertical datum is EGM 96 (Earth Gravity Model 1996). The height of shorelines is reported as elevation, water level, or its equivalent maximum water depth (in contrast to average water depth). The reference point is on the mudflat in the northeast corner of the lake (Fig. 1B). We define this as the lake's depocenter and point of zero water depth. Elevation is 2165.60 m, and geographic coordinates are 34.961447044°N, 111.451204368°W.
Historical shorelines were dated using age-diagnostic shoreline debris, dated nearshore P. ponderosa, and the spread of brushy shoreline vegetation as shown in time-sequential aerial photography. Shoreline debris is sparse on the north and east sides of the lake that face the prevailing south and southwest winds. For the historical period, 1885 to the present, 51 lake levels were identified and dated to at least the year. The numerical age of the prehistorical highstand lacustrine sediment was determined using microcharcoal 14C accelerator mass spectrometry (AMS) dating. Chemical pretreatment of the microcharcoal included treatments typically applied to charcoal combined with acid-base chemistry. This procedure yields microcharcoal dates comparable to those of charcoal and reduces or eliminates the “old carbon effect” (see footnote a in Table 1).
Table 1. Radiocarbon ages at two localities from near the base (Fig. 1B; Bass Point) and top (Double Springs) of prehistorical lacustrine sediment.

a Cummings (Reference Cummings2019).
b Microcharcoal-calibrated 14C AMS date, corrected for δ13C.
c Calibrated age range (95.4%).
d Corresponding depth or level.
e Continuous downslope 75 m with surface 2182.7.
Tree-ring dating revealed the progressive decrease of P. ponderosa age with declining shoreline elevation. Trees were cored at breast height with a standard increment borer. Following silvicultural convention, tree-ring counts were increased by 12 to obtain the age of the tree at stump height (Minor, Reference Minor1964; Ferguson and Carlson, Reference Ferguson and Carlson2010). The trees were not cross-dated, so strictly speaking their age is not annually resolved. Nevertheless, the reported stump-height ages are probably within a few years of the actual germination date. The oldest and highest of these dated nearshore trees constrains the age of the youngest prehistoric and oldest historical water levels (early 1900s), respectively. The lowest and youngest tree line defines the persistent low-water levels of the mid-1990s to the present.
Finally, statistical procedures, specifically correlations among climate and lake level and statistical modeling of depth based on climate, are reported as statistically significant if the probability of a type 1 error is P < 0.05. That is, the null hypothesis of no effect is rejected at the P < 0.05 level of certainty.
RESULTS
Field-based GPS and geologic surveys reveal the topography of the lake floor, sedimentary characteristics of the lake bed, and prehistorical and historical shorelines and their elevations. The extensive lake floor is essentially horizontal, except adjacent to the shoreline. The lake bed is entirely dark (brownish black 5YR 2/1), dense, silty clay with widely scattered small to large cobbles atop the lake bed. The presence of these large clasts far from shore is puzzling and unexpected in this low-energy lacustrine environment. Evidence of abandoned shorelines is the presence of pebbles on former beaches, breaks in slope of the lake floor, and the presence of elevated, distinctive lake sediment. Former shorelines above the lake floor typically contain subrounded pebbles to medium-size cobbles composed of basalt derived from nearby basaltic flows or other rock types of the Mormon Mountain volcanic field. These deposits are mostly historical and typically occur beneath steep bedrock slopes, where they form either subhorizontal gravelly benches, sloping beach faces, or pebbly to gravelly beach ridges. Young shorelines formed within the past ca. 20 yr are present as breaks in the gentle slope of the lake floor. The slopes range in relief from 10 to 30 cm.
Prehistorical lake levels
Dating high-level prehistorical lacustrine sediment using the 14C AMS method revealed that Mormon Lake at its deepest was 24 m at ca. 3.6 ka BP, which is three times its maximum historical depth. The lake receded from this level probably in three stages, reaching its lowest shoreline before ca 0.20 ka. We suggest that the four highstands resulted from previously unknown (at least in the study region) late Holocene pluvials. The relatively high lake levels and unusual cool and wet climate of the early 1900s, as documented in this study, might be a short-lived analog of the earlier pluvial episodes. Additional research, however, is necessary to refine the age, number, and paleoclimate of the inferred late Holocene pluvials.
Prehistorical lake sediment is present on the south and north sides of Bass Point, on the west side of the lake near Double Springs, along the east side of the lake at Grass Tank berm, near the mouth of Fulton Canyon, and southeast of the ranger station (Fig. 1B). At the Rockledge and Bass Point localities, the sediment was deposited on several bedrock benches beneath subvertical basalt cliffs. At the shoreline embayments of Double Springs and the ranger station, and near the mouth of Fulton Canyon, the sediment forms an ancient high-level lake bed that slopes gently toward the lake (Fig. 1B). Lacustrine sediment exposures are rare and measure up to 30 cm thick. The sediment is distinctive for its lack of stratification. Macroscopic charcoal and other organic matter are lacking.
Elevation of the sediment ranges from ca. 2175–2189 m, which corresponds to water levels of ca. 9–24 m. The 24 m level is below the drainage basin divide at its lowest point on the north end of the basin. These levels are substantially higher than the historic high level of 7.9 m (ca. 8 m hereafter). Four main water levels occur within the upper and lower elevational limits of the sediment. These cluster at average water levels of ca. 15, 17, 20, and 23 m. The age of the lacustrine sediment is based on 14C AMS dating of microcharcoal extracted from the sediment. The oldest and highest sediment dated to 3545 cal yr BP and the lowest and youngest dated to 1225 cal yr BP (Table 1). The sediment, at its youngest, mostly predates the oldest nearshore P. ponderosa, which is ca. 200 yr. Thus, the dated prehistorical lacustrine sediment is late Holocene, its full age range is somewhat greater than 3.55 to less than 0.20 ka BP. Furthermore, because age decreases with lower elevation, the four main water levels are assumed to represent sequentially lower highstands of the lake during the late Holocene. Presently, however, the numerical ages of the other levels of prehistoric sediment are unknown.
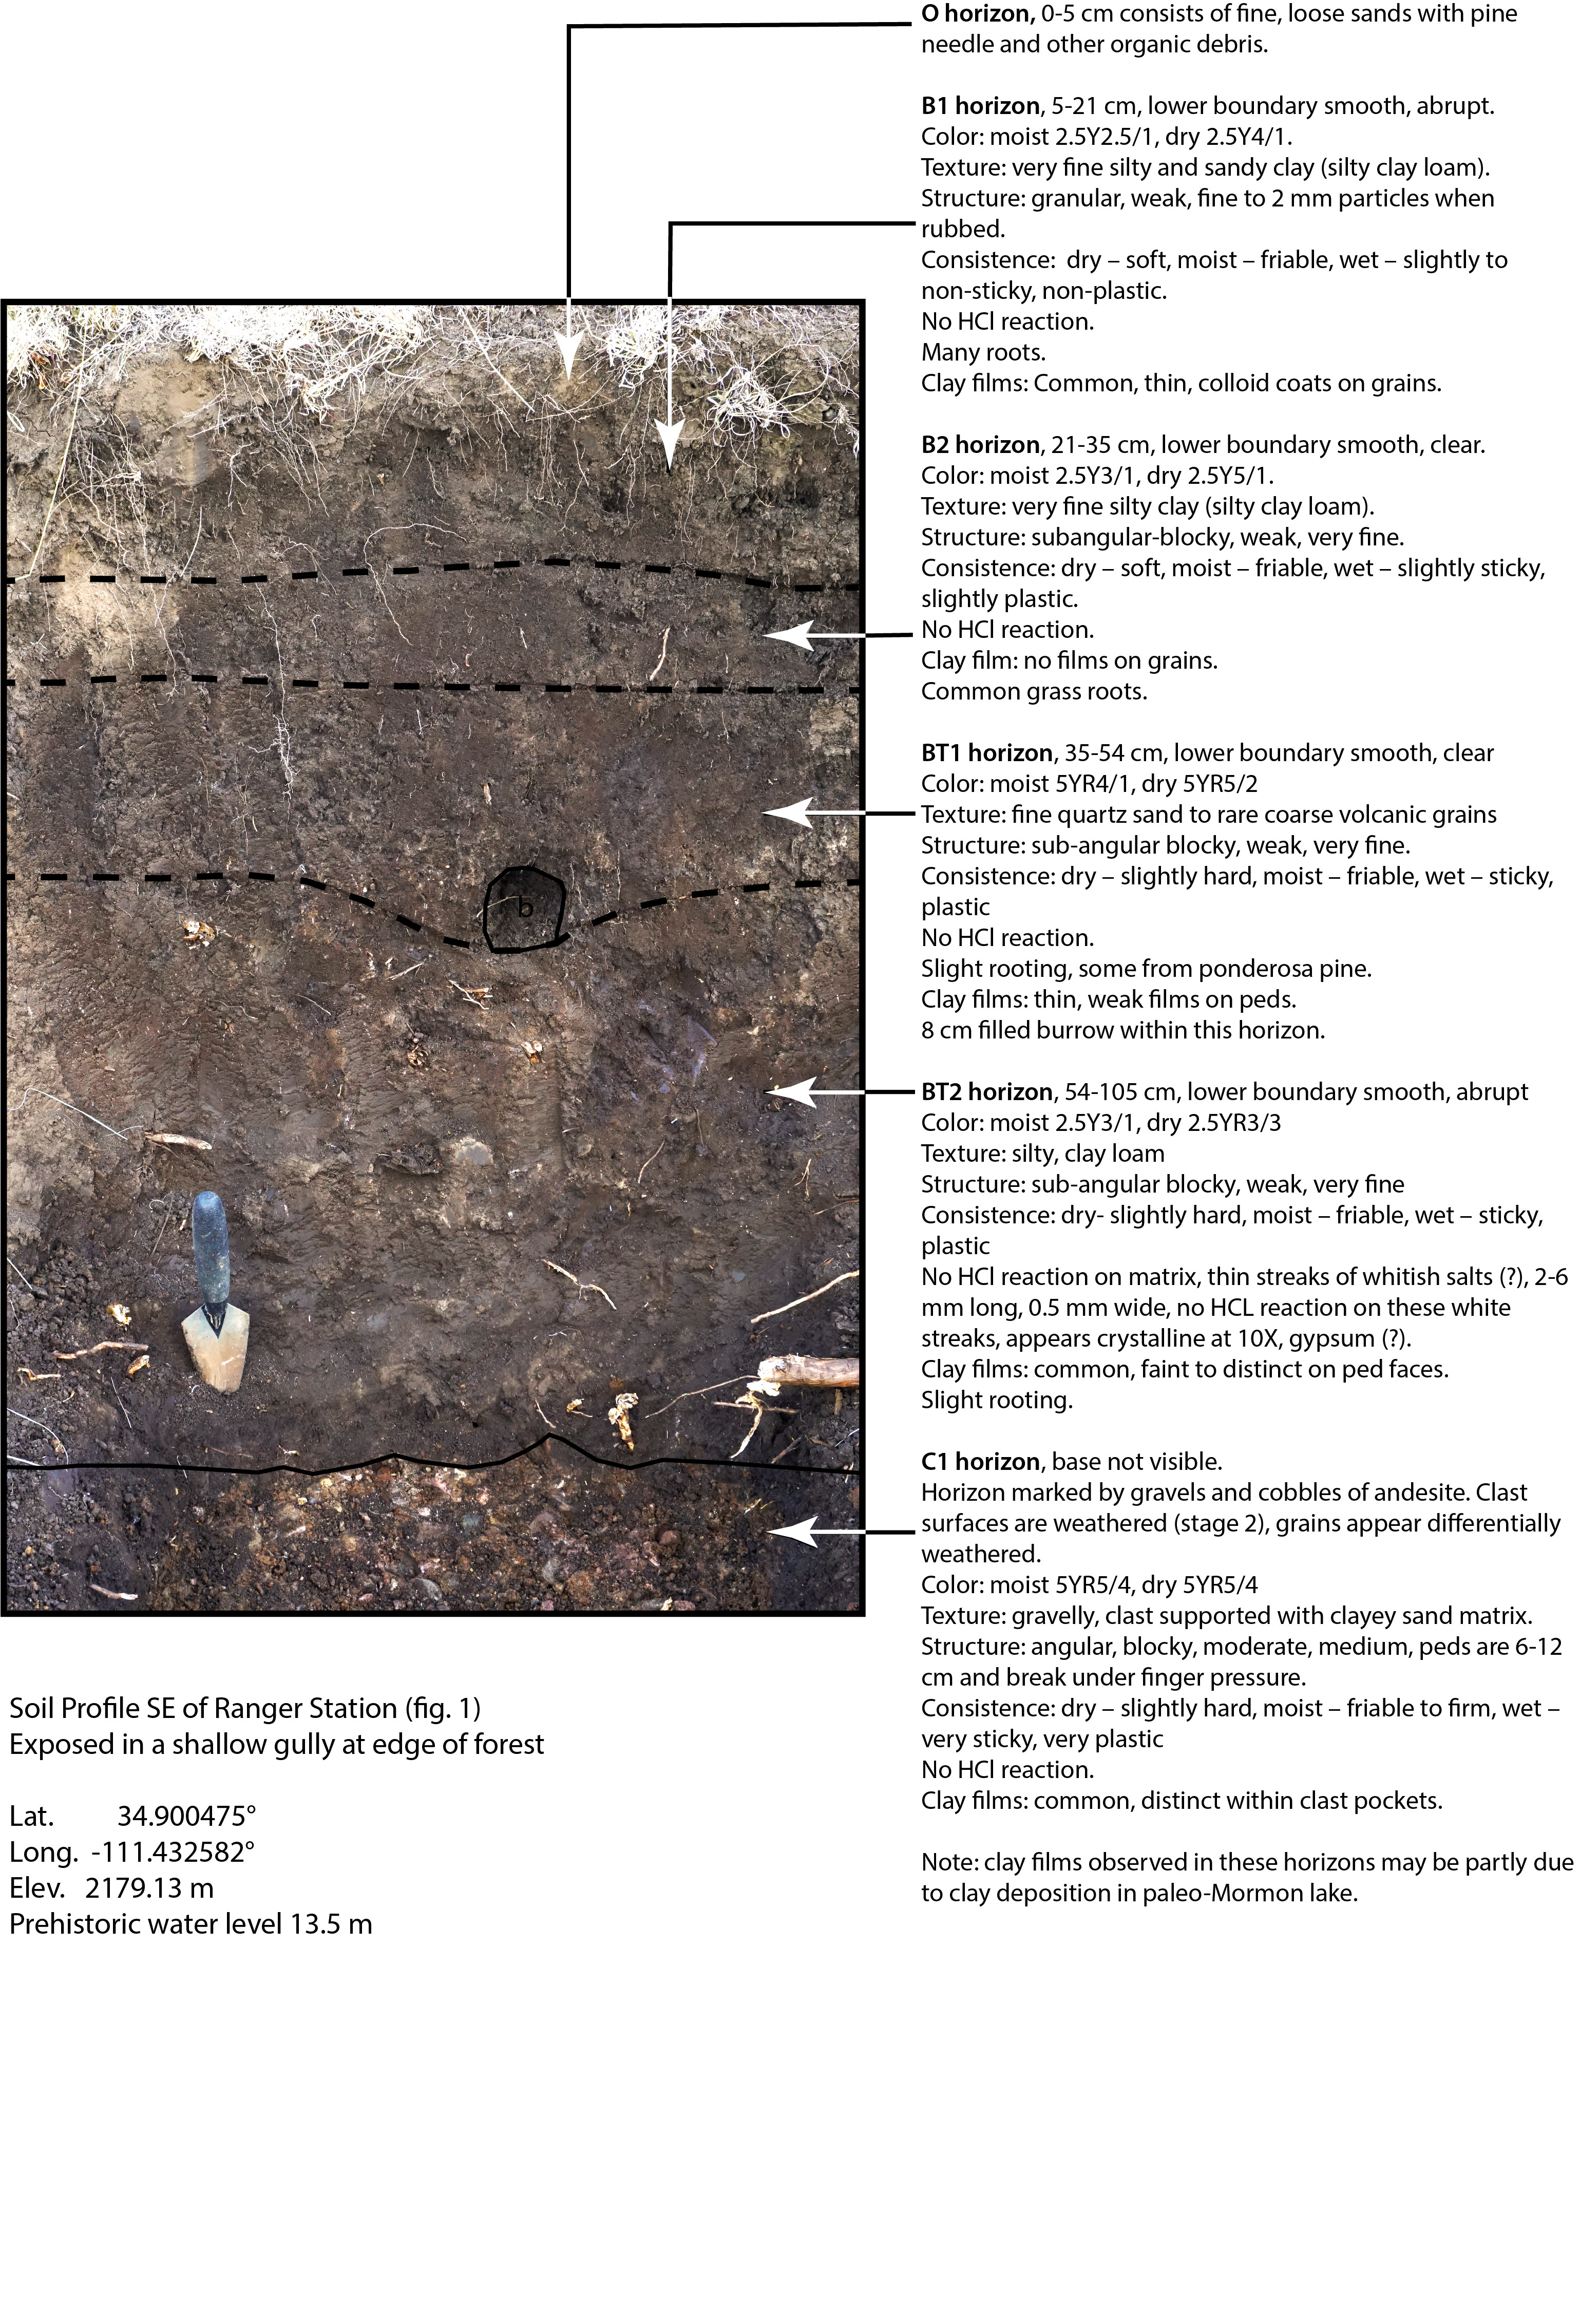
The sediment's relative age based on soil development, weathering, and regional correlation substantiates the young 14C AMS dates. Near the highest level, on the north side of Bass Point (Fig. 1B), lightly patinated small-basalt cobbles resting on bedrock are present at the 19 m level. The surfaces of a few clasts show shallow exfoliation features. The thickness of weathering rinds on the clasts provides a rough estimate of the upper age limit of the lacustrine sediment. These cobbles have weathering rinds that are 0.5–0.7 mm thick. Rinds of this thickness on basalt in climatic settings similar to Mormon Lake suggest an age of several thousand years (Hunt, Reference Hunt2015). Patination is also light on the subvertical basaltic cliffs and talus beneath the cliffs at Bass Point. Lower levels of the prehistorical sediment, those between ca. 10–17 m, show even less weathering than the highest sediment. At this level, small cobble clasts in the basal gravel lack weathering rinds, and the surfaces are rough, much like sandpaper. Soil development on the dark clay-rich sediment is weak to nonexistent, suggesting the deposits are not particularly old. B horizons have a granular to blocky structure and show weak cambric development, mostly resembling the color of unaltered lake sediment (Supplementary Data 2). This lack of soil development is characteristic of presumed late Holocene periglacial features on San Francisco Mountain (Sharp, Reference Sharp1942; Péwé and Updike, Reference Péwé and Updike1976; Poellot, Reference Poellot2000).
In addition, correlation with the regional Holocene climate of the southern Rockies and Sierra Nevada suggests the highstand sediment is probably not older than late Holocene. The relatively arid climate of the middle Holocene throughout the region—including the study area, the Rocky Mountains of southern Colorado, and the Sierra Nevada of eastern California—was not conducive to high-water levels (Hevly, Reference Hevly1965; Davis and Schafer, Reference Davis and Shafer1992; Anderson, Reference Anderson1993; Weng and Jackson, Reference Weng and Jackson1999; Shuman et al., Reference Shuman, Henderson, Colman, Stone, Fritz, Mitchell and Whitlock2009; Anderson et al., Reference Anderson, Soltow and Jiménez-Moreno2018; Jiménez-Moreno et al., Reference Jiménez-Moreno, Anderson, Schuman and Yackulic2019). Late Holocene periglacial features, including boulder streams, protalus ramparts, and rare rock glaciers, occur on San Francisco Mountain. These features were tentatively correlated with those of the White Mountains (210 km SE of Mormon Lake; Merrill and Péwé, Reference Merrill and Péwé1977) of east-central Arizona as well as Neoglacial deposits of the central Sierra Nevada (Péwé and Updike, Reference Péwé and Updike1976). In the Sierra, late Holocene relatively minor glacial activity began ca. 3200, reaching a maximum at 2800 cal yr BP. Four glacial maxima at approximately 2200, 1600, 700, and 250–170 cal yr BP followed the early glaciation. The largest and youngest advance was during the Little Ice Age (Bowerman and Clark, Reference Bowerman and Clark2011). Analysis of fossil pollen in sediment cores of 15 lakes and meadows in the central Sierra Nevada indicates that dry microclimates of the early to mid-Holocene changed to abundant soil moisture at ca. 4.5 ka (Anderson and Smith, Reference Anderson and Smith1994). Owens Lake, fed by runoff from the eastern Sierra Nevada, has late Holocene shoreline features that formed after a major mid-Holocene recession; shorelines date to 3.6, 0.8, and 0.35 ka (Bacon et al., Reference Bacon, Burke, Pezzopane and Jayko2006, Reference Bacon, Lancaster, Stine, Rhodes and Holder2018). The glacial advances, high shorelines, and abundant soil moisture reflect relatively wet and cool climate at times during the late Holocene in the Sierra Nevada. These hydroclimatic conditions could also affect the shoreline record of Mormon Lake and the climate of the montane southwestern Colorado Plateau.
High-lake levels of the early 1900s
Shoreline deposits of the early 1900s contain archaeological remains of weathered milled wood, glass and ceramic pottery fragments, and various steel objects. In contrast, debris in the lower modern-era shoreline sediment consists of relatively fresh milled wood, age-diagnostic aluminum beverage cans, and plastics. Water levels of the early 1900s were well above those after 1941, as indicated by archival reports and historical photographs from the early 1900s. Published reports provide anecdotal information about lake depth. The lake was ca. 4 m deep in 1896 and dry in 1904 (Leiberg et al., Reference Leiberg, Rixon and Dodwell1904). The lake was dry several times during a drought in the late 1800s to earliest 1900s (Gatewood et al., Reference Gatewood, Wilson, Thomas and Kister1964). This drought was particularly severe and affected the cattle industry statewide as well as the oak woodlands and semidesert grassland of the southern Arizona uplands (Turner et al., Reference Turner, Webb, Bowers and Hastings2003). Climate data in the study region for the drought are incomplete, although existing data attest to its extreme dryness. A lake was present from 1905 through 1946 (Gatewood et al., Reference Gatewood, Wilson, Thomas and Kister1964), which is significant, because the lake has been dry numerous times since 1947 (Supplementary Data 1).
Until ca. 1941, the lake was a popular recreational area replete with 100 small boats, including sailboats, a 16-passenger tour boat, and sport fishing (Madsen, Reference Madsen1935). The sport fishery during the mid-1930s consisted of eight species, including rainbow trout. From May 1934 until September 1939, trout and other sport-fishing species were stocked in the lake 28 times, which suggests that the fishery was favored by clear water and adequate long-term depth. Stocking continued intermittently until 1993 when it was discontinued, probably because conditions became unsuitable for most recreational fishing.
The known photographic record of the early 1900s includes photographs from 1913, 1916, 1920, 1923, 1925, 1927, and 1941. These photographs, except 1923, provide numeric estimates of water levels. The shoreline in the 1923 photograph is indeterminate due to extensive disturbance by road construction in the 1950s. The lake was shallow in a 1913 north-facing photograph of a tennis match in play on the dry lake floor east of Double Springs (Fig. 1B). Water is present in the background of the photograph in a position corresponding to 1 m depth. In 1916, a north-facing photograph of the ranger station embayment shows water at an estimated level of 4 m. Lake level increased rapidly after 1916, reaching its maximum historical level of ca. 8 m in 1920. The south and north sides of the island were photographed in the 1920s, when it was frequently visited by recreationalists in small rowboats (Fig. 2). Water surrounds the island at the lowest tree line at levels >4.2 m. At present, the island is surrounded by pastureland that is grazed by cattle and elk (Fig. 2B). A postcard dated 1927 (Babbitt and DeGraff, Reference Babbitt and DeGraff2009) looking southeast from the southern flank of Mormon Mountain shows the island surrounded by water at a high level, implying water level was >4.2 m. This may have been the last time water surrounded the island at tree level based on interviews with longtime residents of the area (Anonymous, 2010). However, a photograph of the lake at a high stage suggests the island was surrounded in 1941 (Supplemental Data 1).
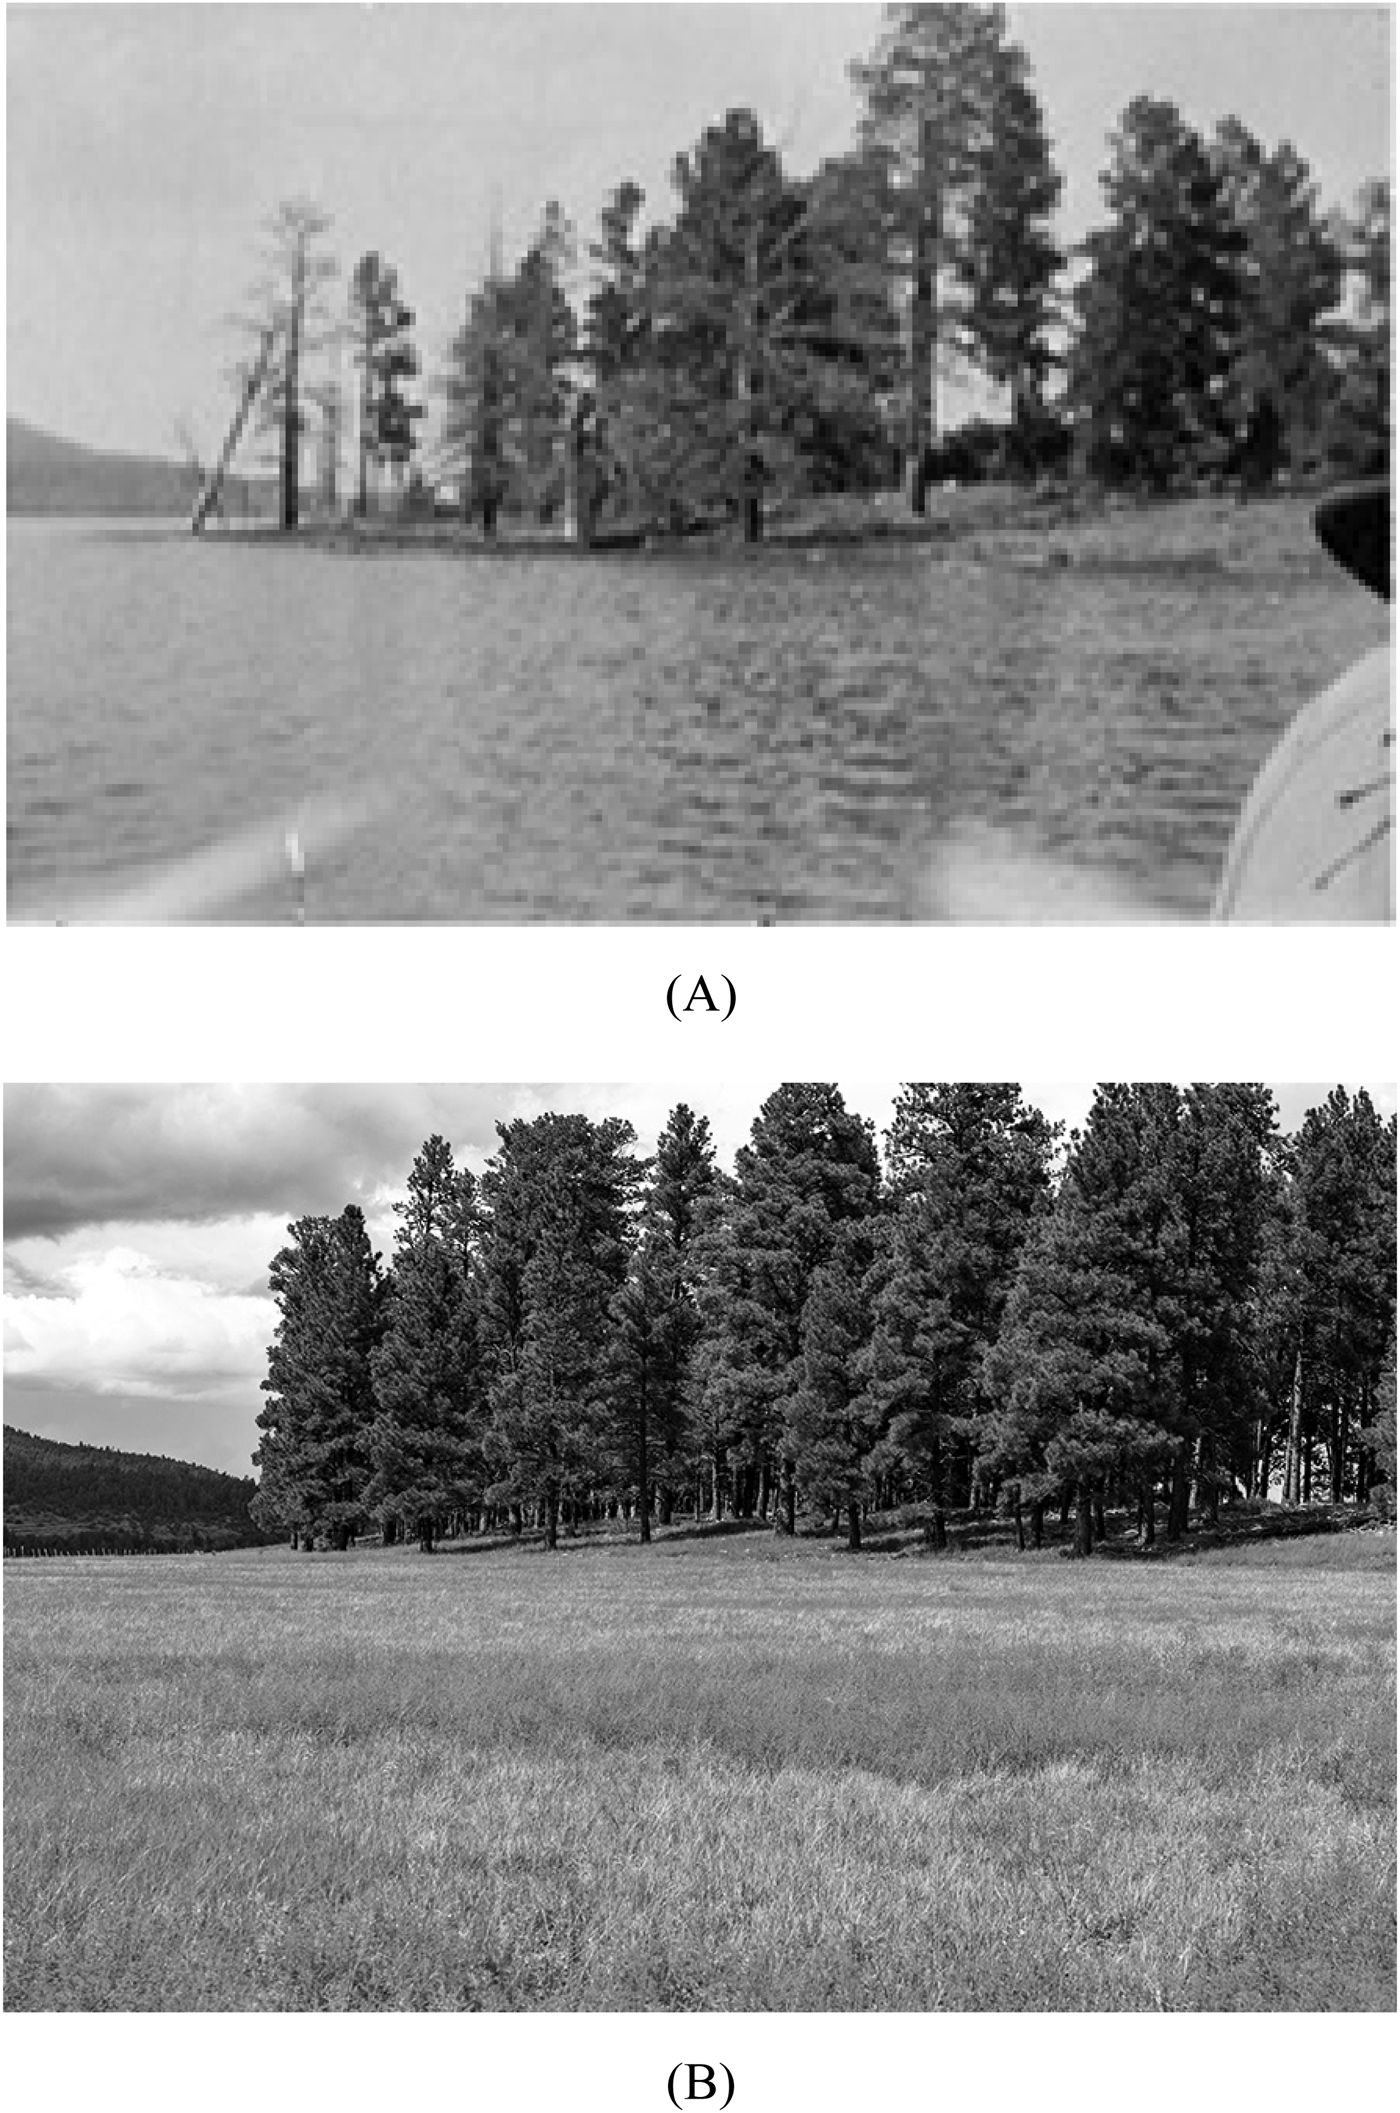
Figure 2. Photograph of the island, probably 1920. (A) South side of the island viewed from a small boat; (B) similar scene in August 2016. Pastureland presently surrounds the former island. Courtesy of Hoover Collection-Arizona Memory Project and Arizona Historical Society.
In 1920, Grass Tank berm and Grass Tank subbasin were completely inundated (Fig. 3). Driftwood 185 m NNE of the left corner of the building banked against an abandoned graded road constructed along the east side of the lake in 1919. The age of the road is from a U.S. Bureau of Public Roads benchmark dated 1919. The position of the driftwood is most likely related to the inundation shown in the 1920 photograph. The indicated water level is ca. 8 m, the deepest of the historical record. A 1925 photograph taken from the south side of Rockledge looks south across a narrow, bouldery, vegetation-free shoreline (Fig. 4). The caption states “water very rough waves breaking five feet high.” Over time, the numerous young Ponderosa in the foreground of the relocated photograph advanced downslope across the former shoreline. A single vague waterline is on a boulder immediately north of the relocated photographic site. The level at the waterline is 5.2 m. In summer 1934, when the lake was reportedly low during drought, its measured depth was 4.9 m (Madsen, Reference Madsen1935), which is 1.1 m less than the maximum depth after 1941. Finally, a brochure printed in 1937–1938 advertised row- and powerboat rentals, implying adequate depth at the shoreline for boat landings.

Figure 3. Grass Tank berm, 1920. (A) North-facing photograph of flooded milking barn and two outbuildings (constructed on the berm) when the lake was at its historic high level, inferred water level is 7.9 m; (B) similar scene in 2018, other buildings have collapsed. Courtesy of Cline Library Special Collections, Northern Arizona University.
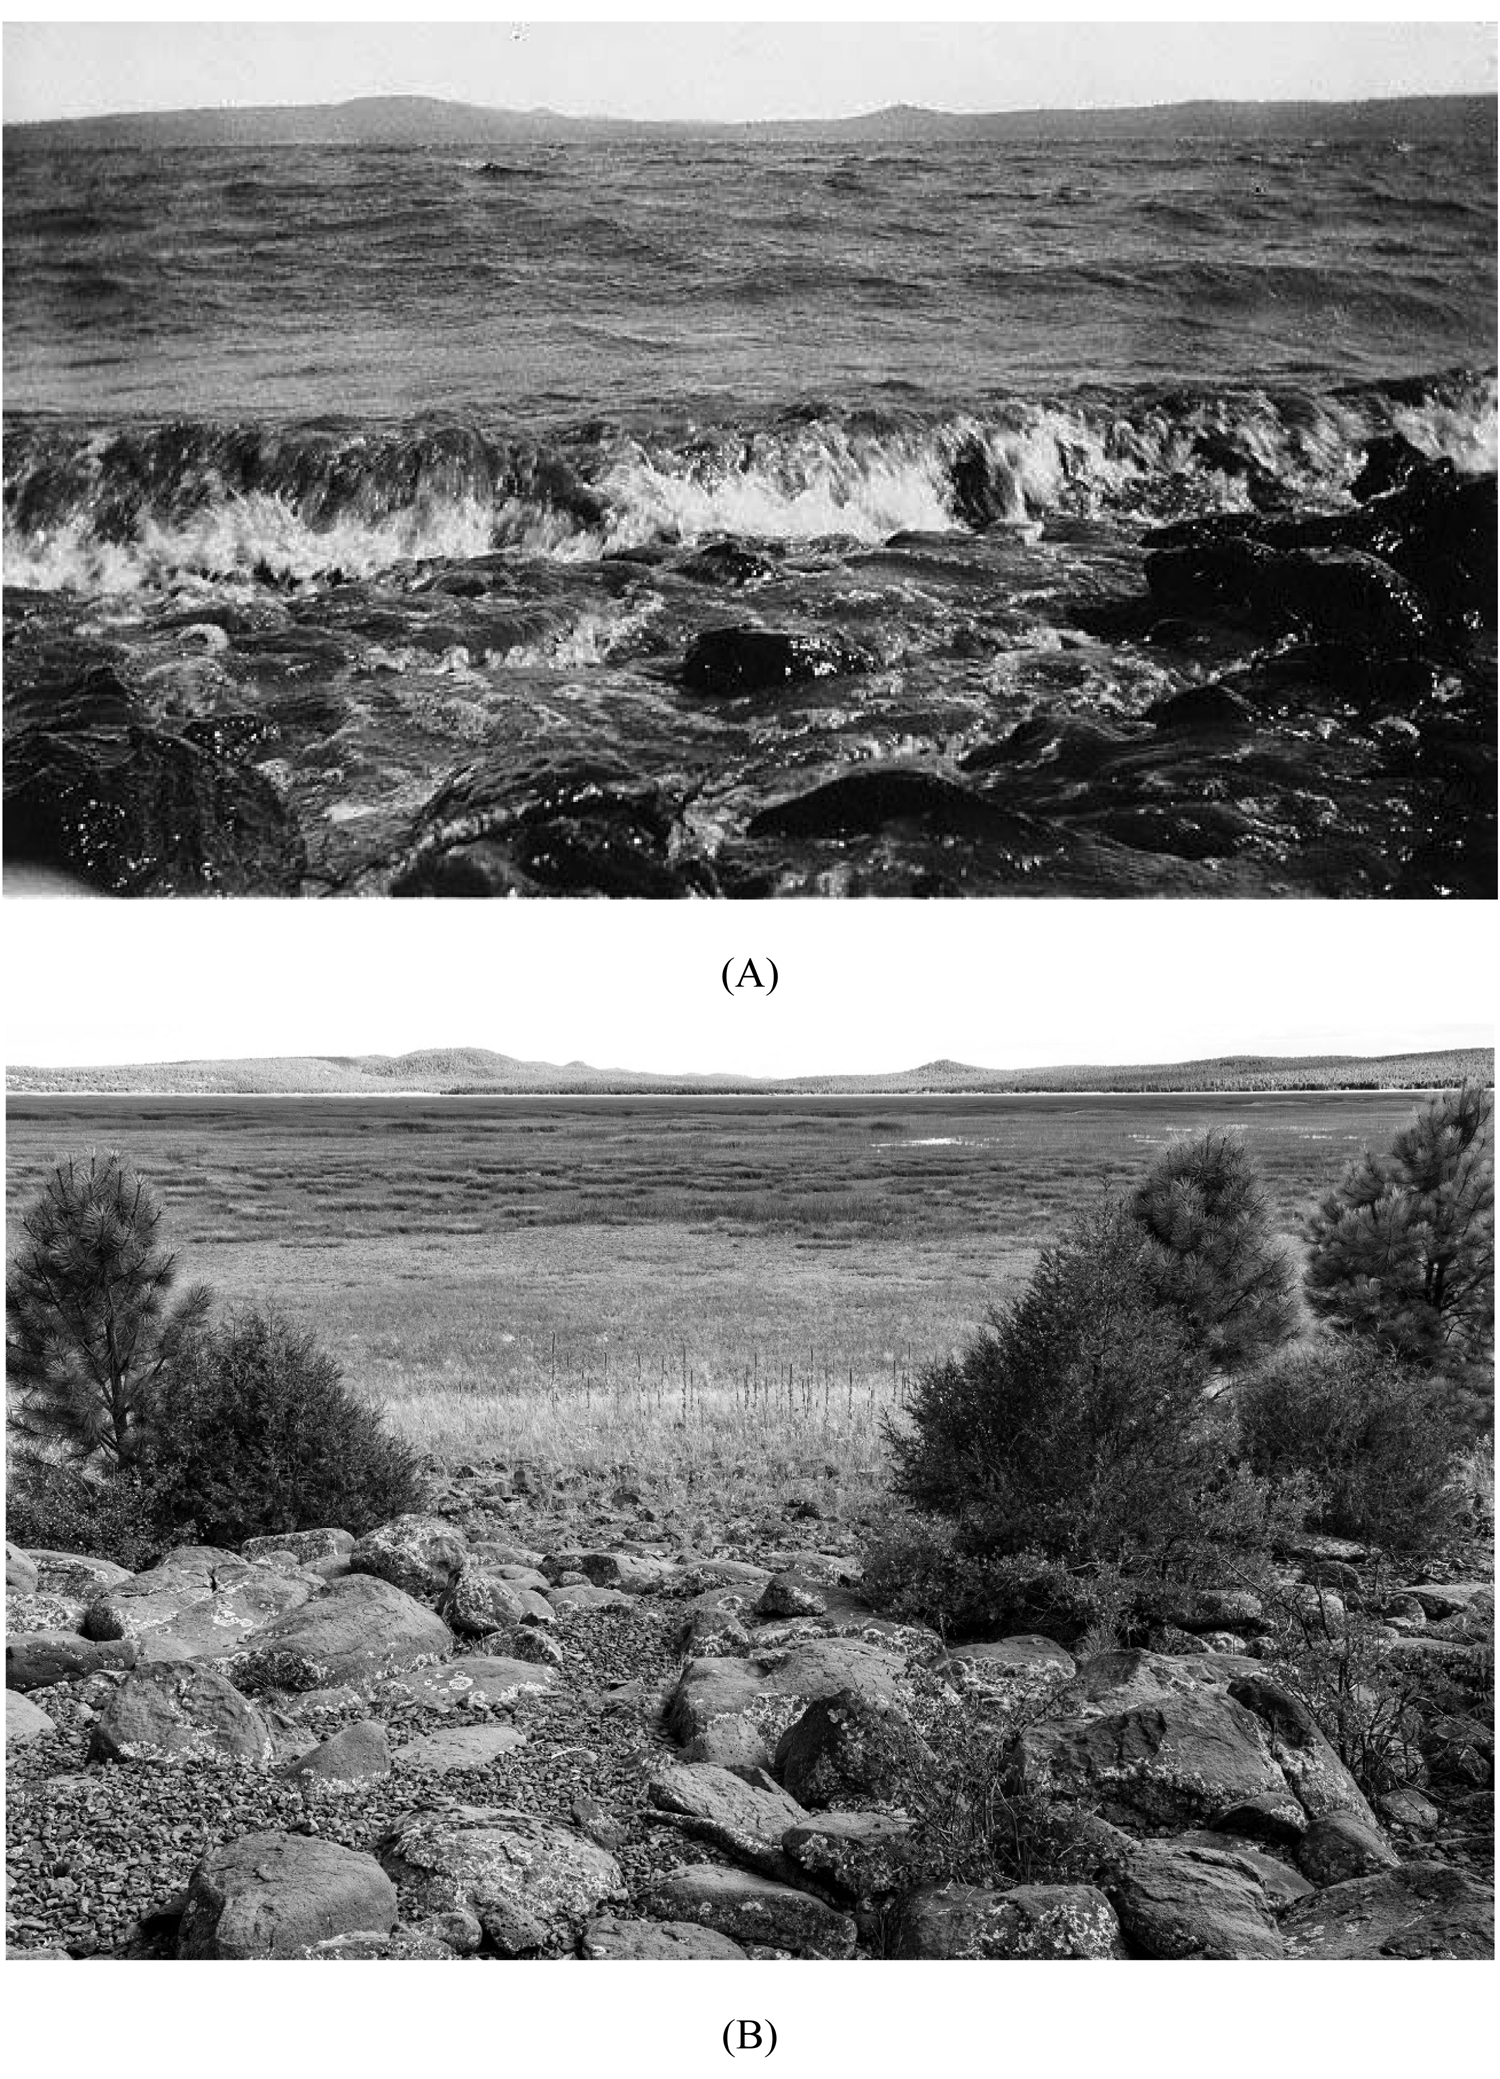
Figure 4. Bass Point shoreline, 1925. (A) South-facing view across an inundated bouldery shoreline and wave-swept lake; (B) approximately same view in 2019 showing abandoned shoreline overgrown by downslope encroachment of nearshore blackjack pine forest. Courtesy of Cline Library Special Collections, Northern Arizona University.
Lake levels since 1941
The main post-1941 shoreline, which is the Ribes shoreline (or highstand) described later, is decidedly lower than the documented water levels of the early 1900s. Published reports, mapping aerial-photographic surveys, and satellite imagery provide 40 numeric estimates of water level for the period 1947–2016. The lake receded after 1941, and water levels dropped substantially until it was reportedly dry in 1947, probably for the first time since 1905. It was also dry in 1948, 1951, 1953–1956, and 1972 (Gatewood et al., Reference Gatewood, Wilson, Thomas and Kister1964; Smith and Bender, Reference Smith and Bender1973). Gatewood's 1953–1956 dry period is too long, as aerial photographs, probably unavailable to Gatewood et al. (Reference Gatewood, Wilson, Thomas and Kister1964) and Smith and Bender (Reference Smith and Bender1973), show shallow water in the lake in 1953 and 1954. Anecdotal reports indicate the lake was also dry in 1957 and that the exposed lake bed was the source of troublesome windblown dust for several years (Public Library Archives 628.1F74, Flagstaff, AZ). In 1968, 1975, and 1978, the lake was reported dry in January, but rose to 1.8 m in April following spring snowmelt runoff. Beginning in 1959 to the present, recent field observations and various aerial-photographic surveys identify seven additional years when the lake was dry (Supplementary Data 1).
Nearshore vegetation
Vegetation is present along portions of the east, north, and south shorelines at similar elevations. The vegetation postdates 1941 and is associated with water levels below those of the early 1900s, based on analysis of early aerial photographs and tree-ring dating of P. ponderosa. An erect shrub (wax currant, Ribes cereum Nutt.) extends 4.3 km along the east shoreline from south of Grass Tank berm (Fig. 1B). The water level of this narrow, gravelly shoreline varies from 3.5 to 3.6 m. The previously mentioned 1923 photograph shows local details of the east shoreline, which was bouldery, grassy, and completely lacking bushes or trees. This contrasts with the R. cereum and scattered cottonwood (Populus fremontii) that presently dominate the shoreline. Vegetation along the shoreline is sparse and unidentifiable in 1953 aerial photography. However, by 1973, widely spaced brushy vegetation resembling R. cereum is present in two photographs of the east shore (Smith and Bender, Reference Smith and Bender1973). Subsequent aerial photography suggests the vegetation developed along the shoreline in short linear patches. By 1978, the patches had coalesced into an essentially continuous shoreline feature. This relatively narrow shoreline is referred to as the Ribes highstand.
Small numbers of weathered plastic items and aluminum beverage cans are present in shoreline debris near and on the 3.5–3.6 m Ribes level. The cans have distinctive, datable openings, including push-button closures, cans with disposable pull rings, and those with “stay behind” closures. The push-button closure was introduced in 1972 and phased out in 1977. Pull-ring disposable tabs were common throughout the 1970s and were produced as late as 1983, and the nondisposable openings were introduced in the 1980s (Maxwell, Reference Maxwell1993). This suggests the debris accumulated on the vegetated shoreline from 1972 until at least the early 1980s.
The appearance and age of nearshore pine are generally dependent on their height above the lake floor, as supported by field observations and ring counts of nearshore P. ponderosa (Fig. 5). In the field, large mature trees, termed “yellow pine” or “yellowbelly” for the distinctive color of the bark, typically occupy positions mostly above water levels of the early 1900s. Younger and smaller trees lie below the yellowbelly down to the lowest shoreline. The younger trees, called blackjack, have dusky bark with crowns tapering upward to a point (Fiedler and Arno, Reference Fiedler and Arno2015). Five-cored yellowbelly have a median germination date of 1819 and a water level of 8.5 m. This suggests that water levels since then have not been above about 8.5 m for long enough to eradicate these trees. Ponderosa roots require oxygenation; the tree does not tolerate saturated soil (Brinkley and Fisher, Reference Brinkley and Fisher2012). The range in water level of blackjack is 2.7–6.3 m. The two oldest blackjack are present on the island and north of the ranger station (Fig. 1B). The trees date to 1915 and 1923 at a median water level of 5 m. This water level, as shown in a following section, is close to the estimated average level of the 1913–1941 period. Two blackjack were sampled southeast of the lodge, and eight were sampled north of the ranger station. These trees have a median germination date of 1952 and a water level of 4.8 m. The median water level of the trees, however, is above the documented post-1941 water levels, which indicates they germinated on the dry lake bed during recession of the lake in the 1940s.

Figure 5. Germination age, date, elevation, and water level of nearshore Pinus ponderosa.
On the north side of the lake in the Rockledge area, blackjack pine is locally rooted on a linear shoreline composed of pebble to small cobble gravel that slopes gently toward the lake floor. Four trees at the top of this shoreline date to 1965 with a water level of 3.8 m. The two lowest trees are on the 2.7 m level and date to 1985; blackjack is not found on the lake floor below this level. This information suggests that levels were not above 3.8 m long enough or frequently enough since 1965 to eradicate trees or the brushy R. cereum. And sustained water levels since 1985 have evidently been less than 2.7 m, although water was above this level occasionally in the early 1990s.
Waterlines
Waterlines are essentially irrefutable, accurate indicators of water level, although the lines are not sharply defined in every case. These features are absent around almost the entire perimeter of the lake. Beneath Bass Point, however, up to nine waterlines occur at two levels along a 560 m west–east shoreline transect (Fig. 6). The waterlines are discontinuous; they occur only on boulders with subvertical surfaces that face the lake. Lake sediment underlies the lower group to the west and cobble to small boulder talus to the east. The four waterlines of the upper group range in water level from ca. 4.6 to 6.7 m. This range is below the historic ca. 8 m highstand, indicating they formed after 1920. The uppermost four waterlines of the lower group correspond to levels ranging from 3.3 to 3.6 m. This interval is within the level of the Ribes shoreline (3.5–3.6 m) on the east side of the lake. Moreover, the lowest waterline is very close to the 2.7 m shoreline at Rockledge dated to 1985. West of the lower waterline group, age-diagnostic shoreline debris rests on a terrace-like shoreline feature. The debris consists of three aluminum beer cans with the previously described push-button closure, disposable pull ring, and stay-behind closure; water levels average ca. 3.5 m. The fourth item, at water level 3.7 m, is a sandal made from 1987–1992, according to the manufacturer. Taken together, this information suggests that the lower group shorelines date from as early as 1972 to after 1992. Considering both groups, the waterlines record the lake's recession after 1920 to the high levels of the 1970s to early 1990s.

Figure 6. West-to-east shoreline transect below east end of Bass Point showing elevation and corresponding levels of two waterline groups (pattern) that formed after 1920 to before 1947 and 1972 to shortly after 1992 as indicated by age-diagnostic debris at the top of the lower level. Waterlines are solid circles crossed with a horizontal line. The Ribes shoreline lies between 2169.1 and 2169.4 m elevation or equivalent level of 3.5–3.8 m.
Historical lake-level chronology
Available sources for the historical period, 1885–2016, provide 51 numeric estimates of water level. Eleven levels span 1885–1941 and 38 cover the period 1947–2016. Water-level data are unavailable for 32 yr of the latter 70 yr interval (Fig. 7, Supplementary Data 1). Water levels shown in Landsat imagery (https://www.earthexplorer.usgs.gov) for the spring seasons of 1972–2018, although difficult to quantify, reveal relatively high levels year after year during a wet period ending in 1995. Perhaps the most striking feature of the entire image sequence is the low levels and repeated desiccation of the lake beginning in 2000 after the drought that began in 1996.

Figure 7. Elevation of reconstructed water levels and associated surface area and volume, 1885–2016. Pattern shows historical, Ribes highstand, and dry to low-water levels after ca. 1941. Dashed line connects points across years with unknown depth.
The reconstructed lake levels are minimum values. Most of the aerial and historical ground-based photographs were made between May and October, after the period of maximum snowmelt runoff and well within the period of high evaporative loss. Only the year of the early photographs is given. But they too were taken in late spring to summer, as the scenes record a landscape lacking snow cover, even on Mormon Mountain and the high terrain surrounding the lake (Figs. 2–4). Moreover, as a popular recreational area, the lake was visited and photographed in summertime, probably not winter, largely because winter weather is severe and access on the unpaved roads of that era was difficult. This bias toward minimum reconstructed water levels partially explains the considerable variation between climate and lake level documented in the following section. Another related source of variability occurs when the reconstructed depth is zero, because some amount of precipitation and snowfall occurs annually.
To summarize, historical water levels were evidently high from 1905 to 1941. Water was reported in the lake, and levels were probably high, given the climate of that period, although measurements from 1905 to 1912 are unavailable. The average reconstructed level of the lake from 1913 to 1941 was 4.8 m. The lake rose steadily after 1913, reaching its historic maximum level of ca. 8 m in 1920, which is more than twice its estimated highest level after 1941. From 1920 to 1941, the lake apparently maintained levels of ca. 5–6 m with a surface area >25 km2 and typical volume of 0.1 to a maximum of 0.2 km3. After 1941, the lake receded precipitously until it was dry in 1947. Thereafter, until the present, the lake was frequently dry or shallow. Even during the 18 yr of remarkably favorable conditions during the 1970s to mid-1990s (recorded by the Ribes highstand), the lake did not attain its former high levels or maintain levels above the Ribes shoreline. During this wet episode, surface area peaked at 25 km2 and volume reached 0.07 km3, which is substantially less the sustained levels of the early 1900s. During most of the post-1941 period, surface area was mostly <20 km2, and volume was typically <0.03 km3. Finally, the rapid rise of lake level from 1913 to 1920 suggests the lake could have reached its historical high levels even during a relatively short wet period during the 1970s to 1990s.
DISCUSSION OF LAKE LEVELS AND HYDROCLIMATE
Climate is evidently spatially coherent in the study region, as suggested by significant correlations (Pearson correlation coefficient) between the five weather stations and each type of climate data. Correlation of annual precipitation ranges from 0.5 to 0.83 and averages 0.7 ± 0.09 (standard deviation). Average annual temperatures correlate well; r ranges from 0.46 to 0.88 with an average of 0.73 ± 0.13. Annual (October to May) snowfall correlations among four stations range from r = 0.50 to 0.99 and average 0.69 ± 0.19.
Reconstructed lake levels of the 1913–2016 period correlate significantly with three climate variables—cool-season precipitation, snowfall, and warm-season temperature anomaly (Fig. 8). Lake level or depth is positively correlated (Spearman's correlation coefficient) with cool-season precipitation and snowfall. In contrast, the warm-season temperature anomaly relates inversely to water level. Correlations of level with cool-season temperature anomaly and warm-season precipitation do not rise to statistical significance, although they are reasonably expected to influence lake levels. The correlations of climate with level are relatively modest; nevertheless, precipitation and temperature are important climatic factors controlling lake levels.

Figure 8. Scatter plots showing the relation between lake level and three climate variables over the period 1913–2016. (A) Cool-season precipitation; (B) snowfall; (C) warm-season temperature anomaly.
Long-term precipitation and temperature patterns of the aggregated weather station data resemble (Fig. 1B) those of the larger Southwest (Hereford et al., Reference Hereford, Webb and Longpŕe2006, Reference Hereford, Bennett and Fairley2014; Chylek et al., Reference Chylek, Dubey, Lesins, Jiangnan and Hengartner2014). Precipitation climate of the Mormon Lake region has varied substantially over the late nineteenth to early twenty-first centuries. This variation caused fluctuations of lake levels on annual and multidecadal timescales (Fig. 7). Four precipitation episodes spanning 1905 to the present relate to lake levels (Fig. 9A–D). These are the early twentieth-century pluvial (E20CP), the mid-twentieth-century drought (M20CD), the wet episode, and the early twenty-first-century drought (E21CD). Precipitation during these episodes alternated between multidecadal periods of values above and below normal with seemingly abrupt transitions from one state to the other. These alternating patterns evidently preclude significant long-term trends of annual and seasonal precipitation (Fig. 10). Trendless precipitation is typical of the historical record of the Southwest and southern Colorado Plateau (Chylek et al., Reference Chylek, Dubey, Lesins, Jiangnan and Hengartner2014; Hereford et al., Reference Hereford, Bennett and Fairley2014). When grouped by precipitation episode (Fig. 11), cool-season precipitation and snowfall declined after 1995, while warm-season precipitation was unchanged. Cool- and warm-season temperatures, which are also relevant to changing long-term lake levels, were relatively low through 1941; temperatures increased in each episode after that time.

Figure 9. Terminology of precipitation episodes (top) and time series of precipitation, and temperature of five southwestern Colorado Plateau weather stations. Symbols are the average value of all reporting weather stations in a given year or season. (A) Combined cool- and warm-season precipitation; (B) cool-season precipitation; (C) average October to May snowfall; (D) warm-season rainfall; (E) average annual temperature anomaly; (F) average cool-season temperature anomaly; (G) average warm-season temperature anomaly.

Figure 10. Box plots of combined cool- and warm-season average annual precipitation of four precipitation episodes of the twentieth and twenty-first centuries.

Figure 11. Median and quartile range (pattern) of climate variables grouped by hydrologic episode as in Fig. 10. (A) Cool-season precipitation; (B) snowfall; (C) warm-season precipitation; (D and E) cool- and warm-season temperature anomaly, respectively. E20CP, early twentieth-century pluvial; M20CD, mid-twentieth-century drought; Wet, wet episode; E21CD, early twenty-first-century drought.
The high lake levels of the early 1900s were largely contemporaneous with the unusual annual and seasonal moisture of the E20CP (Fye et al., Reference Fye, Stahle and Cook2004; Woodhouse et al., Reference Woodhouse, Kunkel, Easterling and Cook2005; Cook et al., Reference Cook, Seager and Miller2011; Fig. 8A–D). Early attempts at regional water resource planning were based on the climate of the E20CP. Water apportionments of the Colorado River basin were inflated by the wet conditions of the 1920s, which overestimated twentieth-century average conditions. Dendroclimatological studies in the study region indicate that the E20CP was the most recent of six unusually wet and cool episodes during the 1335 yr from AD 570 to AD 1905 (Salzer, Reference Salzer2000). During the 36 yr E20CP, as identified herein,Footnote 1 22 yr (61%) of combined cool and warm-season average annual precipitation were above normal, the result of increased precipitation during both seasons. Snowfall amounts were also relatively high during the E20CP, particularly from 1915 to 1937. Low water levels and frequent desiccation following the E20CP began in 1942 with a regional drought (Thomas, Reference Thomas1962), now termed M20CD.Footnote 2 This 34 yr dry period had 22 yr of below normal precipitation (65%) and 12 yr of above normal precipitation. Snowfall in 1947 is one of the five lowest on record, and the lake was reportedly dry then for the first time since 1904. The M20CD resulted in regional plant die-off in woodlands as well as increased invasion of shrubs into grasslands (Swetnam and Betancourt, Reference Swetnam and Betancourt1998). In the study area, the E21CD was evidently the drier of the two (Fig. 10). Temperatures in the study region during the M20CD were relatively cool (Fig. 9E–G). This condition probably favored the record snowfalls of 1932 and 1973, which are the two largest snowfall events of the 116 yr record (Fig. 9C).
During the late 1970s to mid-1990s, an 18 yr wet episode prevailed with 11 yr (61%) of above normal precipitation and 7 yr of below normal precipitation. Although its duration was less, average annual and seasonal precipitation amounts of this recent wet episode were similar to and indistinguishable from those of the E20CP (Figs. 10 and 11A and C). Unlike the wet and cool E20CP, available dendroclimatology of the wet episode indicates that it was wet and warm from 1978 to at least 1988 (Salzer and Kipfmueller, Reference Salzer and Kipfmueller2005; Campbell et al., Reference Campbell, Seager, Williams and Cook2019). Regionally, the wet period caused an increase in tree-ring growth and possibly tree recruitment (Swetnam and Betancourt, Reference Swetnam and Betancourt1998). Moreover, annuals and perennials of the Mojave Desert of southeastern California responded favorably to increased moisture (Hereford et al., Reference Hereford, Webb and Longpŕe2006). Because of the exceptional moisture of the wet episode throughout the United States, Fye et al. (Reference Fye, Stahle and Cook2004) referred to it as the late twentieth-century North American pluvial. Interestingly, the lake's response to this widespread episode of abundant moisture was minimal, although lake levels were the highest since 1941 (Fig. 7). This weak response is probably unrelated to the short duration of the wet episode, because the lake can rise rapidly; it rose 7 m in as many years during the E20CP.
The ongoing E21CD (Breshears et al., Reference Breshears, Cobb, Rich, Price, Craig, Balice and Romme2005; Hereford et al., Reference Hereford, Webb and Longpŕe2006; Cayan et al., Reference Cayan, Das, Pierce, Barnett, Tyree and Gershunov2010; Woodhouse et al., Reference Woodhouse, Meko, MacDonald, Stahle and Cook2010) is perhaps the most severe within the instrumental record, except possibly the pronounced regional drought of the early 1890s to 1904, which is well expressed in the dendroclimatology of the study region (Salzer, Reference Salzer2000). Williams et al. (Reference Williams, Cook, Smerdon, Cook, Abatzoglou, Bolles, Baek, Badger and Livneh2020) found that in the expanded southwest North American region, the E21CD is the driest 19 yr period since AD 800; moreover, it is evidently an emerging megadrought that is substantially enhanced by global warming. In the study region, 2002 is the second driest, if not the driest, within the 116 yr instrumental record. Compared with the earlier M20CD, the E21CD had less cool-season precipitation, reduced snowfall, and elevated seasonal temperatures (Campbell et al., Reference Campbell, Seager, Williams and Cook2019; Fig. 11). During the E21CD, as well as during the earlier M20CD, tree mortality was pervasive in mixed-conifer and P. ponderosa forests of the southwestern Colorado Plateau (Swetnam and Betancourt, Reference Swetnam and Betancourt1998; Breshears et al., Reference Breshears, Cobb, Rich, Price, Craig, Balice and Romme2005; Ganey and Vojta, Reference Ganey and Vojta2011).
Annual and seasonal temperatures have increased substantially in the study region. From the coolest to the warmest year on record—1903 and 2014, respectively—the average annual temperature anomaly was ca. 3.3°C warmer (Fig. 9E). Long-term trends of increasing annual and seasonal temperature anomalies are significant. Mean annual temperature increased at an average rate of 1.2°C per century from 1898 to 2016. During 1965–2016, the rate apparently increased to 2.2°C. These trends are also evident in the cool- and warm-season temperature anomalies (Fig. 9F and G). The rates of temperature increase of the study region are reasonably close to those of the broader Southwest over the same two periods (Breshears et al., Reference Breshears, Cobb, Rich, Price, Craig, Balice and Romme2005; Chylek et al., Reference Chylek, Dubey, Lesins, Jiangnan and Hengartner2014). Warming climate in the Southwest since the 1960s has also led to increasing evapotranspiration as measured by atmospheric vapor pressure deficit (VPD; Seager et al., Reference Seager, Hooks, Williams, Cook, Nakamura and Henderson2015). VPD is an exponential function of temperature that reflects drought stress and atmospheric moisture demand on the landscape (Williams et al., Reference Williams, Allen, Millar, Swetnam, Michaelsen, Still and Leavitt2010, Reference Williams, Allen, Macaldy, Griffin, Woodhouse and Meko2013, Reference Williams, Seager, Macaldy, Berkelhammer, Crimmins and Swetnam2014). Regionally increasing VPD should contribute to reduced water levels of Mormon Lake.
The lake's post-1941 water-level chronology of frequent desiccation and low water levels could imply the lake has returned to ordinary levels after the unusual high stages of the E20CP (Fig. 7). But the lake's modest increase of water level during the wet episode suggests otherwise—increased temperatures were evidently reducing effective precipitation (precipitation minus evaporation), thereby constraining lake levels. Cool- and warm-season precipitation as well as snowfall amounts of the wet episode were like those of the E20CP (Fig. 12A–C). So it seems reasonable to infer that the lake would regain most of its former depth, area, and volume. Instead, maximum levels during the wet episode were only ca. 3.8 m, average water level was 2.0 m, and surface area and particularly volume were substantially lower. Normal to mostly above normal average annual and seasonal temperature anomalies likely dampened levels during the wet episode (Fig. 12D and E). This dampening has increased and continues into the present E21CD, in which cool- and warm-season temperature anomalies and possibly VPD continue to rise substantially, while cool-season precipitation and snowfall decline. Finally, the water-level history after 1941 suggests the E21CD is not a transient multiyear drought like those of the past, which resulted from natural climate variability (Jones and Gutzler, Reference Jones and Gutzler2016). Rather, the history, at least since the late 1970s or earlier, is a hydrological manifestation of a trend toward warmer and drier climate that likely originates from global warming.

Figure 12. Box plots comparing precipitation and temperature changes between the early twentieth-century pluvial (E20CP) and the wet episode (left and right sides of the box plot columns, respectively). (A) Cool- and (B) warm-season precipitation; (C) snowfall; (D and E) cool- and warm-season average annual temperature anomaly, respectively.
The pattern of alternating wet and dry climate in the twentieth century was contemporaneous with decadal to multidecadal shifts in the state of the PDO and AMO. The geomorphological and ecosystem responses to changing states of the PDO have been widespread in the Southwest extending from the Mojave Desert to the southern Colorado Plateau and the deserts of Arizona and southwestern New Mexico (Hereford et al., Reference Hereford, Webb and Longpŕe2006, Reference Hereford, Bennett and Fairley2014). Time series of the PDO in the twentieth century show phase shifts at approximately 1905, the early 1940s, 1976–1977, and 1998 (Gedalof et al., Reference Gedalof, Mantua and Peterson2002; Huang et al., Reference Huang, Seager and Kushnir2005; Newman et al., Reference Newman, Alexander, Ault, Cobb, Deser and Di Lorenzo2016). The significant shift from a cool to warm PDO phase in 1905 coincides with the beginning of the E20CP. Staring in the early 1940s, the PDO shifted to a dominantly cool phase, ushering in the M20CD. In 1976–1978, the PDO entered a warm phase (Huang et al., Reference Huang, Seager and Kushnir2005) that generally corresponds with the wet episode of the late-1970s to mid-1990s. The current warm E21CD (Woodhouse et al., Reference Woodhouse, Meko, MacDonald, Stahle and Cook2010) is apparently related to a mixed regimen of cool and warm PDO and persistently elevated AMO. Long-term lake levels (Fig. 7) and the precipitation history of the study region (Fig. 9A–D) reflect these cool and warm phases of the combined AMO-PDO.
A statistical model of lake level as a function of regional climate was developed for 1947–2016 (Fig. 13). This period was chosen because depth data are relatively abundant, whereas data for the E20CP are sparse, with only seven reconstructed levels during the 36 yr pluvial (Fig. 7). Moreover, levels of the E20CP are also substantially higher than during 1947–2016, the E20CP levels likely represent a different statistical population, and 1947 is the beginning of the lake's post-E20CP water-level regimen. Modeled water levels show the relationship of lake level to the three global-scale multidecadal to subdecadal atmospheric and oceanic indicators of climate variability. In the linear regression model, lake level is the dependent variable and cool-season precipitation is the independent variable (Fig. 9B). The model is statistically significant i.e., P < 10−4; F = 17.1; r 2 = 0.32.

Figure 13. Time series of modeled lake level compared with three global climate indices and regional hydroclimate, 1947–2016. (A) Atlantic Multidecadal Oscillation (AMO) sea-surface temperature (SST) anomaly; (B) Pacific Decadal Oscillation (PDO) index; (C) average monthly Niño 3.4 SST anomaly; purple, green, and gray symbols are El Niño, La Niña, and neutral events; (D) Palmer Drought Severity Index (PDSI) of northeastern Arizona, positive values indicate increased moisture, negative values indicate drought or drought-like conditions; (E) modeled lake level. Dashed vertical lines highlight combinations of positive and negative regimes of the AMO and PDO and corresponding drought frequency expressed as percent of years with drought in each regime, after McCabe et al. (Reference McCabe, Palecki and Betancourt2004). Note the wet episode has persistently high lake levels and the lowest drought frequency of the entire period.
The modeled lake levels capture the contrasting dry–wet–dry temporal patterns of the M20CD, wet episode, and E21CD, respectively. These long-term variations of lake level occur during periods with three distinct combinations of ± phases of the AMO and PDO. The periods are characterized by increased (decreased) drought frequency of 20 yr intervals (Fig. 13A and B), and they are spatially associated with varying degrees of moisture in large parts of North America (McCabe et al., Reference McCabe, Palecki and Betancourt2004, Reference McCabe, Betancourt, Gray, Palecki and Hidalgo2008 and maps therein). For example, the M20CD from 1947–1963 was the result of +AMO contemporaneous with −PDO; drought frequency was 35%–40%. A reduction of drought frequency to 20%–30% ensued after 1963, as both the AMO and PDO shifted to negative phases. The wet episode occurred during −AMO and +PDO phases, producing high-water levels and low drought frequency throughout the Southwest. The influence of the PDO during the E21CD is not as clear as that of the M20CD, although the increased drought frequency alone could result from the persistent +AMO phase.
ENSO is a subdecadal modulator of lake level whose long-term variation is enhanced by different AMO/PDO phases (Routson et al., Reference Routson, Woodhouse, Overpeck, Betancourt and McKay2016; Fig. 13C). Two relatively short 6 and 12 month ENs characterized the dryness of the early M20CD. This, combined with two relatively lengthy 17 and 31 month LNs, resulted in low water levels and high drought frequency for most of the early M20CD. By contrast, the latter part of the M20CD had four relatively short ENs, two were potent, 1964–1965 and 1972–1973, and four LNs ranging from 9 to 14 months. This combination reduced drought frequency with modeled water levels that were above average in seven of 15 yr. During the wet episode, five ENs ranging from 7 to 19 months in duration and two comparatively short LNs occurred; the 1989 LN was relatively strong. This situation favored above normal lake levels 68% of the time and the lowest drought frequency of the period. In contrast, during E21CD, six ENs averaging 12 months each had little influence on lake level. The modeled level rose substantially only once during a brief, weak EN in 2004–2005 that was associated with unusually heavy cool-season precipitation. Even the remarkably strong EN of 2015–2016 had little influence on lake levels. Otherwise, three LNs lasting 10–24 months and neutral conditions apparently favored lake levels well below average. Regional PDSI (Fig. 13D) correlates significantly with modeled and actual lake level and aligns temporally with the AMO/PDO phases. Climate of the study region since at least 1947 is evidently teleconnected with fluctuations of global-scale atmospheric and oceanic processes whereby climate modulates Mormon Lake water levels.
Regarding the remarkably high prehistorical water levels, the conditions necessary to raise the lake to such high levels were likely similar to the hydroclimate of the E20CP. Average cool- and warm-season temperature anomalies during the E20CP were commonly ca. 2.4°C and 1.7°C below historical averages, respectively (Fig. 9F and G). If these conditions were to prevail for more than a few decades in the absence of substantial warming, hydrologic storage would be enhanced, and the lake would rise to and beyond its historic high level. As mentioned previously, periglacial features on San Francisco Mountain and the White Mountains probably correlate with relatively minor late Holocene glacial advances in the central Sierra Nevada (Péwé and Updike, Reference Péwé and Updike1976). Summer temperatures during this Neoglacial were 1.8°C–2.8°C below historical values, and snow-water equivalent increased (Bowerman and Clark, Reference Bowerman and Clark2011). If the cooling of the central Sierra Nevada leading to glacial advances during the late Holocene was widespread, periglacial activity on San Francisco Mountain and the White Mountains seems possible. Moreover, several wet and cool climate episodes, such as those affecting glacial activity in the Sierra Nevada and high-water levels of Owens Lake, could also cause the unusually high prehistoric levels of Mormon Lake.
CONCLUSIONS
Lacustrine sediment records provide evidence of multiple prehistorical shorelines whose oldest water level was up to three times higher than the historic level of the early 1900s. Sediment accumulated on four shorelines with average water levels clustered at ca. 15, 17, 20, and 23 m. With little to no soil development, these late Holocene deposits are apparently quite young; AMS 14C and tree-ring dating show the deposits range in age from somewhat greater than 3.55 to less than ca. 0.20 ka BP. With climate like the early 1900s and with hydrologic storage, the lake could rise to and maintain unusually high levels during a relatively long-duration cool and wet episode.
The historical rise and fall of Mormon Lake was affected by long-term negative changes of water balance that are manifestations of regional aridification. The lake was at its largest area and volume during the E20CP, when warm-season temperature was the lowest of the twentieth century and cool-season precipitation was high (Figs. 7 and 9). Reduced lake levels and recurrent desiccation after 1941 were associated with increased warm-season temperatures, reduced cool-season moisture, and less snowfall. During the wet episode in the mid-1970s to early 1990s, precipitation and snowfall increased to levels similar to those of the E20CP. The lake, nonetheless, remained well below the depth, the area, and particularly the volume of the E20CP. This muted response probably resulted from substantial increases of temperature compared with the E20CP (Fig. 12) and increasing regional VPD after 1961. Since 1947, multidecadal fluctuations of reconstructed water levels were contemporaneous with the atmospheric and oceanic influences of various AMO-PDO phases that in turn modulated ENSO frequency (Fig. 13).
Climate modeling experiments that include increasing concentrations of greenhouse gases predict the ongoing shift to a warmer, more arid climate in the Mormon Lake region and broader Southwest (Seager et al. Reference Seager, Ting, Held, Kushnir, Jian and Vecchi2007; Garfin et al., Reference Garfin, Franco, Blanco, Comrie, Gonazalez, Piechota, Smyth, Waskom, Melillo, Richmond and Yohe2014). In the present scenario of global climate change, it seems unlikely that the lake will recover its former high levels and the negative influences of aridification will continue unabated in the region. Furthermore, the lake's water-level history suggests that aridification began in the late 1970s, if not with commencement of the M20CD. From this perspective, the E21CD is an intensified continuation of drying that began in the 1940s.
ACKNOWLEDGMENTS
Charles Benedict (Arizona Game and Fish Department) provided archival records of the Mormon Lake fishery. Peter Pilles located and made available archival U.S. Forest Service aerial photography of the lake. Landsat imagery from 1972 to 2018 was accessed and processed for shoreline identification by Don Bayles Jr. (Flagstaff, AZ). Abraham Springer (Northern Arizona University) provided preliminary data on discharge of springs adjacent to the lake. Glenn Rink (Northern Arizona University Herbarium) identified lakeshore vegetation. Thanks to Quaternary Research reviewers Steven Bacon and Cody Routson. R. Scott Anderson, Kenneth Cole, Gregory McCabe, Phillip Pearthree, Connie Woodhouse, and Ann Youberg reviewed earlier versions of the article. Each reviewer provided helpful comments and insights. The collections of the following institutions were searched for photographic and anecdotal information about Mormon Lake: Cline Library Special Collections and Archives, Northern Arizona University, Museum of Northern Arizona Research Library, Flagstaff; University of Arizona Library Special Collections, Tucson; Arizona State University Hayden Library, Tempe; and Arizona Historical Society, Tucson and Tempe.
SUPPLEMENTARY MATERIAL
The supplementary material for this article can be found at https://doi.org/10.1017/qua.2020.92