


Non-communicable diseases (NCD) have been the greatest contributor to mortality and disease burden globally, with growing trends during the recent decades(Reference Roth, Abate and Abate1). Various non-modifiable (e.g. age, gender and ethnicity) and modifiable (e.g. behavioural, social and cultural) risk factors have been blamed for the progression of the most prominent subcategories of NCD(Reference Yarahmadi, Etemad and Hazaveh2–Reference Azadnajafabad, Mohammadi and Aminorroaya4). As the major preventable determining factors of NCD, unhealthy diet, physical inactivity and tobacco use have attracted increasing attention(Reference Fahimi and Pharoah5). Unhealthy or suboptimal dietary habits have an important role in developing chronic NCD(Reference Afshin, Sur and Fay6). In 2017, high Na intake, low whole grains intake and low fruit intake were the essential culprits for all-ages deaths and disability-adjusted life years globally(Reference Afshin, Sur and Fay6). Hence, it seems imperative to implement suitable preventive strategies to stem the imposed burden of these risk factors.
High salt intake has been proved to be associated with numerous NCD development(Reference Fahimi and Pharoah5,Reference He and MacGregor7) . Hypertension is one of the major affected conditions responsible for various CVD(8,Reference He and MacGregor9) . Moreover, other potentially negative effects of high salt intake include increased risk of gastric cancer(Reference Malekzadeh, Derakhshan and Malekzadeh10–Reference Mohammadi, Aminorroaya and Fattahi12), kidney stones and osteoporosis(Reference Cappuccio, Kalaitzidis and Duneclift13,Reference Devine, Criddle and Dick14) , direct impact on stroke and left ventricular hypertrophy independent of hypertension(Reference Du Cailar, Ribstein and Daures15,Reference Perry and Beevers16) , proteinuria and renal disease(Reference Verhave, Hillege and Burgerhof17), asthma progression and exacerbation(Reference Burney18), and it is an indirect cause of obesity by increasing intake of fluids(Reference He, Markandu and Sagnella19).
Diet-related NCD are growing rapidly in low- and middle-income countries, necessitating the implementation of urgent action plans to mitigate this trend(Reference Azadnajafabad, Mohammadi and Aminorroaya4,Reference Lachat, Otchere and Roberfroid20) . Investing in the prevention of NCD through financial and economic means is an effective method of stopping and managing the heavy burden of these diseases(Reference Nugent, Bertram and Jan21,Reference Aminorroaya, Fattahi and Azadnajafabad22) . Iran, a country within the Middle East region – a well-known area with vast socio-economic differences and inequities(Reference Alvaredo, Assouad and Piketty23) – showed the highest rates of mortality and disability-adjusted life years attributable to high salt intake(Reference Ghazizadeh-Hashemi and Larijani24,Reference Gholami, Baradaran and Khatibzadeh25) . A recent national report on salt intake in Iran represented that 97·66 % of the Iranian population consumes at least 5 g/d of salt. The mean salt intake among the population was 9·52 g/d (95 % CI 9·48, 9·56) in that survey(Reference Rezaei, Mahmoudi and Sheidaei26). Also, a precious time-trend study on salt intake of the Iranian population exhibited an increasing trend of salt intake, especially with a significant increase in men, between 1998 and 2013(Reference Mohammadifard, Khosravi and Salas-Salvadó27). The undesirable dietary habits particularly high salt intake in Iran are nearly consistent with other countries located in the Middle East region, like the Arab countries and Turkey having noticeable population(Reference Afshin, Micha and Khatibzadeh3,Reference Erdem, Akpolat and Derici28–Reference Nasreddine, Akl and Al-Shaar31) .
A successful action plan on handling high salt intake in populations starts with precise knowledge of salt intake in different geographic, economic and cultural domains of a country or region(Reference Fahimi and Pharoah5,Reference Mohammadifard, Fahimi and Khosravi32,Reference Fattahi, Azadnajafabad and Mohammadi33) . Various studies around the world investigated spatiotemporal variations of salt intake(Reference Cappuccio, Ji and Donfrancesco34–Reference Powles, Fahimi and Micha37). Besides, socio-economic status (SES) as a determinant of high salt intake has been studied in different countries(Reference Lachat, Otchere and Roberfroid20,Reference Cappuccio, Ji and Donfrancesco34,Reference Ji, Kandala and Cappuccio36–Reference Mazloomy Mahmoodabad, Tehrani and Gholian-Aval38) . Although some studies examined salt intake in Iranian regions, it seems difficult to arrive at the best evidence-based decision concerning the current literature since the performed reports lack detailed data on all districts and regions(Reference Rezaei, Mahmoudi and Sheidaei26). Therefore, in this study, we aimed to study socio-demographic differences of salt intake based on different geographical, social and economic aspects among districts of Iran. A thorough knowledge about variations of salt intake in different areas enables health authorities to introduce new policies to prevent high salt intake as a major risk factor for substantial NCD in countries like Iran.
Materials and methods
Data source and study population
We recruited the participants’ data from the Iran STEPwise approach to risk factor Surveillance 2016 study, based on 30 541 enrolled participants with 18 years old age and above. A cluster random sampling method of populations was done to enroll candidates from urban and rural populations of thirty provinces of Iran. The collected data covered 389 districts of Iran. Spot urine sampling – as a random urine sample – was obtained from all the candidates aged at least 25 years old. All collected samples were brought into the central headquarter of the survey in less than 18 h and analysed by one calibrated auto-analyser (Cobas C311 Hitachi High–Technologies Corporation) by the central committee(Reference Djalalinia, Modirian and Sheidaei39). Three equations (Kawasaki, Tanaka and INTERSALT) were used to estimate daily salt intake from spot urine samples. The values derived from the Tanaka formula were set as the reference values since this method had the lowest root mean square error compared with others(Reference Peng, Li and Wang40). Finally, a total number of 18 635 salt intake measurements from individuals were received and included by the central committee of the study(Reference Rezaei, Mahmoudi and Sheidaei26). The difference between the present paper and the previously published one(Reference Rezaei, Mahmoudi and Sheidaei26) is the more detailed investigation in this study by the chosen estimation model explained in the following sections. Iran is composed of thirty provinces, and each province consists of multiple districts. In the previous publication based on the Iran STEPwise approach to risk factor Surveillance 2016 survey, the values for high salt intake were reported for the participants chosen from provinces, and data were for the province level and reported at the individual level. Also, participants in that study were from 389 (out of 429) districts of Iran, and data for the remaining forty districts were not available. To meet this gap, we estimated the prevalence of high salt intake for all districts of Iran, and the provided data in this study are the aggregated data, not individual.
Study variables
High salt intake is the main variable of this study, defined as dietary guidelines of the WHO. The guideline mandates average daily consumption of sodium chloride (daily salt intake) less than 5 g for the general adult population of all countries except for regions that lower levels of salt intake have already been set based on prior investigations(41). We estimated the prevalence of high salt intake, defined as daily intake equal or more than 5 g, among all districts of Iran through the small area estimation method. The burden of high salt intake, defined as the number of populations in a district with a daily salt intake ≥ 5 g, was also estimated. All estimations were made for each sex separately. The utilisation of a salt shaker at the last meal was one of the questions in the STEPwise approach to risk factor Surveillance survey and was scored as a 1–5 scaling system by the participants. High scores of this question were determined as excess salt consumption variable to highlight the importance of self-report in salt intake.
Small area estimation method
To estimate spatial differences of salt intake in Iran, we used the small area estimation method, a statistical method utilised to estimate variables in areas with a small sample size and subpopulations of a smaller area within a larger geographical domain. We also stratified the population based on the two sexes in all districts of the country in 2016. Small areas due to small sample sizes may have imprecise estimations of variables. Therefore, various statistical methods have been suggested to generate valid and accurate statistics for these areas(Reference Ghosh and Rao42). Small area estimation methods are mainly based on generalised linear mixed models. A regression model encompassing covariates and correlated spatial errors dependent on near domains will help to make better estimations if a variable has a spatial dependence in small areas. This study utilised a Bayesian spatial hierarchical multilevel regression model for two levels of provincial and district estimations. The small area estimation model consists of two parts of a sampling model (#1) and a linking model (#2) as follows:
 $${p_{ij}}|{P_{ij}}\sim N\left( {{P_{ij}},{\psi _{ij}}} \right)$$
 \begin{gathered}
\hfill {P_{ij}}|\beta ,\gamma ,\sigma _\nu ^2\sim N(X_{ij}^\prime \beta {\mkern 1mu} {\text{ + }}{\mkern 1mu} {\text{Z}}_i^\prime \gamma ,\sigma _\nu ^{\text{2}})({\text{OR}}){\mkern 1mu} {P_{ij}} \\
\hfill = X_{ij}^\prime \beta {\mkern 1mu} {\text{ + }}{\mkern 1mu} {\text{Z}}_i^\prime \gamma {\mkern 1mu} {\text{ + }}{\mkern 1mu} {{\text{b}}_{{\text{ij}}}}{\mkern 1mu} {\text{ + }}{\mkern 1mu} {{\text{g}}_{\text{i}}}{\mkern 1mu} {\text{ + }}{\mkern 1mu} {{\text{s}}_{{\text{ij}}}} \\
\end{gathered}
\begin{gathered}
\hfill {P_{ij}}|\beta ,\gamma ,\sigma _\nu ^2\sim N(X_{ij}^\prime \beta {\mkern 1mu} {\text{ + }}{\mkern 1mu} {\text{Z}}_i^\prime \gamma ,\sigma _\nu ^{\text{2}})({\text{OR}}){\mkern 1mu} {P_{ij}} \\
\hfill = X_{ij}^\prime \beta {\mkern 1mu} {\text{ + }}{\mkern 1mu} {\text{Z}}_i^\prime \gamma {\mkern 1mu} {\text{ + }}{\mkern 1mu} {{\text{b}}_{{\text{ij}}}}{\mkern 1mu} {\text{ + }}{\mkern 1mu} {{\text{g}}_{\text{i}}}{\mkern 1mu} {\text{ + }}{\mkern 1mu} {{\text{s}}_{{\text{ij}}}} \\
\end{gathered}
where the
 $i = 1, \cdots ,m$
are the provinces and
$i = 1, \cdots ,m$
are the provinces and
 $j = 1, \cdots ,{n_i}$
are the districts within each province,
$j = 1, \cdots ,{n_i}$
are the districts within each province,
 ${\psi _{ij}}$
is the variance of the variable,
${\psi _{ij}}$
is the variance of the variable,
 $X$
is the matrix of determining factors in the provincial level,
$X$
is the matrix of determining factors in the provincial level,
 $Z$
is the matrix of determining factors in the district level,
$Z$
is the matrix of determining factors in the district level,
 ${b_{ij}}$
and
${b_{ij}}$
and
 ${g_i}$
are the random effects of provincial and district levels respectively, which have a normal distribution, and
${g_i}$
are the random effects of provincial and district levels respectively, which have a normal distribution, and
 ${s_{ij}}$
is the spatial random effect of near domains which has a conditional auto-regressive normal distribution(Reference Rao, Balakrishnan, Colton and Everitt43). Adjacency matrix was utilised to input data from near districts in estimations, as the districts sharing a border weighted one and other components of the matrix weighted zero. This matrix was then introduced to the auto-regressive normal distribution of the random spatial effects model. Considering the variables’ prior distribution and likelihood distribution, the posterior distribution was calculated, and exports of data by sex and all districts were made based on the mean, and 2·5 and 97·5 percentiles of the variable were calculated correspondence as 95 % of uncertainty interval (UI). The prevalence of high salt intake for the rest of forty districts without data on salt intake was estimated through this model, and final results were reported for an overall number of 429 districts.
${s_{ij}}$
is the spatial random effect of near domains which has a conditional auto-regressive normal distribution(Reference Rao, Balakrishnan, Colton and Everitt43). Adjacency matrix was utilised to input data from near districts in estimations, as the districts sharing a border weighted one and other components of the matrix weighted zero. This matrix was then introduced to the auto-regressive normal distribution of the random spatial effects model. Considering the variables’ prior distribution and likelihood distribution, the posterior distribution was calculated, and exports of data by sex and all districts were made based on the mean, and 2·5 and 97·5 percentiles of the variable were calculated correspondence as 95 % of uncertainty interval (UI). The prevalence of high salt intake for the rest of forty districts without data on salt intake was estimated through this model, and final results were reported for an overall number of 429 districts.
Spatial categorisations
Multiple categories of districts were generated to investigate differences of high salt intake in different areas. Comparisons between the four borders of Iran and areas by the seas were made. A previous survey in Iran classified all provinces in four main regions of the west, north-northeast, southeast and centrally based on geographical and SES to study metabolic risk factors of NCD(Reference Farzadfar, Danaei and Namdaritabar44). We also reported the prevalence of high salt intake among these super-regions of Iran.
Concentration index
The concentration index evaluated socio-economic variations and inequalities of salt intake. This index is calculated by the concentration curve. The concentration curve operates by a two-dimensional diagram composed of a health-associated variable (like salt intake in this study) and wealth index (as the socio-economic index). It visualises the status of the variable according to different economic categories. The wealth index was derived from household questionnaires assessing the SES. The principal components analysis method was used to aggregate data into the wealth index with five quintiles of poorest to richest categories(Reference Rezaei, Mahmoudi and Sheidaei26,Reference Vyas and Kumaranayake45) . The horizontal axis of the diagram demonstrates the cumulative percentage of wealth index (poorest to richest levels), and the vertical axis demonstrates the high salt intake. A 45° bisector line of the diagram means equality of the estimated variable. Curves placed above the bisector line express a higher concentration of locations in poorer domains, and the concentration index will be negative. Curves placed under the bisector line mean higher concentrations in richer domains, and the concentration index will be positive(Reference Erreygers46). The concentration index in this study was derived from the Households Income and Expenditure Survey of Iranian households in 2016(47). As it was defined based on regional levels, inequality refers to a geographical difference of salt intake in this study.
Statistical analysis
UI were utilised to compare districts, as overlapping UI meant a non-significant difference in comparison. A P-value less than 0·05 was considered statistically significant. Due to the small sample size for various age groups of each sex and imprecise estimations on age categories, age-standardised estimations were reported only for the prevalence of high salt intake. However, estimations for all ages were done too and used to calculate the burden of high salt intake. Small area estimation modelling was carried out by the R2WinBUGS package in R for Windows version 3.6.1 (http://www.r-project.org/, RRID: SCR_001905) and OpenBUGS software. Visualisation was done by R for Windows version 3.6.1. Statistical analyses were performed using STATA version 11 (STATA Corp.).
Results
Overview
The prevalence of high salt intake was significantly higher in men than in women 94·80 % (95 % UI 89·15, 99·62), 86·50 % (95 % UI 74·94, 97·58), respectively, P-value < 0·001). The estimated Pearson correlation coefficient between high salt intake and related diet and lifestyle habits showed mild to moderate associations. The high salt intake had a positive correlation with using a salt shaker at the last meal (Pearson correlation coefficient 0·22, P-value < 0·001) and excess salt consumption (0·28, P-value < 0·001). This variable also negatively correlated with lifestyle modifications, including reducing salt consumption habits in estimations (-0·32, P-value < 0·001).
High salt intake in districts
Comparing the estimated prevalence of high salt intake among all districts of Iran beside their estimated mean of daily salt intake showed subnational trends of salt intake. Females in the Masal district of Gilan province had the lowest estimated prevalence of high salt intake as 72·68 % (95 % UI 58·48, 84·81), which imposed an estimated burden of 13 300 (11 371–15 163) with a mean salt intake of 7·99 (95 % UI 6·74, 9·30) g/d. In contrast, females in the Darmian district of South Khorasan province had the highest prevalence as 95·04 % (95 % UI 87·10, 100) alongside a burden of 13 047 (12 093–13 702) with a mean salt intake of 10·03 (95 % UI 8·32, 11·73) g/d. Males in the Abadan district of Khuzestan province earned the lowest estimated prevalence as 88·44 % (95 % UI 80·29, 96·15), imposing a burden of 79 059 (70 794–86 684) with a mean salt intake of 9·39 (95 % UI 7·73, 11·05) g/d. The highest prevalence of high salt intake in men happened in the Khorramdarreh district of Zanjan province as 98·64 % (95 % UI 94·97, 100), contributing to a burden of 21 976 (21 220–22 288), with a mean salt intake of 12·37 (95 % UI 11·01, 13·72) g/d (online supplementary material, Supplemental Table 1). The total estimated numbers of mean daily salt intake, the prevalence of high salt intake and compelled burden for all districts of Iran are available in online supplementary material, Supplemental Table 2.
Disparities of high salt intake
Patterns of high salt intake revealed a higher prevalence in males. Detailed visualisation of the age-standardised prevalence of high salt intake is provided in Fig. 1. Male to female ratio of estimated high salt intake ranged between 0·997 and 1·31. Only one district in the country had a ratio roughly lower than one (Kamyaran district in Kordestan province, 0·977). The mentioned ratio in 232 districts ranged between 1·01 and 1·10, ratios of 179 districts ranged between 1·10 and 1·20, ratios of sixteen districts ranged between 1·20 and 1·30, and only one district had a ratio more than 1·30 (Masal district in Gilan Province, 1·31) (Fig. 2).
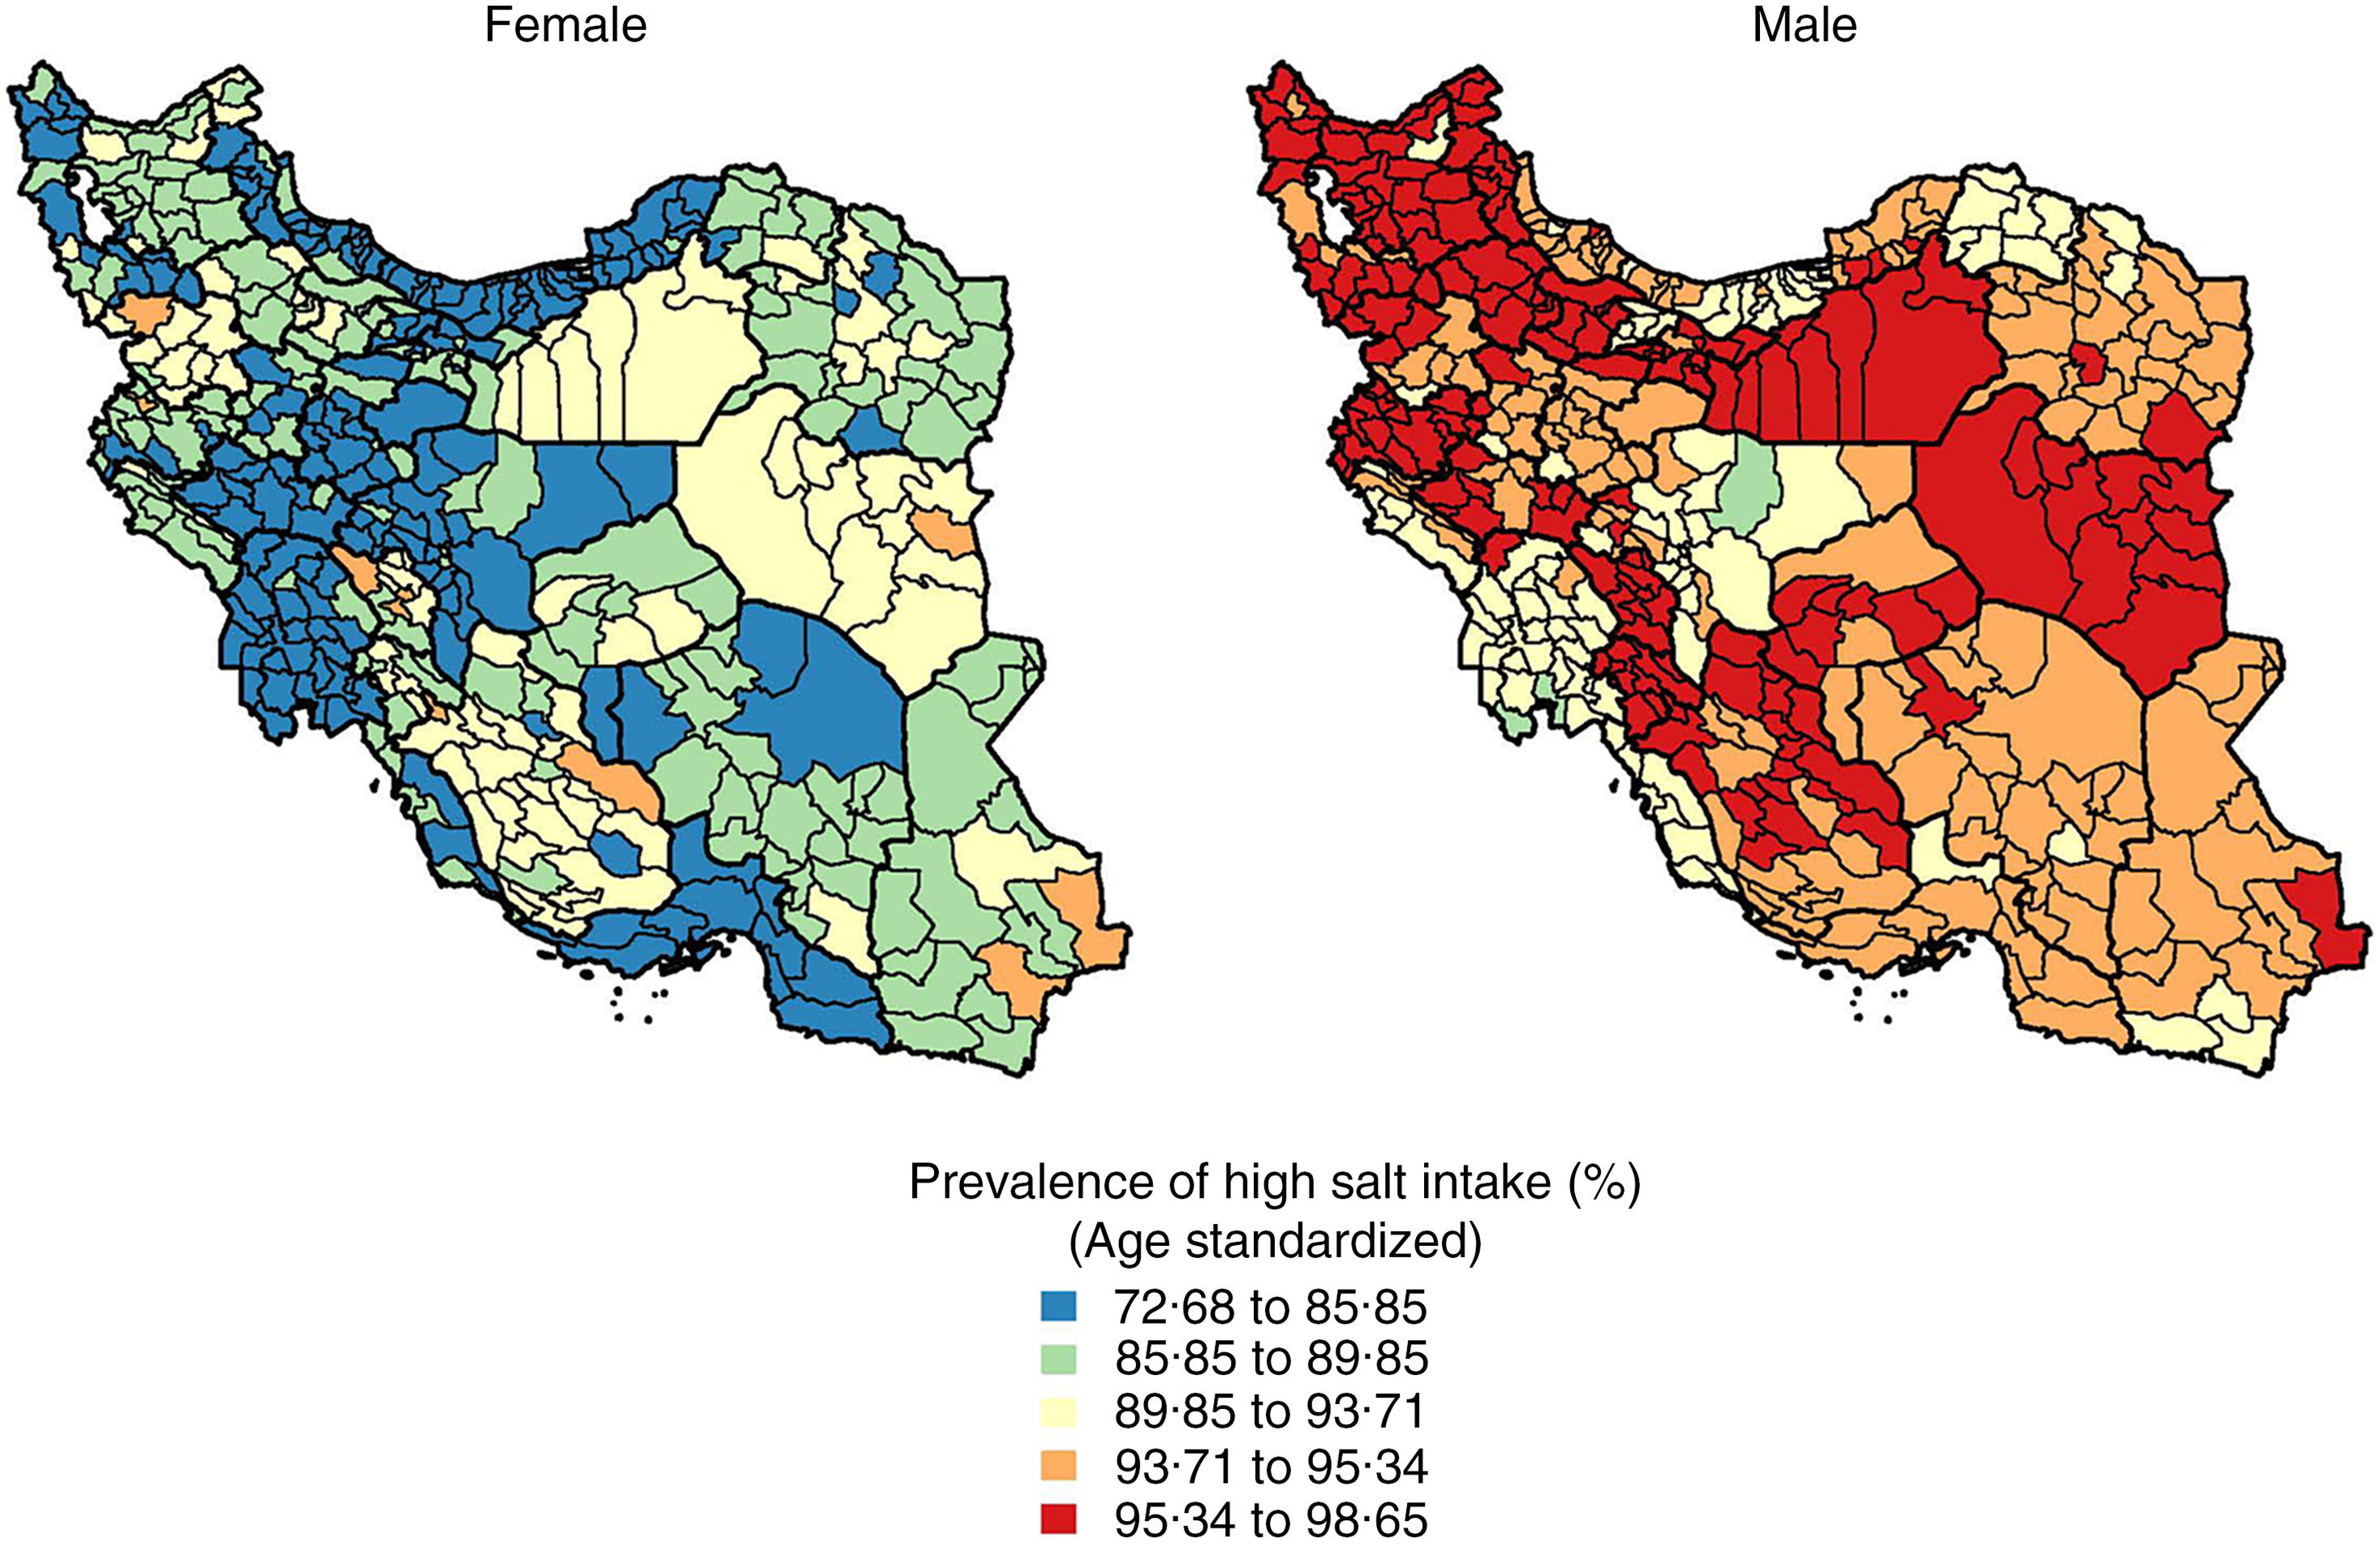
Fig. 1 Age-standardised prevalence of high salt intake in all districts of Iran, stratified by sex
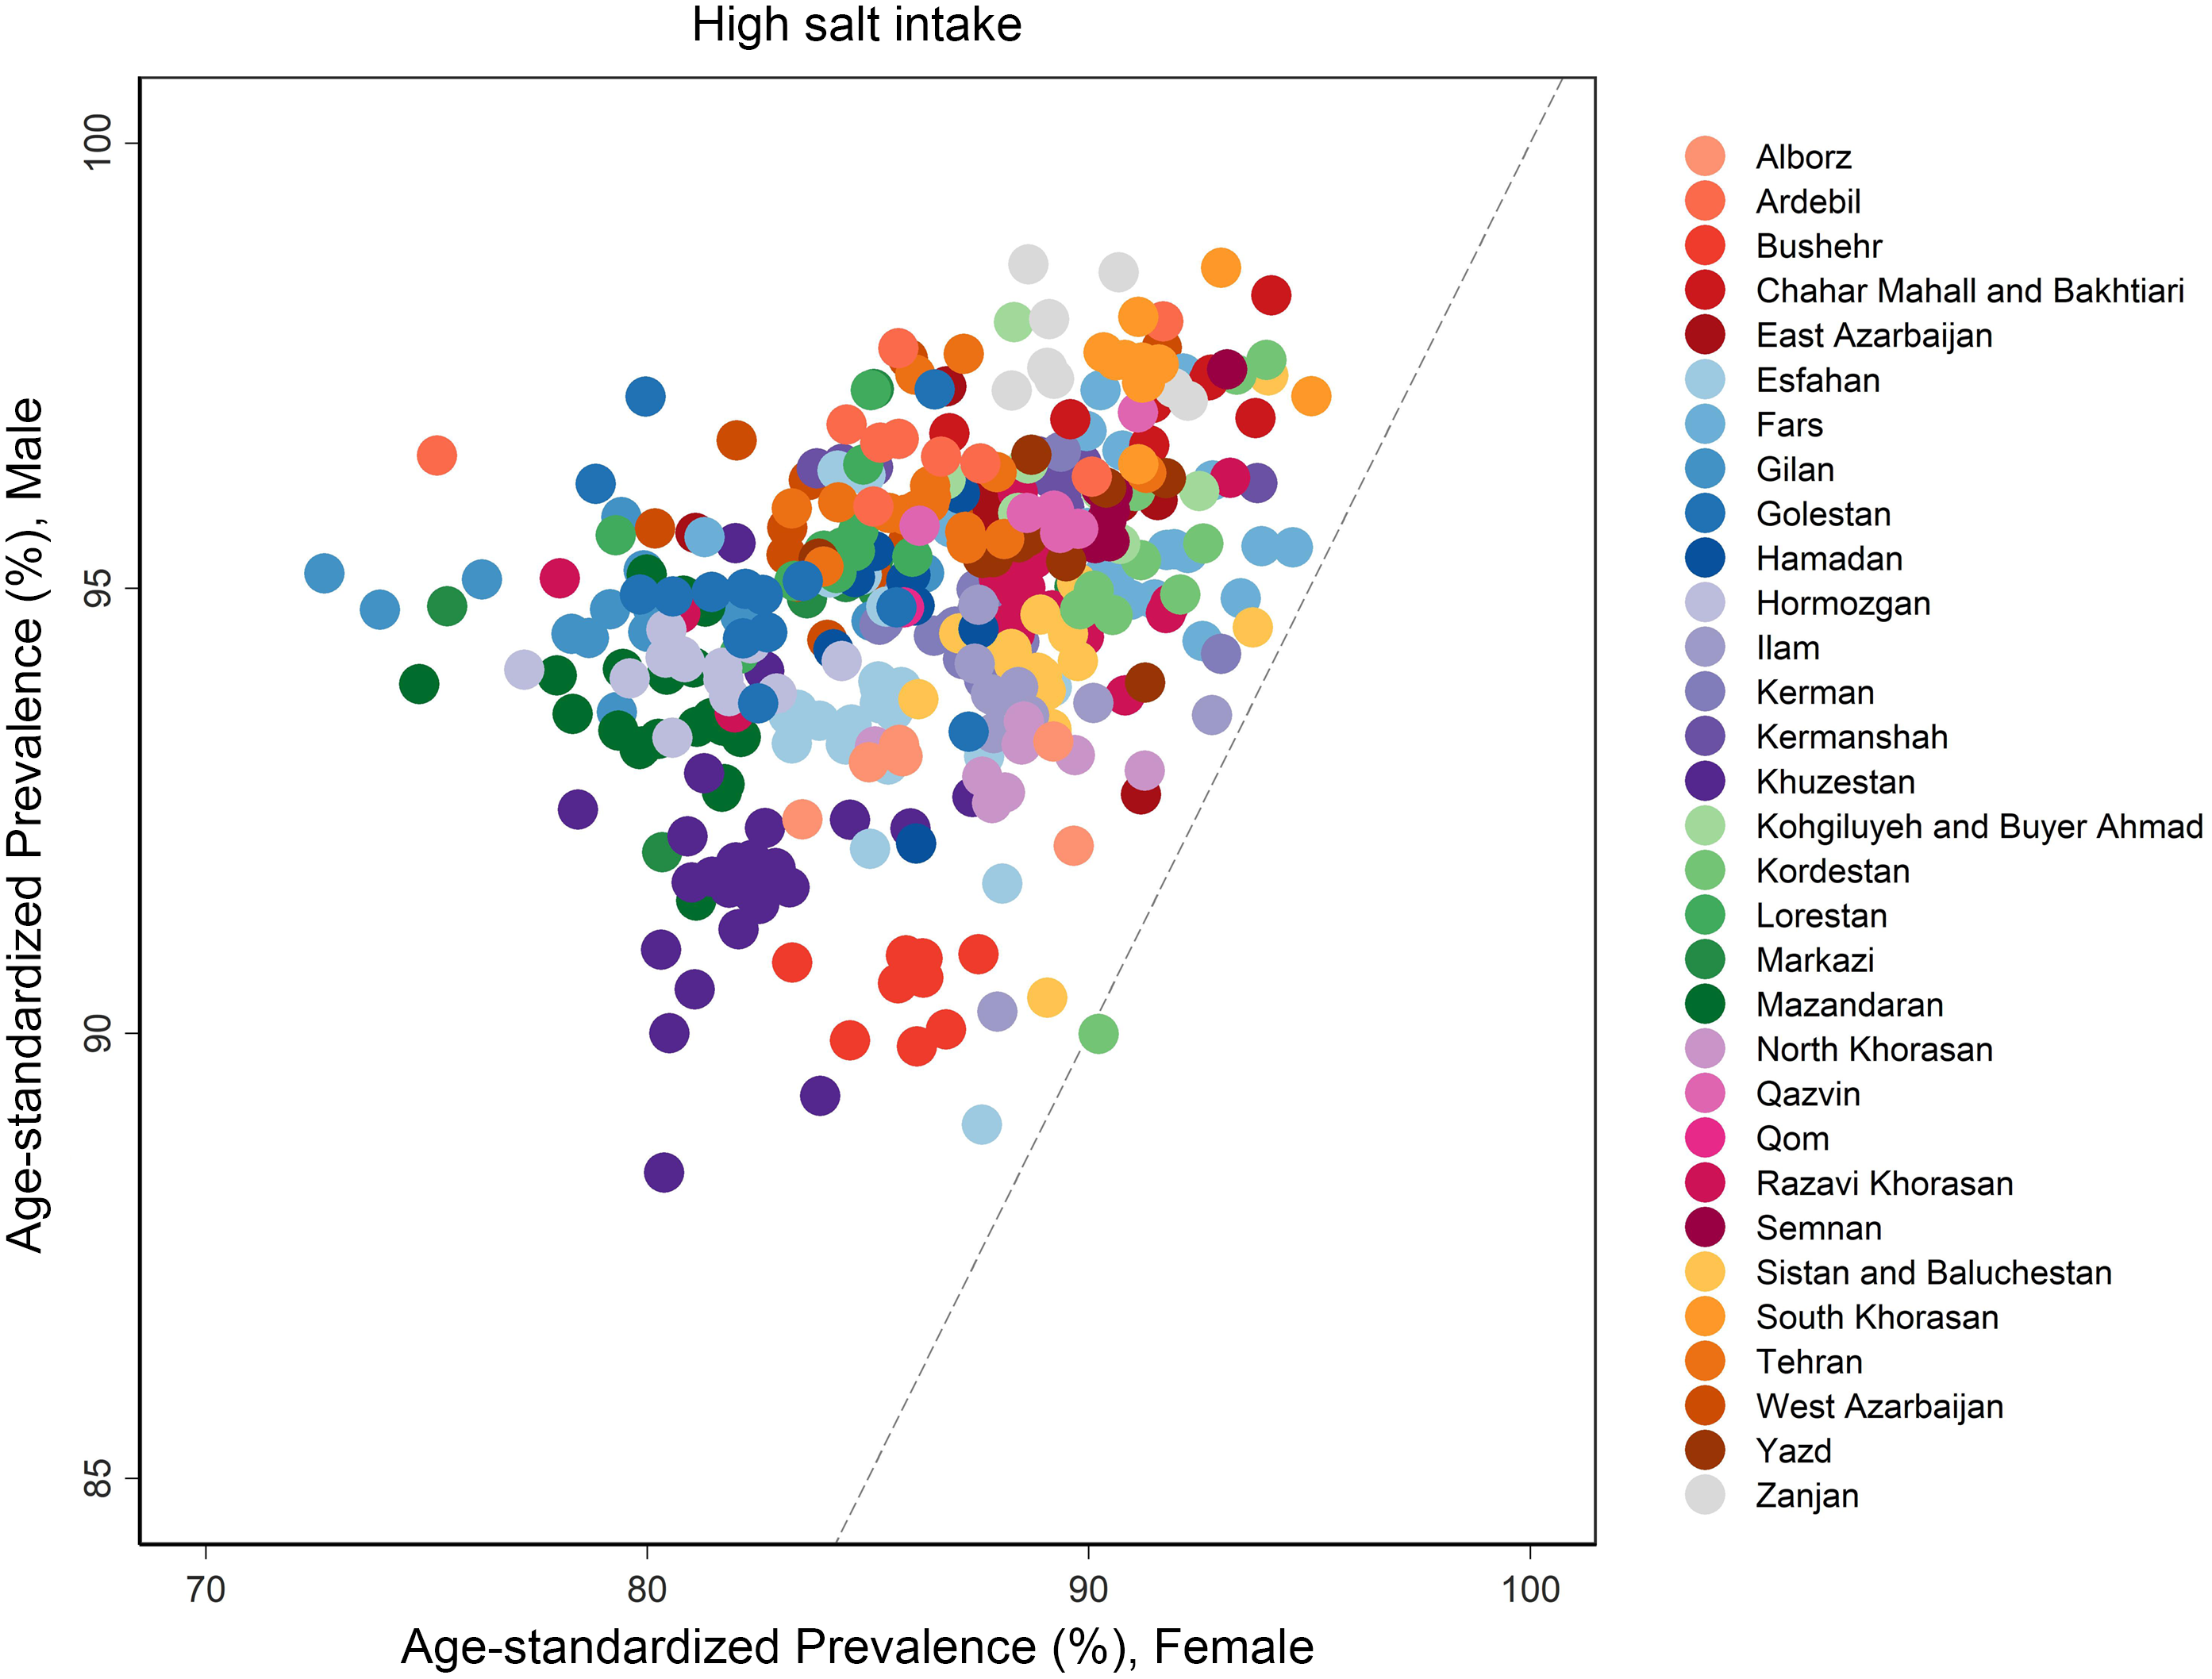
Fig. 2 Male to female ratio of the age-standardised prevalence of high salt intake compared in all districts of Iran
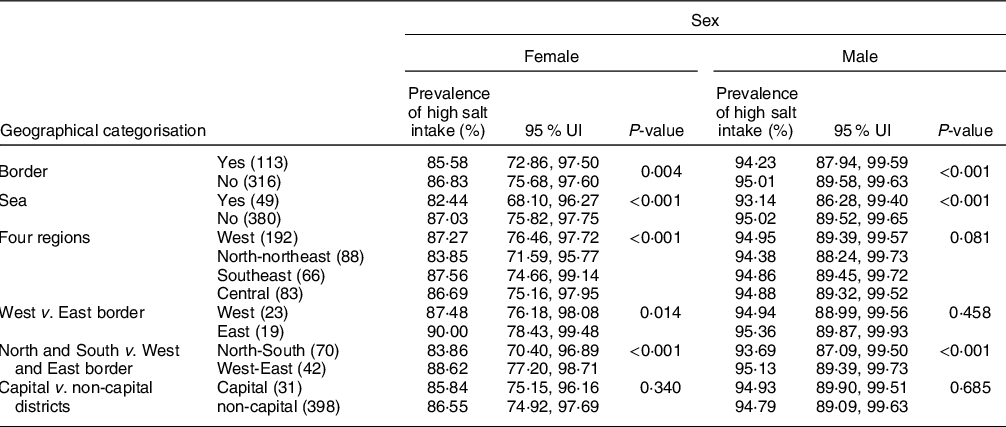
Various geographical and spatial variations of high salt intake were investigated. Districts sharing a border with other countries or seas/oceans (overall 113 districts) had a significantly lower high salt intake in comparison to non-border ones (316 districts) as 85·58 % (95 % UI 72·86, 97·50) v. 86·83 % (95 % UI 75·68, 97·60) in females (P-value = 0·004) and 94·23 % (95 % UI 87·94, 99·59) v. 95·01 % (95 % UI 89·58, 99·63) in males (P-value < 0·001). Districts located by the sea (forty-nine districts) had a lower prevalence of high salt intake in comparison to rest of districts (380 districts), as 82·44 % (95 % UI 68·10, 96·27) v. 87·03 % (95 % UI 75·82, 97·75) in females (P-value < 0·001) and 93·14 % (95 % UI 86·28, 99·40) v. 95·02 % (95 % UI 89·52, 99·65) in males (P-value < 0·001). Among provinces categorised in four main regions of the west, north-northeast, southeast and centrally, there was a significant difference between regions only in females, with the highest rates in the southeast region as 87·56 % (95 % UI 74·66, 99·14) v. the lowest in the north-northeast region as 83·85 % (95 % UI 71·59, 95·77) (P-value < 0·001). This regional categorisation showed no significant difference in males (P-value = 0·081). Females in districts located in the west border of Iran had a significantly lower prevalence of high salt intake as 87·48 % (95 % UI 76·18, 98·08) v. districts located in the east border as 90·00 % (95 % UI 78·43, 99·48) (P-value = 0·014). However, this difference was not significant in males of these two borders (P-value = 0·458). Districts located in the northern and southern borders of the country had significantly lower rates of high salt intake than districts of western and eastern borders for both sexes (P-value < 0·001). There were no significant differences between capital districts and non-capital districts among both males and females (Table 1).
Table 1 Geographical disparities of high salt intake prevalence based on different categorisations of districts in Iran, stratified by sex
Differences of high salt intake between districts of each province indicated higher variation rates among females of districts than males. Except for Qom province, which has just one district, the highest and lowest disparity (the difference between maximum and minimum estimated prevalence) among females of districts was seen in Ardebil and Hamadan provinces, with differences of 16·5 and 3·3, respectively. The estimated differences between males were the highest in Kordestan (7·6) and the least in Kermanshah (0·7) provinces (Fig. 3).

Fig. 3 Disparities of age-standardised prevalence of high salt intake among districts of each province of Iran, stratified by sex
The estimated concentration index for high salt intake in females showed a significantly higher prevalence of this value in the poor population as −0·005 (95 % UI −0·008, −0·002). This index in males showed a higher prevalence of high salt intake in richer people as 0·001 (95 % UI −0·0006, 0·002), but the difference was not significant.
Discussion
We set out to highlight the high salt intake in all districts across Iran. High salt consumption was higher in males than females. Salt intake among females of different districts and regions showed significantly higher variations than males of the same regions. Districts located in borders and by the sea had a lower prevalence of high salt intake. Districts in western and eastern borders showed higher salt intake rates compared with northern and southern districts. The SES showed a minor impact on salt intake in Iran. Self-reported use of a salt shaker at the last meal and self-reported excess salt consumption were significantly correlated with a higher prevalence of high salt intake.
A drastic higher prevalence of high salt intake in men than women in almost all districts in Iran was observed. This finding was consistent with previous estimations and investigations of salt intake in the Iranian population(Reference Mohammadifard, Khosravi and Salas-Salvadó27,Reference Mirzaei, Soltani and Namayandeh48,Reference Rafiei, Boshtam and Sarraf-Zadegan49) . One study highlighted the possible role of a more prominent positive attitude towards lower salt consumption among women, especially in population with higher education(Reference Mazloomi, Motlagh and Morowati50). Previous studies have suggested the potential impact of sex differences like the menstrual cycle on lower salt preference and consumption(Reference Frye and Demolar51,Reference Verma, Mahajan and Mittal52) . More participation of women in healthy eating habits like reading food labels, trying diets and a tendency to learn about nutrition and foods are other explanations(Reference Davy, Benes and Driskell53,Reference Li, Concepcion and Lee54) . Other behavioural differences between men and women, like higher compliance with dietary guidelines and believing in instructions, and more profound concern about physical appearance and health issues in women, have lead women to more awareness of high salt intake(Reference Turrell55).
Several geographical differences in high salt intake were reported in this study. Similar studies on spatial variations of high salt intake in Italy and the United Kingdom confirm the impact of regional differences on salt intake(Reference Cappuccio, Ji and Donfrancesco34,Reference Ji, Kandala and Cappuccio36) . A national survey in Italy showed significantly higher salt intake in the country’s southern regions(Reference Cappuccio, Ji and Donfrancesco34). Similarly, a study in the UK found a north-south pattern of salt intake across Britain, and salt consumption was higher in Scotland than in England and Wales(Reference Ji, Kandala and Cappuccio36). High salt intake in districts located by the borders was lower than in other districts in Iran. The influence of cultures of neighbouring countries on diet habits, health beliefs and acculturation may have caused such differences(Reference Ghaddar, Brown and Pagán56,Reference Montoya, Salinas and Barroso57) . High salt intake was lower in districts alongside seas and oceans in this study. Other proposed explanations are consuming more fish and spicy food, which can potentially affect salt preference(Reference Rezaei, Mahmoudi and Sheidaei26,Reference Li, Cui and Jin58) .
According to high salt intake estimations in the present study, a higher prevalence of high salt intake in females with poor SES was discovered based on the calculated concentration index. This is in line with previous investigations on the impact of socio-economic variations on salt intake in different countries, which have shown higher salt intake in lower social classes of populations(Reference Cappuccio, Ji and Donfrancesco34,Reference Ji, Kandala and Cappuccio36,Reference Mazloomy Mahmoodabad, Tehrani and Gholian-Aval38) . Researchers believe this finding is mainly due to the salty, fatty, low-quality, processed and cheap food products used in low socio-economic groups(Reference Singh, Dubnov and Niaz59). In addition, low-quality bread is one of the main bases of diet in low socio-economic individuals. The bread produced with high percentages of salt is another interpretation of this issue(Reference Curic, Novotni and Skevin60). An investigation on 10 years of a national salt reduction initiative in Britain showed enduring social inequalities in salt intake even after the period of intervention(Reference Ji and Cappuccio35). To conquer social inequalities of high salt intake, the implementation of proper educational programmes based on health education models is needed(Reference Mazloomy Mahmoodabad, Tehrani and Gholian-Aval38).
To explore insight on salt consumption, we evaluated the self-report use of salt shaker at the last meal. We found a moderate correlation between the high prevalence of high salt intake and excess use of salt shaker at meals in estimations. These findings support the importance of having insight into the high salt intake and its potential role in lowering extra salt intake. A previous large-scale study found that a brief questionnaire of eating behaviours named Salt Check Sheet could successfully predict salt intake in participants compared to laboratory measurements(Reference Isaka, Moriyama and Kanda61). Improving knowledge, perceptions and attitude on outcomes of high salt intake is another major step in controlling this issue(Reference Kamran, Azadbakht and Sharifirad62). A study based on the theory of reasoned action revealed that attitude is the significant predictor of dietary habits, specifically high salt intake, and change in people’s attitude is essential in tackling this disaster(Reference Mazloomi, Motlagh and Morowati50).
In this study, a modelling method was used to estimate the prevalence of high salt intake in all districts of Iran. The estimated data could provide a precise vision for researchers and public health authorities to focus on areas with high salt intake more efficiently. The gold standard of salt intake measurement is Na excretion measurement in a 24-h urine sample(63). Alternative methods of urinary sodium estimation include random and timed spot urine samples. However, controversy remains on the validity of these methods, as various studies investigated the reliability of spot urine samples in estimating salt intake, and the results were not optimum(Reference Ji, Miller and Venezia64,Reference Ji, Sykes and Paul65) . Therefore, to assess Na intake in an Iranian population, a combination of spot urine samples and a semi-quantitative FFQ method was developed and successfully employed. This method showed promising features in salt intake estimation(Reference Mohammadifard, Khosravi and Esmaillzadeh66).
Bread is an essential energy source, protein and vitamins and is widely used as a basic part of the diet globally(Reference Eslamizad, Kobarfard and Tsitsimpikou67). Iranians are the second greatest consumers of bread – after Turkey – in the world, with an average daily bread consumption of about 320 g, summing up to nearly 117 kg per capita annually(Reference Aalipour Hafshajani, Mahdavi Hafshajani and Aalipour Hafshajani68,Reference Namayandeh, Lotfi and Jafari69) . This amount of bread consumption is about 5 times of European countries and six times of global average bread consumption(Reference Namayandeh, Lotfi and Jafari69). One of the important sources of salt intake in the Iranian diet is bread, as salt is widely applied in bread preparation(Reference Aalipour Hafshajani, Mahdavi Hafshajani and Aalipour Hafshajani68). The poor quality of bakery flour and lower protein content and gluten in flour are the major reasons for excessive use of salt in bread by bakers(Reference Aalipour Hafshajani, Mahdavi Hafshajani and Aalipour Hafshajani68,Reference Maghroun, Sajjadi and Sarhanghpour70) . So, bakers believe that adding salt helps to increase dough consistency and prevents the bread from sticking to surfaces(Reference Jafari, Mohammadi and Ghazizadeh71). The standard salt level in bread is suggested to be less than 1 g in 100 g bread(Reference Wyness, Butriss and Stanner72). Various studies in Iran investigated the amount of salt in different consumed bread in Iran. They revealed that the estimated salt amount in bread is 2–3 times higher than recommended levels, with this amount being higher in traditional bread than nontraditional types(Reference Aalipour Hafshajani, Mahdavi Hafshajani and Aalipour Hafshajani68–Reference Maghroun, Sajjadi and Sarhanghpour70,Reference Hadian, Feyzollahi and Honarvar73,Reference Zibaeinezhad, Houshangi and Abtahi74) . Different community trials found that salt reduction in bread to one-half or one-third is feasible and has no significant impact on the taste or quality of bread(Reference Jafari, Mohammadi and Ghazizadeh71,Reference Bolhuis, Temme and Koeman75) . An alternative approach to reduce salt intake via bread without negative effects on bread sales is replacing sodium chloride with other salts like K-based salts(Reference Quilez and Salas-Salvado76,Reference Quilez and Salas-Salvado77) . Also, the same consistency of dough can be provided by replacing excess salt with ascorbic acid(Reference Dagdelen and Gocmen78,Reference Sheikholeslami, Karimi and Komeili79) .
The global estimates of salt intake in 2010 indicated that bread intake was twice as recommended globally, and areas with higher levels were East Asia, Central Asia and Eastern Europe(Reference Powles, Fahimi and Micha37). To tackle this issue worldwide, the WHO set a 30 % relative reduction in mean population salt intake as a goal before 2025 in the previous decade(80). WHO also introduced the SHAKE technical package, which consists of measuring and monitoring salt use, promoting food reformulation with lesser salt, inventing effective labelling and marketing tools, education, knowledge promotion and providing an environment that supports healthy eating(81). Successful national plans started in countries like the United Kingdom and Finland leading to significant control of salt intake in these countries. Plans included urging food industries to add less salt to foods, labelling food products and elevating public knowledge on high salt intake hazards(Reference He and MacGregor7). The idea rising from the UK resulted in a global programme of World Action on Salt and Health, translating the UK’s strategies and helping countries alongside the WHO to control high rates of salt intake(Reference He, Jenner and Macgregor82). School-based educational programmes to reduce salt intake in students and their families (School-EduSalt) showed promising results, explicitly educating through social networks(Reference He, Wu and Feng83,Reference Ma, Feng and Ma84) . The efficacy of population-level interventions in reducing dietary salt intake, especially focusing on reducing salt in bread, was also approved through some distinguished reviews(Reference McLaren, Sumar and Barberio85,Reference Santos, Trieu and Raj86) .
Several community trials targeting high salt intake have been conducted in Iran. A reduction in high salt intake and blood pressure levels was achieved; however, larger studies at national levels are required(Reference Jafari, Mohammadi and Ghazizadeh71,Reference Khosravi, Kelishadi and Sarrafzadegan87,Reference Azadnajafabad, Saeedi Moghaddam and Mohammadi88) . Healthy Bread Initiative was a part of the Healthy Food for Healthy Communities project in Esfahan province in Iran that provided new bread with no bicarbonate, less salt and more bran. The project was designed to enhance the behaviour of both producers and consumers of bread and resulted in a successful intervention towards salt intake reduction(Reference Talaei, Mohammadifard and Khaje89). Food labelling as traffic light labelling started as a national programme in 2014 and has been ruled to be obligatory for the food industry since 2016 in Iran(Reference Azadnajafabad, Mohammadi and Aminorroaya4,Reference Zargaraan, Dinarvand and Hosseini90) . The efficacy and usefulness of food labelling have been studied and proved in Iran(Reference Mahdavi, Abdolahi and Mahdavi91). However, more direct education like face-to-face instructions would help to better understand and notice the food labels(Reference Esfandiari, Marasi and Estaki92,Reference Esfandiari, Mirlohi and Tanha93) . One survey investigated consumers’ negligence towards the use of food labels. Small sizes of information printed, lack of interest, uncertainty about information and failing to comprehend the labels were the main reasons for neglecting food labels in Iran(Reference Bazhan, Mirghotbi and Amiri94). Policy analysis also showed that poor media involvement in public awareness, incompatibility of colours on labels with standard guidelines, inconsistency of label with nature of the product and lack of monitoring plans were the major obstacles against food labelling policies(Reference Edalati, Omidvar and Haghighian Roudsari95).
A successful national programme of salt intake reduction is comprised of four main steps: accurate estimation of the level of salt intake among all population as the first step, setting time-limited targets for salt intake by the population as the second step, developing and implementing interventions to reduce salt intake as the third step, and finally, monitoring and evaluation of the implemented programmes and making essential adjustments as the fourth step(Reference Fahimi and Pharoah5). In the process of designing and applying policies, there are four main target groups needed to be handled: decision-makers (policymakers and executive units), beneficiaries (general population, high-risk groups and medical staff), partners defined as anyone who can be involved in the process like media and religious authorities and potential oppositions (like food producers and providers)(Reference Mohammadifard, Fahimi and Khosravi32). Mandatory regulations and reformulations are undeniable parts of policies to reduce salt in food product preparations by food industries(Reference Gillespie, Allen and Guzman-Castillo96). Policies may face numerous barriers during the implementation process, but evidence-based solutions are ready to overcome them(Reference Appel, Angell and Cobb97).
The limitations of this work are mainly complex modelling methods and possible statistical errors during estimations. Nevertheless, this is the first district-based study of salt intake in all Iran districts, which is the greatest strength of this work. Other limitations could be probable mistakes in salt intake measurements of included participants that was used as the base data for the modelling, which is out of the scope of this study as no new measurements were made for modelling. The lack of data on each age group of the population and area of residency is another limitation. Instead, age-standardised data were estimated to make the comparison between districts possible.
Conclusion
Regarding high salt intake in almost all districts of Iran, proper legislation and action plans are needed to stop this trend. Spatial variations of salt intake estimated in this study provide a beneficial measure for national and sub-national authorities and policymakers to handle this great public health issue in Iran.
Acknowledgements
Acknowledgements: The authors would like to thank all the participants, researchers and staff of medical universities and Ministry of Health and Medical Education of Iran, which helped conducting the Iran STEPs 2016 survey. Also, we appreciate the aid of all colleagues in Non-communicable Diseases Research Center (NCDRC), and Endocrinology and Metabolism Research Institute, in Tehran University of Medical Sciences. Financial support: This research was funded by Iran’s Ministry of Health and Medical Education with the grant No. 1372. Conflict of interest: There are no conflicts of interest. Authorship: F.F. designed and conceptualised the study. S.A. interpreted the data and prepared the first manuscript. S.A., E.M. and A.A. did the literature search and review. E.G., A.G. and M.M. developed the small area estimation modelling codes and provided the results of modelling. N.E., S.A. and S.S.M. did the statistical analysis and visualisation. N.R., S.M.F., R.H. and F.G. had administrative support of the survey. A.K. and A.D.M. provided the data and had technical support. F.F., S.A., N.E., E.M., S.S.M., A.A. and N.R. critically revised the manuscript. All authors thoroughly read the final manuscript and approved the ultimate content and data. F.F. was the corresponding author and chief investigator of the study and supervised all stages of the survey. Ethics of human subject participation: This study was conducted according to the guidelines laid down in the Declaration of Helsinki, and all procedures involving research study participants were approved by the ethical committee of Endocrinology and Metabolism Research Institute of Tehran University of Medical Sciences, under code IR.TUMS.EMRI.REC.1397.026. Verbal informed consent was obtained from all subjects/patients in the base study, Iran STEPs 2016 survey. Verbal consent was witnessed and formally recorded.
Supplementary material
For supplementary material accompanying this paper visit https://doi.org/10.1017/S1368980021002986


