INTRODUCTION
The most reported bacterial sexually transmitted infection (STI) in The Netherlands is Chlamydia trachomatis (chlamydia) [Reference Vriend1]. The prevalence in 2006 in The Netherlands was estimated at 60 000 cases, of which 36 000 were detected in primary-care and STI centres, the others remained undetected [Reference Vriend1–Reference Van Bergen4]. Chlamydia is more prevalent in certain groups, e.g. in young persons and migrant populations. A chlamydia infection is often asymptomatic, but untreated can persist for more than a year [Reference Vriend1, Reference Morré5–Reference Fenton7]. The infection may spread to higher reproductive organs, in women causing pelvic inflammatory disease (PID) with serious sequelae like ectopic pregnancy and tubal infertility, and in men causing epididymitis [Reference Peipert8–Reference Haggerty10]. A chlamydia infection during pregnancy may also lead to preterm delivery and eye infections in newborn [Reference Rours11, Reference Rours12].
Previous research showed that acquiring infection was related to sociodemographic factors [age, sex, socioeconomic status (SES)] and sexual behaviour (number of sexual partners, condom use, sexual preference) [Reference Low, Sterne and Barlow6, Reference Van Veen, Koedijk and Van der Sande13–Reference Hogben and Leichliter15]. STI prevalence is also known to vary by ethnicity [Reference Morré5–Reference Fenton7, Reference Götz16]. In The Netherlands, different ethnic groups have been identified as high-risk groups eligible for STI screening in the STI centres, mainly because of previous reported high prevalence rates in these groups [Reference Van de Laar and Op de Coul17, 18]. In the STI centres it was assumed that asking visitors for their self-defined ethnicity was the most appropriate way of identifying this high-risk population, because it would reflect an individual's cultural background better. Apart from self-definition, there are other ways to describe ethnicity, for example by historical ancestry, race or country of birth. These latter are more objective, but might not reflect personal identity. We assessed ethnic disparities in chlamydia positivity comparing two different definitions of ethnicity: self-defined ethnicity and ethnicity based on country of birth.
METHODS
Design and participants
Data were derived from two sources: young persons in the national STI surveillance in Dutch STI centres in 2009 and participants in the first round of the Chlamydia Screening Implementation (CSI, 2008–2009).
The Dutch STI centres offer low threshold, free-of-cost, anonymous STI care targeted at high-risk groups [18]. One of the risk-defining criteria is self-assignment to an ethnic group from Africa, Latin America, the Caribbean, Asia or Eastern Europe [18]. All visitors are offered routine testing for STI, including chlamydia. The test outcomes and visitor characteristics are anonymously reported to the National Institute for Public Health and the Environment (RIVM), for surveillance purposes. Ethnicity is inquired upon by asking for self-reported ethnicity (mandatory) and country of birth of the visitor and his/her parents (voluntary) by using pre-designated answering categories (countries). The data does not allow identification of repeated visits by the same individual.
Persons were excluded from analysis if no information on their country of birth was available. In 40% of all persons attending STI centres aged 16–29 years (N=55 975), country of birth of the person and his parents (voluntary question) and self-reported ethnicity (mandatory) were registered. Seven of 27 STI centres had not reported ethnicity by either definition in more than 80% of their visitors.
Surveillance data from national STI centres reflect only a part of the population: the centres provide free care to higher-risk groups, but many persons visit other healthcare providers, like general practitioners, or, due to the asymptomatic character of the disease, none at all [Reference Van den Broek2, Reference Van Bergen19]. CSI invites all sexually active 16- to 29-year-old persons from Amsterdam, Rotterdam and South Limburg annually to participate in an internet-based screening programme for chlamydia [Reference Van den Broek20].
In CSI, participants are requested to voluntarily complete a questionnaire and send in a vaginal swab or urinary sample for chlamydia testing. Ethnicity is recorded as the self-defined ethnicity of the participants (questionnaire) and by country of birth of the participants and their parents (municipal registry). Individuals from South Limburg are invited to participate only when meeting certain risk criteria, including ethnic background. Because of this selection bias, participants from South Limburg were excluded from this study. Exclusion also took place when participants had not completed the questionnaire or if their ethnicity was unknown. In CSI, ethnicity was known for 64% of the persons eligible for inclusion (N=40 365). Informed consent for the use of the data was given by all participants. More detailed descriptions of the CSI study design and population are published elsewhere [Reference Van Bergen3, Reference Van Bergen21].
Definitions
The ethnic background of the participants was assessed by two definitions: self-defined ethnicity and country of origin, based on the country of birth as determined by the method of Statistics Netherlands [22]. Self-defined ethnicity was based on the question ‘To which ethnic group do you assign yourself?’ The country of origin is based on the country of birth of the participant and his/her parents: a person with both parents born in The Netherlands is considered native Dutch. A first-generation immigrant is born abroad, with at least one parent also born abroad. The country of origin of a first-generation immigrant is determined by his/her country of birth. Second-generation immigrants are born in The Netherlands, but have at least one parent who is a first-generation immigrant. For second-generation immigrants, the country of origin is the country where the mother was born, unless this is The Netherlands; in that case the country of origin is the father's country of birth [22, Reference Alders23].
Status scores, based on postal code areas, as computed by The Netherlands Institute for Social Research were used as a proxy for an individual's SES. The status score is a ranking score, based on the average income per household and the percentages of households with low income, without a paid job and the percentage of households with a low educational level [24].
Data analysis
To determine agreement between the two definitions of ethnicity, an inter-rater reliability analysis was performed using the kappa statistic. To test the reliability of self-defined ethnicity as a variable, data from the subsequent year of CSI have been used to assess to what extent people give consistent answers about their self-defined ethnicity.
The association between ethnic background and the outcome measure chlamydia infection was assessed by χ2 test (α=0·05) and by univariate and multivariate binary logistic regression analyses, corrected for variations in age, gender and SES. Behavioural factors were not adjusted for in the multivariate models, as they were considered to be an integral part of the differences between ethnic groups.
Participants with missing values were excluded from the analyses for that particular variable. To compare the different definitions of ethnicity, comparisons in log likelihood were made. Data were analysed using PASW Statistics 18 (Release 18.02, IBM Corporation, USA).
RESULTS
Study population
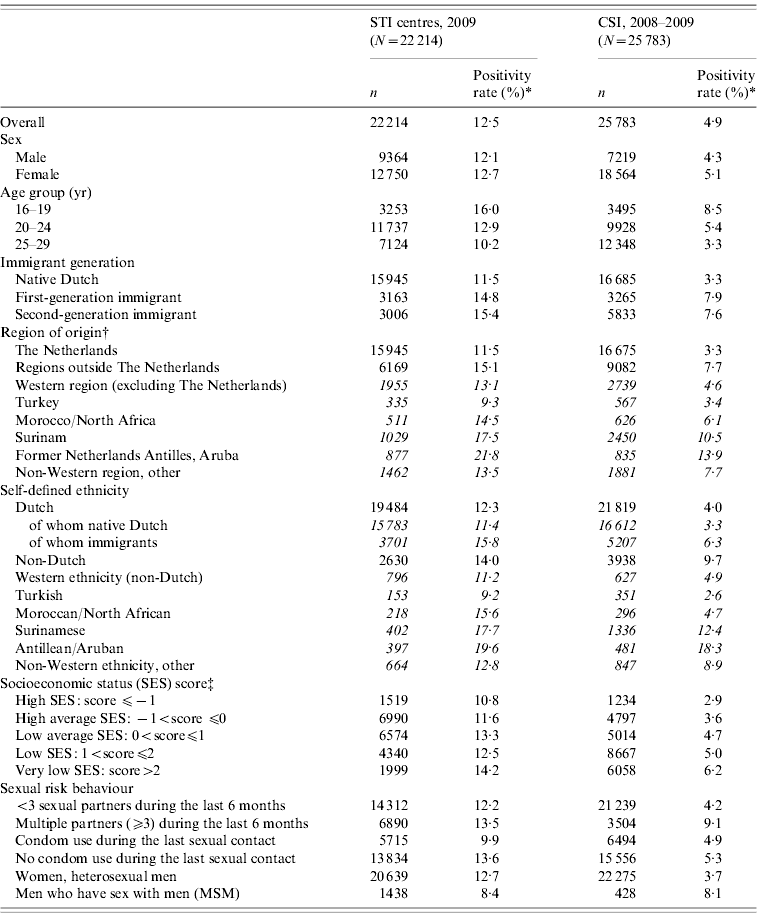
The basic characteristics of both study populations are shown in Table 1. CSI participants were significantly more often females, and more often living in areas with a lower SES compared to the STI centres, while the STI centres were visited by a significantly higher percentage of men who have sex with men (MSM) and persons who reported more than three sexual partners in the last 6 months. Compared to the STI centres, a relatively high number of people of Surinamese origin participated in CSI (all P<0·001).
Table 1. Population characteristics and positivity rates in Dutch STI centres (2009) and in CSI (2008–2009)

* Positivity rate: number of positive test outcomes as a percentage of the amount of tests done.
† Using the definitions of Statistics Netherlands, countries of origin were grouped into two regions, i.e. Western and non-Western. The latter were subdivided to the major ethnic minority groups in The Netherlands: Turkey, Morocco, Surinam and the former Netherlands Antilles and Aruba [25, 26].
‡ The socioeconomic status (SES) score is a proxy for individual SES, based on the SES of the postal code area [25].
In the STI centres, the positivity rates for chlamydia did not differ significantly between the persons included in the study and persons who were excluded because either one of the ethnicity variables (predominantly country of origin) was missing. Persons in CSI that were excluded from these analyses, tested positive for chlamydia significantly less often.
Agreement between measures of ethnicity
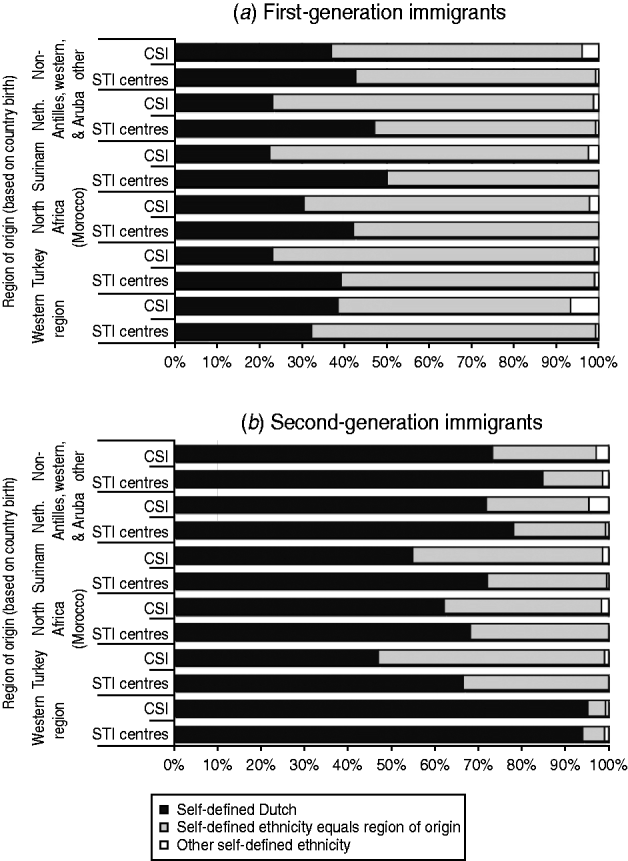
In the CSI and STI centres, respectively, 100% and 99% of the native Dutch identified themselves as Dutch. As shown in Figure 1, this was different for immigrants, where the self-identified ethnicity of a person often did not correspond to their region of origin. About a third of the first-generation immigrants, and three-quarters of the second-generation immigrants identified themselves as Dutch. This discordance between self-identified ethnicity and ethnicity by country of origin was more pronounced in second-generation Western immigrants, and less strongly present in second-generation immigrants from Turkey, North Africa and Surinam.

Fig. 1. Self-defined ethnicity in (a) first-generation and (b) second-generation immigrants in The Netherlands. Data from Dutch STI centres (2009) and CSI (2008–2009).
The inter-rater agreement statistic kappa for the two definitions used to classify the population into Dutch and non-Dutch ethnicity was found to be 0·48 in CSI and 0·47 in STI centres (both P<0·001), indicating moderate agreement between the two definitions [Reference Landis and Koch27].
A small part (19%) of the participants in the first year of the CSI programme also participated in the subsequent year and defined their own ethnicity in both years (N=4643). With a similarity close to 100%, native Dutch were very consistent in their answers. The majority of the immigrant population gave the same answer twice. However 15% (n=253) of the immigrants gave a different response the second time, changing it from Dutch to non-Dutch (40%) or vice versa (51%). Nine percent changed from one non-Dutch ethnic group to another.
Positivity rates
Overall, 13% of the 16- to 29-year-old visitors to the STI centres and 5% of the participants in CSI tested positive for chlamydia. The positivity rates differed significantly (P<0·001) between ethnic groups (Table 1), and also for the two definitions used.
In the STI centres, 15% of the immigrants, as defined by country of origin, tested positive for chlamydia, compared to 14% of the self-defined non-Dutch. In CSI, 8% of participating immigrants (defined by country of origin) tested positive for chlamydia, against 10% of the self-defined non-Dutch, as shown in Table 1.
In CSI and STI centres, immigrants defining themselves as Dutch tested positive more often than native Dutch. Positivity rates did not differ significantly between first- and second-generation immigrants.
Regression analysis
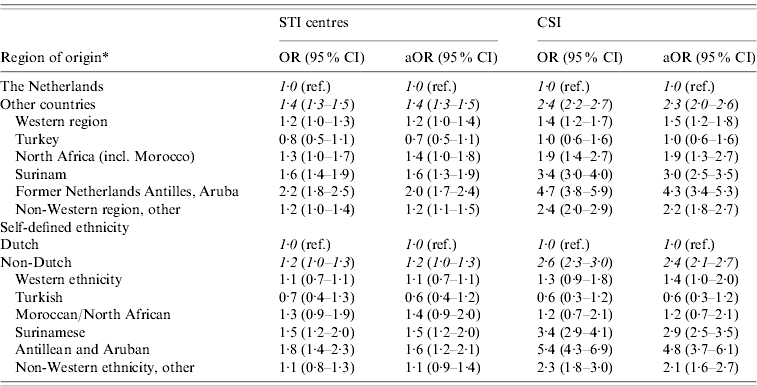
In univariate analyses foreign origin was, regardless of the definition, associated with a higher risk of chlamydia positivity, as shown in Table 2. Adjusting for confounders age, sex and SES did not change the odds ratio significantly for either definition of ethnicity, but contributed to a better data fit.
Table 2. Odds ratios for chlamydia positivity for different ethnic backgrounds in STI centres (2009) and CSI (2008–2009)

* Based on country of birth, definition according to Statistics Netherlands.
OR, Odds ratio; aOR, odds ratio adjusted for age, sex, socioeconomic status; CI, confidence interval.
First- and second-generation immigrants, as defined by country of origin, were found to be at higher risk for chlamydia infection in CSI and STI centres. Ethnic disparities were larger in CSI [adjusted odds ratio (aOR) 2·3, 95% confidence interval (CI) 2·2–2·7] than in STI centres (aOR 1·4, 95% CI 1·3–1·5]).
The highest OR for chlamydia was, both in the STI centres and CSI, found in persons originating from the former Netherlands Antilles and Aruba (STI centres: aOR 2.0; CSI: aOR 4.3) and Surinam (STI centres: aOR 1.6; CSI: aOR 3.0).
Originating from the region North Africa (mainly Morocco) and Turkey was not associated with a significantly increased risk for chlamydia in STI centres. In CSI people originating from Turkey also did not have a significantly higher risk for chlamydia infection than native Dutch, but people originating from Morocco did.
Despite the different classification of the population, the odds ratios for chlamydia positivity were similar for self-defined ethnicity and ethnicity based on country of origin, in both STI centres and CSI, as shown in Table 2. However, comparison of the log likelihood of the adjusted models showed that in STI centres and CSI, region of origin (based on country of birth) explained the variation in chlamydia positivity better than self-defined ethnicity (data not shown).
DISCUSSION
This study showed that both self-defined ethnicity and ethnicity based on the country of birth can be used to identify young persons at higher risk for chlamydia infection. Defining ethnicity by country of origin better explained the risk of chlamydia than self-defined ethnicity, whereas self-defined ethnicity disregarded a large part of the young population at higher risk for chlamydia. Ethnicity based on country of origin, based on the country of birth, has also other advantages: it is a more objective classification, and in contrast to self-defined ethnicity, remains consistent over time, making it eligible for a role in health policy and action.
This study combined population-based screening data from CSI with clinical data from STI centres, showing that the association between chlamydia and ethnicity changes with the setting. As the young persons in STI centres are a selfselected population and on top of that triaged [18] to be at higher risk for STI, it is not surprising that the attributable risk of ethnicity is smaller in STI centres than in the young population represented in CSI.
Context
The underlying aetiological mechanisms causing the differences and similarities between ethnic groups were not the focus of this study. Including behavioural variables in the model, such as condom use in the last sexual contact, having more than two different partners in the past 6 months, and sexual preference (MSM), only slightly changed the odds ratios for the different ethnic groups (data not shown). Previous research indicated that possible causes of differences in HIV prevalence between certain immigrant groups and native Dutch could lie in other behavioural aspects, like sexual mixing patterns [Reference Van Veen28–Reference Kramer31]. These factors may also be explanatory for some associations found for chlamydia.
Previous research concerning STI/HIV in Dutch immigrants has focused on HIV transmission in immigrants from countries with a high HIV prevalence. In contrast, this study focused on chlamydia, known to be highly prevalent in Western countries. Similar to previous studies [Reference Morré5, Reference Low, Sterne and Barlow6], we found higher chlamydia positivity rates in persons of Caribbean descent, thereby confirming these higher risk groups in our population of young persons.
The dissimilarity between self-defined ethnicity and ethnicity by country of origin has also been found in other studies, where respectively, 50% and 20% of first-generation and 95% and 50% of second-generation Western and Turkish/Moroccan immigrants referred to themselves as Dutch [Reference Van der Vliet, Ooijevaar and Boerdam32, Reference Stronks, Kulu-Glasgow and Agyemang33]. Another study found 76–99% of the interviewed first-generation Surinamese, Turkish and Moroccan immigrants identified themselves as Dutch [Reference Sliman and Jouannic34].
Limitations
The study population was a selection of all persons tested at the STI centres and in CSI, which may have created a bias. Eight out of 27 Dutch STI centres did not report data on the country of origin for over 80% of their visitors. This underreporting was independent of ethnic background, and is therefore unlikely to have biased our data. In CSI, the questionnaires were completed by 64% of the participants, more often by Dutch than non-Dutch (67% vs. 59%).
At the STI centres, self-defined ethnicity was inquired upon by healthcare workers. It can not be excluded that some healthcare workers occasionally registered ethnicity based on external characteristics rather than the clients' definition. Although it is unclear if and to what extent this occurred, it is, however, likely that this caused more people to be allocated a ‘self-defined’ non-Dutch ethnicity.
Another limitation in the data on ethnicity in this study is that pre-designated answer categories for self-defined ethnicity were used, not allowing expression of mixed or multiple group affiliation, or naming groups that were not listed. This categorization assumes homogeneity within the ethnic groups, which is not by definition present.
CONCLUSIONS
Using different definitions of ethnicity, this study described the association between ethnic background and chlamydia prevalence in young persons in The Netherlands in two different settings. Ethnic background was found to be a stronger attributive factor for chlamydia risk in a population screening (CSI) than in STI centres. This risk, associated with first- and second-generation immigrants, should be recognized and have a place in preventive and screening strategies. It confirms the epidemiological basis of recognizing immigrants as high-risk groups.
For application in clinical practice it is important to know that both definitions of ethnicity are useful to identify populations at a higher risk for chlamydia. However, basing ethnicity on the country of birth assists in making a more objective, reliable judgement and prevents exclusion of immigrants that describe themselves as Dutch, but who still are at increased risk of chlamydia.
APPENDIX
Chlamydia Screening Implementation (CSI) Group
J. E. A. M. Van Bergen1, I. V. F. Van Den Broek2, E. E. H. G. Brouwers3, J. S. A. Fennema4, H. M. Götz5, C. J. P. A. Hoebe3, R. H. Koekenbier4, E. L. M. Op De Coul2, L. Pars1, S. M. Van Ravesteijn3.
(1 STI AIDS Netherlands, Amsterdam, The Netherlands; 2 Centre for Infectious Disease Control, Epidemiology and Surveillance Unit, National Institute for Public Health and the Environment (RIVM), Bilthoven, The Netherlands; 3 Department of Infectious Diseases, South Limburg Public Health Service, Geleen, The Netherlands; 4 Cluster of Infectious Diseases, Department of Research, Online Research and Prevention Unit, Amsterdam Health Service, Amsterdam, The Netherlands; 5 Division Infectious Disease Control, Rotterdam-Rijnmond Public Health Service, Rotterdam, The Netherlands).
ACKNOWLEDGEMENTS
The authors thank the Dutch STI centres and the CSI collaborators for their contribution in the data collection.
DECLARATION OF INTEREST
None.


