


Introduction
It snows very heavily in areas facing the Sea of Japan, and disasters are often caused by snow avalanches. Hardware measures, including avalanche prevention structures or protective structures, have been provided for these areas and, in addition, snow avalanche hazard area maps are being prepared. In Japan, Takahashi's rule of thumb, which assumes that the line-of-sight angle at the starting point of an avalanche, viewed from its runout point, is less than 18° for surface-layer avalanches, and less than 24° for full-depth avalanches, is normally used to determine maximum avalanche runout distance. However, it is possible that extensive areas will erroneously be deemed as hazardous using this method. Therefore, we first analyzed the relationship between the topography of sites where avalanches have occurred and the runout point of those avalanches, to obtain a new method of determining the avalanche runout distance. From this, we have developed trial avalanche-hazard maps. We first approximated the longitudinal profiles with quadratic curves. Then, we obtained recession formulae using topographic data obtained from the curves as the explanatory variable and the angle between the starting and runout points of avalanches as the criterion variable. This model has been prepared referring to the model previously proposed (Lied and Bakkehøi, Reference Lied and Bakkehøi1980; Bakkehøi and others, Reference Bakkehøi, Domaas and Lied1983).
Methods of Analyses
The Data Used
The Japanese government has never investigated avalanche records of disasters that struck hamlets. In 1985 the Ministry of Construction started a project to protect hamlets from snow avalanches and it became necessary to investigate runout distances from avalanche records kept by local governments. Records collected from 1974–86 for 96 avalanches included 66 which indicated starting points, runout points and avalanche courses on topographic map scales of 1:5000 or more. The 66 samples used in analyses included 8 collected from Tohoku (Northeast) District, 7 from Nagano Prefecture, 44 from Niigata Prefecture, and 7 from other snowy areas of Japan. Since our data were collected over 12 years using actual avalanche deposits, there is almost no information on return periods in our data set; in fact, some data were from the same avalanche paths. All data analyzed were obtained from topographic maps.
Analytical Procedures
Analyses were made in accordance with the geometry shown in Figure 1 to obtain equations that can estimate the runout point of avalanches, based on regression analyses made with various explanatory variables

Fig. 1. Longitudinal profiles and topographie factors used in analyses.
obtained from quadratic curves and approximated from longitudinal profiles and the angle of the line connecting the runout and starting points of avalanches. In addition, we tried to rank hazardous areas to different degrees, using the following procedures.
Collect data.
Develop quadratic approximate equations to longitudinal profiles.
Obtain various explanatory variables.
Select variables to be applied for regression equations.
Develop regression equations for criteria variables and explanatory variables.
Summarize the concept of obtaining the risk from regression equations.
Develop avalanche-hazard map of model area.
Topographic Features Used in Analyses
The following factors have been obtained, based on starting and runout points, by approximating longitudinal profiles with quadratic curves (Fig. 1). We also define:
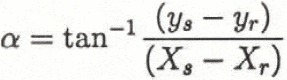
α angle on the line connecting starting and runout point;
β angle betwen starting point and point where the gradient of approximate quadratic curve becomes 10°;
θ, slope;
y″, curvature of parabola; and
H, difference of elevation between the starting point and the vertex of the parabola.
Results of Analyses
Determining Curves of Longitudinal Profiles and Various Factors
The approximate quadratic curves were made with the changing point of the gradient collected from longitudinal profiles of avalanche courses. By reading coordinates at both the starting and runout points of snow avalanches, various factors and data to be used in analyses were obtained. First, the x-y coordinates were established by reading points where the profiles change. Secondly, using the data read at the gradient changing points of the longitudinal profile, the following quadratic equation was obtained:
Finally, these factors were obtained from the coordinates at the starting and runout points, and from the quadratic equations shown below:
and
where 10 represents the 10° point and H is ys − yv where υ represents the vertex of the parabola. Then
Figure 2 is an example of quadratic equations that have approximated terrain. In this sample terrain is represented well by the quadratic curve and the quadratic equation has a high correlation coefficient, including values higher than 0.97. There are some examples with large changes in gradient along the avalanche path, and for these the quadratic equations had lower correlation coefficients.
Data relating to avalanche conditions, slope length, information on damaged houses, approximate quadratic equations and various explanatory factors, obtained from 66 samples by the methods described above, can be obtained from the authors.

Fig. 2. Longitudinal profile of avalanche course and approximate quadratic curve.
Correlation Between Variables
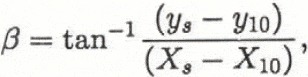
The averages of five factors and the standard deviation of the basic data are shown in Table 1. Table 2 shows correlation coefficients between criteria variable α and various explanatory variables. The correlation coefficient between α and each explanatory variable is at least 0.3, showing that β gives the highest correlation with α. The correlation coefficient between explanatory variables is at most 0.6.
Table 1. Basic statistic offive factors
Table 2. Various correlation coefficients

Categorizing Conditions
Particular conditions were assumed to affect the runout points of avalanches. An avalanche will finally stop due to may kinds of resistance forces, consequently α has much to do with these forces. For example, the longitudinal profile of an avalanche course striking against such artificial structures as houses affects α. The greater the avalanche volume, the smaller the value of α becomes. Therefore, avalanche volume could be supposed to affect α. However, because data on avalanche volume are of doubtful accuracy, the connection between avalanche length and α was analyzed. As the avalanche flows down, its scale increases gradually. A slope of some length is required in order for an avalanche to develop completely. Thus, slope length could be supposed to affect α.
Taking into consideration the above points, formulae for estimating α have been obtained based on the different conditions provided below:
Using all data.
Topographic quadratic equation correlation coefficient (> or < 0.97).
Whether or not avalanches strike houses. Length of snow avalanche ( > or < 500 m). Length of slope (> or < 100 m).
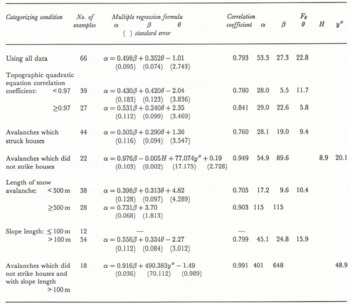
Table 3 shows the results of multiple regression analyses (McClung and Lied, Reference McClung and Lied1987; Mears, Reference Mears1988) and shows F (the F-statistic) and the correlation coefficient (t-statistic). There is a high correlation between the estimated value of α for avalanches which did not strike houses with slope length 100 m or more and actual values (see Fig. 3).

Fig. 3. Relationship between estimated and actual values of α (data for avalanches with slope length more than 100 m which did not strike houses).
Table 3. Results of multiple regression analyses
Ranking Risk of Avalanches by Statistical Methods
To rank the avalanche data on topographic maps, we established the boundary of risk based on the formula estimating α, using all available data, without giving specific conditone as described above. The boundary of risk was established by a method of statistical significance to obtain the confidence limit of estimated values, based on differences between estimated values of α and actual values.
Verifying by Confidence Interval
Differences in estimating criterion variables will become the “t” distribution. The confidence limit line for estimated values by regression formulae using all data and actual values are as shown in Figure 4. Generally, confidence limit lines are curved except when the confidence limit line which indicates 50% is a straight Une. Figure 5 shows the differences between confidence interval 10% and 25%, 50% and 10%, 50% and 2.5%. These differences become bigger as estimated α departs from the average value of estimated α. When confidence limit lines are replaced with straight lines, the differences between a confidence limit line and its straight line is 0.2° even when the confidence interval is 2.5%. Therefore, for avalanche-hazard maps, there is no loss in acccuracy when confidence limit lines are replaced with straight lines.

Fig. 4. Confidence limit line of estimated a and actual α.

Fig. 5. Differences between confidence interval 50% and 25%, 50% and 10%, 50% and 2.5%.
Establishing Boundary of Risk
Figure 6 explains the differences between estimated α and actual α at the point of average value of estimated α shown in Figure 4. We tentatively established four ranking categories, A-D, delimited by: m − 2σ, the boundary between “nearly safe” (D) and “slight danger” (C); m − σ, the boundary between C and “danger” (B); and m, the boundary between B and “extreme danger” (A). Since confidence limit lines replace straight lines, it is as easy to calculate the boundaries of risk α − σ and α − 2σ as it is to calculate values of α.

Fig. 6. Established risk ranking (example).
Application to Actual Terrain
Methods of Obtaining Runout-point Coordinates of Avalanches from Various Factors
Reading the points of gradient changes in longitudinal profiles of avalanche tracks and starting points of avalanches from topographic maps, quadratic equations and explanatory factors were determined and boundary lines of risk areas were obtained as shown below.
The straight line between the starting and runout points of avalanches can be expressed as
The intersection of this line and the approximate quadratic curve of the terrain can be obtained by the following simultaneous equations:

and
Developing Avalanche-Hazard Maps
The above methods were applied to topographic maps for Mogurasawa, Yunotani-mura and Niigata Prefecture (Fig. 7). Fifteen possible avalanche courses were established on slopes north and south of the rural area, and coordinates at hazardous points were obtained based on the above approximate equations and the coordinates at actual points of avalanches. It can be seen that the risk increases nearer to the slopes. The rural areas were ranked B (“danger”) or C (“slight danger”).

Fig. 7. Avalanche-hazard maps (examples).
Application to Avalanche Prevention and Problems to be Resolved
When we show the runout distance of an avalanche on one slope, if we have avalanche records for about 100 years, it is possible to estimate the runout distance statistically. For example, avalanches might reach the hamlet once in 2 years or once in 10 years. But there are not many long-term avalanche records that indicate the starting point and the runout point. As it is impossible to make avalanche-hazard maps in this way, another way of obtaining runout distance was researched. This estimating method for runout distance is almost the same as the one which was developed by the Norwegian Geotechnical Institute, except for the way of calculating β and θ. The difference is that we researched the runout distance from records of avalanches which damaged or were supposed to have damaged a hamlet, but NGI researched the maximum runout distance from records when the return period was about 100 years. Because the return periods of snow avalanches were ignored, the correlation coefficient of the regresion formula is less than that of NGI. One reason for this result is that the hamlets are spread over areas for which the return period of snow avalanches varies. Therefore, we classify runout distances into four categories by using the statistical method of regression formula. We think this method is suitable for making hazard maps, especially in areas which have few avalanche records. There are still problems that must be resolved before these methods are actually applied, because the “nearly safe” range falls below 10° when the value of α is small in large-scale avalanches. Further statistical analyses on causes of avalanches must be made based on comprehensive reviews of site orientation and deformation and distance of contour lines in order to determine automatically and objectively the courses of avalanches. Future analyses must take into consideration various characteristics, including the vegetation on avalanche courses and snow quality, to establish more practical assessments of avalanche risks.


