


Introduction
Glacial lineations, such as drumlins and flutings, are one of the most important tools for reconstructing former ice-sheet flow patterns (e.g. Reference Boulton, Smith, Jones and NewsomeBoulton and others, 1985; Reference Dyke and PrestDyke and Prest, 1987; Reference Boulton and ClarkBoulton and Clark, 1990a, Reference Boulton and Clarkb; Reference Kleman, Hattestrand, Borgstrom and StroevenKleman and others, 1997). By using information on the relative age in cross-cutting lineation swarms, glacial flow patterns from earlier (pre-deglaciation) ice-sheet configurations can also be inferred. Small-scale maps of glacial lineations that are used in such reconstructions, are nearly always generalized. That is, the symbols used do not represent the size and orientation of individual landforms, but are rather a representation of the general direction of a group of lineations, and mostly without respect to their size (e.g. Reference Prest, Grant and RamptonPrest and others, 1968).
A few studies have addressed wet-based ice-flow interaction with and reshaping of pre-existing glacial landscapes of different properties. Reference Boulton, Menzies and RoseBoulton (1987) suggested that drumlins can be reshaped into ribbed (Rogen) moraine if overrun and partially destroyed by ice flow at a high angle to the original ridge orientation. Reference LagerbackLagerback and Robertsson (1988) and Reference ClarkClark (1993) have, by using examples from Fennoscandian and Canadian glacial geomorphology, shown another way of drumlin reshaping, where large pre-existing drumlins become more and more dissected and replaced by newly created small drumlins until final destruction. However, the orientation of the original landform is inherited as the new drumlins are placed in a string aligned with the former ice flow. Reference Knight and McCabeKnight and McCabe (1997) also argued that barchan-shaped drumlins, found in Ireland and Keewatin, Canada, are formed when older lineations are cross-cut and reshaped by subsequent ice flow at a low angle.
Most of these studies have been at a landform scale rather than at a landscape or lineation swarm scale. Therefore, one of the primary aims of this study has been to map individual glacial lineations at a regional scale, in order to examine the variability and patterns of size distributions in different lineation swarms. An important question we address is: What can the physical parameters of cross-cutting lineation swarms tell about the mode and formation-time length of the different landform-creating events?
Northern Sweden is chosen as a study area (Fig. 1a and b) because of the availability of extensive cross-cutting drumlin swarms of widely different age. In addition, the general glacial history during the last glacial cycle of the area is relatively well-known through a large number of stratigraphical and geomorphological studies.
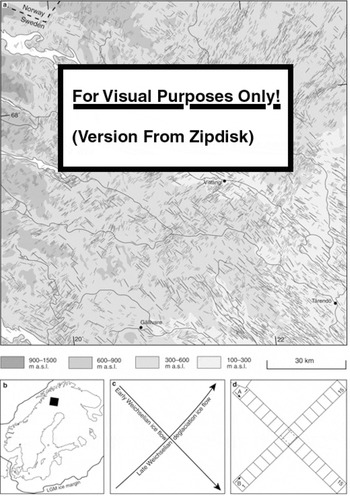
Fig. 1. (a) Till lineations divided by age (older – blue, younger – red) and size (small, medium, large) attributes, (b) Location map. (c) General ice-flow patterns. (d) Location of transects A and B in Figure 4.
Physical Setting
The topography of most of the study area is characterized by plains (200–500 m a.s.l.) with residual hills (100-200 m high; Fig. 1a). The westernmost part borders the premontane region of the Scandinavian mountain range, with broad mountain plateaux around 800 m a.s.l. The highest peaks (in the northwest) reach 1200 m a.s.l. The residual hills in the central and eastern parts often constitute the proximal parts of large crag-and-tail ridges (Fig. 2).

Fig. 2. Aerial photograph of lineations at Sjaunja, about 20 km west-southwest of Gallivare. The large-scale crag- and-tail ridges in centre were formed by an early Weichselian ice flow from the northwest. Small SW lineations are located in the northwestern part of the photograph. North at top.
The glacial history of northern Sweden is relatively well- known and both sediments and glacial-geomorphic elements from several glacial phases have been recorded (Fig. 1c; Reference FagerlindFagerlind, 1981; Nordkalott project, 1986a, b; Lagerbäck, 1988; Reference LagerbackLagerback and Robertsson, 1988; Reference KlemanKleman, 1992; Reference HattestrandHattestrand, 1998). The oldest glacial landform set (drumlins, eskers, Veiki moraine, end moraines, meltwater channels) document an ice-flow direction from the northwest and tentatively has been assigned to the first early Weichselian stadial (Marine Isotope Stage [MIS] 5d; Reference LagerbackLagerback and Robertsson, 1988). However, Reference HattestrandHättestrand (1998) has suggested that many of the large northwest-oriented drumlins may derive from even earlier ice-flow events. Overprinted on this flow system is a set of drumlins, ribbed moraines, eskers and meltwater channels indicating an ice flow from the southwest. This later flow system was formed during the last deglaciation (MIS 2/1; LagerbäReference Lagerbackck and Robertsson, 1988). Within the central zone of enhanced ice flow from the southwest (Fig. 1), there is generally a 1–5 m layer of late-Weichselian till, whereas on either side of this zone the late-Weichselian till thickness is only 0–1m (Nordkalott project, 1986d). These two ice-flow systems completely dominate the glacial geomorphology of the study area, although there are a few traces of additional intermediate ice-flow events (LagerbäReference Lagerbackck and Robertsson, 1988; Reference KlemanKleman, 1992; Reference HattestrandHättestrand, 1998). However, the general scarcity of landforms and sediments from intervening glacial events suggests the area was covered by cold-based ice during most of the main Weichselian glaciation (LagerbäReference Lagerbackck and Robertsson, 1988; Reference Kleman, Hattestrand, Borgstrom and StroevenKleman and others, 1997, Reference Kleman, Hattestrand and Clarhall1999; Reference HattestrandHättestrand, 1997, 1998).
Methods
The data collection was conducted by interpretation of black and white aerial photographs at the scale of 1: 150 000. The potential geometric resolution of these photographs is about 4 m and, by using a Zeiss Jena Inter-pretoscope with 2-16x magnification, small-scale lineations (fluting) could be detected. To ensure data integrity, especially concerning the size attributes, all lineations were mapped twice. First, the lineations were mapped by their orientation. After the production of a complete picture of the size variations, the whole area was mapped a second time and each lineation was given a size attribute (small, medium or large).
The till lineations in Figures 1 and 3 are classified according to their direction (age) and size. At many locations, the two lineation systems cross-cut and, without exception, the northwest system is interpreted to be the oldest. When colour-coding the lineations in Figure 1a, we based the classification on continuity considerations, grouping together the lineations outlining a plausible ice-flow pattern (synchronous or time-transgressive). Therefore, each of the two systems may have considerable internal variability in orientation over the mapped area. In general, the older systems have orientations from the northwest-sector and the younger system from the southwest sector, and are hence called the NW-system and the SW-system. Deviations from these orientations mainly occur in the northwestern part of the map area, where the younger flow system indicates southerly or even south-southeasterly ice-flow directions. In cases of uncertainty, other directionally aligned geomorphological elements, such as eskers and meltwater channels, have been used to determine the system assignment.

Fig. 3. Complete distributation record for each of the six lineation classes, (a) Large SW lineations. (b) Medium-sized SW lineations. (c) Small SW lineations. (d) Large MW lineations. (e) Medium-sized MW lineations. (f) Small MW lineations. Mote the exclusive pattern for (b) and (f).
One of the main aims of this study is to separate lineations of different size. Because there are almost 9000 lineations in the study area, an exact measurement of length, width and height for each lineation would be extremely time-consuming. Therefore, the size attribute given to each lineation is based on a visual estimate of the amount of material in the individual lineation, rather than specific length, width or height measures. An approximate figure of the dismensions of these classes is given in Table 1 (see also Fig. 2).
Table 1. Ranges for size classification of lineations.

The patterns of size variations are also illustrated in Figure 4. Two transects, each following the trend ofthe two systems (Fig. 1d), were divided in 15 grids (12.5 × 17.75 km). The number of lineations for each size and direction were counted within the grids and plotted against distance, both transverse and along the flow direction of each system.

Fig. 4. Cumulative number of lineations in grids of transects A and B. Graphs show statistics (a) along the NW flow, (b) transverse to the SW flow, (c) transverse to the NW flow, and (d) along the SW flow. The zone of laterally constrained enhanced SW flow is shown in (a) and (b).
Results: Distribution of Till Lineations
In all, 8747 lineations were mapped. The distribution of these are shown in Figure 1a and in Table 2. Both the NW-system and the SW-system occur over the entire area, although they are unevenly distributed. The most striking irregularity is found in the southeastern corner of the area, where the NW-system is denser and the SW-system is represented only sparsely. The deficiency of SW-lineations here is obviously a primary pattern, in the sense that it represents a non-formation of lineations, because the SW direction is the last recorded ice flow in this area. The NW-system shows increases in both the total number and size of lineations along its flow trend. This pattern also occurs less clearly in the SW-system.
Table 2. Number of lineationsfor each size and direction.
When each of the size classes are viewed separately for the two systems (Fig. 3), more characteristics are revealed. The large- and medium-sized lineations of the SW-system clearly depict a laterally constrained zone of enhanced ice flow. It is likely this zone was constrained by areas that were dominated by cold-based conditions during deglaciation, as there are no topographic controls which can account for this pattern. However, the distribution of small lineations in the SW-system indicates no such clear zonation.
The NW-system shows other, and to some extent, exclusive patterns with respect to the SW-system (Fig. 4a and b). In the central part of the zone of enhanced SW flow, there is a clear deficiency of small NW lineations and a slight decrease in the number of medium NW lineations. However, there is no obvious decrease in the number of large lineations in this zone and, consequently, the apparent average size of the NW lineations increases in this zone.
Second-order irregularities are found in the distribution patterns of the two systems. These include “holes”, i.e. minor areas (<50 km) completely lacking lineations. These holes mostly coincide with topographic highs, where steeper slopes and a thinner debris layer (Nordkalott project, 1986c) probably suppressed lineation formation. However, it is also likely that many of these higher areas experienced cold-based conditions through much of the last glaciation and acted as sticky spots in an otherwise warm-based zone (Reference AlleyAlley, 1993; Reference Kleman, Hattestrand and ClarhallKleman and others, 1999). In addition, apparent deficiencies in the distribution of small lineations may be accounted for by the cover of lakes or overgrowth of Holo- cene peat layers; medium and large lineations are generally higher than the maximum peat thickness.
Discussion
From the distribution pattern of lineations in Figures 1a and 3, we draw the conclusion that there was preferential erosion of smaller NW lineations during the subsequent SW flow, whereas the medium and large NW lineations were affected only to a minor degree. The alternative, that there was a predominance for formation of large NW lineations in a flow-transverse zone matching that of the later SW flow, seems highly unlikely, as the topography and geology is similar along the whole length of the NW flow in the study area. One possible explanation for the unaltered shape of the larger lineations is that the glacier bed of the younger ice sheet only reached the pressure melting point in the lower parts of the terrain. This would cause erosion ofsmall- er and lower forms, while the larger forms, by their height, protruded into colder parts of the ice mass and were protected from erosion and deformation. Such an interpretation is supported by the fact that this area was most likely completely cold-based during the glacial maximum and successively thawed in places during deglaciation as a result of thinner ice, faster ice flow and a warming air temperature (Reference Kleman, Hattestrand, Borgstrom and StroevenKleman and others, 1997, 1999; Reference HattestrandHattestrand, 1997, Reference Hattestrand1998). However, many patches were cold-based up until final deglaciation and never thawed before they became ice free, particularly at higher elevations (Reference Kleman, Hattestrand and ClarhallKleman and others, 1999). An alternative explanation is that the larger forms were indeed subject to the same alteration as the smaller forms, but again, by their size, this may be less obvious, as an amount of erosion or deposition that completely obliterates small forms may not significantly alter the general appearance of larger forms. We do not favour this explanation, as this would be expected to lead to a general remoulding of the larger forms, such as large NW lineations being overprinted or overlain by small SW lineations. However, there are relatively few examples of remoulding in the study area and most of the large NW lineations in the zone of enhanced SW flow lack overprinted SW lineations (Fig. 1a).
In the cases where the large NW lineations were affected by the SW-system, there is an overprint of surface striae, or flutings, on the crests of older lineations or on the tails of the large crag-and-tail ridges. We have not found any signs of deformation of older lineations into barchan-shaped drum- lins or the development of lee-side tail features on the distal sides of pre-existing lineations. This indicates that the SW flow was dominated by erosional processes rather than de-formation or deposition, as the latter processes would be expected to cause some younger, complete drumlins to be formed on top of the older forms.
The total number of lineations in the SW-system is larger than in the NW-system (Table 2; Figs 1a and 3). This seems reasonable, as the SW-system was eroding many of the preexisting lineations, preferentially the small ones. Yet, the number of large lineations is about an order of magnitude higher in the NW-system. Even compared with the restricted zone of enhanced ice flow in the SW-system, there is still a much higher density of large lineations in the NW-system. Whether formed by erosion, deformation, or deposition, of fundamental importance for lineation size is the flux of ice, i.e. the amount of ice passing over an area during formation (providing that the necessary prerequisites of sufficient sediment supply and wet-based conditions are met). Thus, a large average size of lineations in an area may be a result of either a long period of wet-based conditions and a persistent ice- flow direction, or an event of fast ice flow over the area, possibly during only a short time period. Ice flow from the southwest acted, as far as is known, only during the final stage of the last deglaciation and probably only for a few thousand years (Reference KlemanKleman, 1992; Reference Kleman, Hattestrand, Borgstrom and StroevenKleman and others, 1997). Exactly how long the earlier NW flow persisted is uncertain. All lineations may have been created during the deglaciation of the first early Weichselian ice sheet. Alternatively, they may be the cumulative result of numerous glaciations of a magnitude comparable to the early Weichselian ice sheets (Reference HattestrandHattestrand, 1998). The larger average size of the NW- system may lend weight to the latter interpretation, especially since, according to global ice-volume records (e.g. Reference Martinson, Pisias, Hays, Imbrie, Moore and ShackletonMartinson and others, 1987), the deglaciation of the MIS 5d ice sheets was as rapid as the last deglaciation. In addition, the NW-system shows no evidence of laterally constrained ice flow. In fact, this system of NW lineations is common throughout most of northern Sweden (Hattes- Reference Hattestrandtrand, 1998), with very few directional deviations.
Therefore, our preferred interpretation is that the NW- system was formed by a uniform sheet flow over the area during a relatively long time period, whereas the SW-system represents a short event of enhanced ice flow in a laterally constrained corridor, with sluggish ice flow on either side. This pattern probably reflects the retreat of a zone of enhanced wet-based ice flow headward into a frozen-bed area of the ice sheet. On either side of this zone, the ice sheet thawed at its base only shortly before deglaciation, thus making it capable of producing only small lineations.
The increase in the total number oflineations, especially the large ones in the direction of ice flow for each system, may be explained in several ways. If the lineation swarm was created during headward retreat of a wet-based zone into a cold-based core of an ice sheet, the number and size of lineations may be linked to the period that a specific location experienced wet-based ice flow (i.e. the time between thawing of the glacier bed and deglaciation of that area). Based on the discussion above, we argue this is the case for the SW-system. Alternatively, if the lineations are created during more stable conditions (i.e. not during a deglaciation), the number and size of lineations may be related to the distance from the ice divide. Further from the ice divide, the ice velocity increases towards the equilibrium line and hence, more and larger lineations can be created. We interpret this to be the case for the NW-system.
Conclusions
In this study, we have shown that addressing size distributions while mapping glacial lineations helps to discern characteristic patterns of size and density variation, both within and between cross-cutting glacial landform swarms. Such characteristics may aid in interpreting the glaciodynamic conditions of the ice sheet that created them. Our study is spatially restricted, but if this method is used over larger areas, covering complete landform swarms, we believe it is possible to unravel more of the palaeoglaciology of formerly glaciated areas, especially older glacial events which predate and are overprinted by the last deglaciation ice flow.
Acknowledgements
This work was funded by grants toj. Kleman from the Swedish Natural Science Research Council. We would like to thank D. J. A. Evans, R. C. A. Hindmarsh, and an anonymous referee for constructive comments and suggestions about the manuscript.
This paper is dedicated to Dermot Goodwillie. We miss him profoundly and express our deepest sympathy to his family.


