Glycaemia is defined as the concentration of glucose in the blood(Reference Wolever, Jenkins and Jenkins1). Fluctuations in glycaemia are finely regulated so that blood glucose concentration is maintained between 4 and 5·5 mmol/l(Reference Chaikomin, Rayner and Jones2). Within 30 min of ingesting a carbohydrate-rich meal, glucose concentration in the blood rises to 8–10 mmol/l(Reference Chaikomin, Rayner and Jones2). Insulin acts quickly to combat this postprandial surge to return glucose levels to within the homoeostatic range(Reference Ludwig3).
Once food enters the alimentary canal, the gut must inform the body of the impending arrival of glucose to the blood and ensure insulin is secreted to maintain glucose homoeostasis(Reference Drucker4). The intestinal mucosa achieves this primarily by secreting incretin hormones into the bloodstream(Reference Baggio and Drucker5). These incretin hormones are glucagon-like peptide 1 (GLP-1) and glucose-dependent insulinotropic polypeptide (GIP) and they act on receptors in pancreatic β-cells to stimulate insulin release(Reference Brubaker6). Glucose is transported from the intestinal lumen across the brush border membrane of intestinal enterocytes primarily by the sodium–glucose cotransporter, SGLT-1(Reference Wright, Martin and Turk7, Reference Drozdowski and Thomson8). Internalised glucose is then transported from enterocytes across the basolateral membrane into the blood principally by the facilitative transporter, GLUT-2(Reference Kellett and Helliwell9). Both SGLT-1 and GLUT-2 mRNA levels are significantly increased following glucose ingestion compared to a carbohydrate-free control(Reference Miyamoto, Hase and Takagi10).
The rate at which food passes through the gut has a major impact on glucose appearance in the blood(Reference Chaikomin, Rayner and Jones2). Starch is one of the main sources of glucose and energy in the human diet(Reference Zhang, Venkatachalam and Hamaker11) and the extent to which it is digested in the small intestine is a major contributing factor to variations in postprandial blood glucose levels. Slowly digestible starch gives a steady postprandial glycaemic response and it has been suggested that foods containing slowly digestible starch may have positive health benefits(Reference Zhang, Ao and Hamaker12) compared with those foods containing rapidly digestible starch. A decrease in glucose levels results in a corresponding decrease in incretin hormone production, leading to a decrease in circulating insulin levels(Reference Ranganath13). In the case of healthy individuals this would be a desirable effect to help avoid the onset of insulin resistance(Reference Mafong and Henry14). In contrast, increasing the level of circulating incretin hormones to increase glucose-dependent insulin levels is a priority in type 2 diabetic patients(Reference Martin15).
Recently, research focused on the design of starch-based foods with a lower glycaemic index for healthy individuals has increased, as these foods can reduce the rate of glucose absorption into the bloodstream(Reference Zhang, Venkatachalam and Hamaker11). Starch food design may be based on (1) altering physical properties such as viscosity, fibre content and energy density; (2) altering chemical properties such as particle size and degree of hydrolysis(Reference Tester, Karkalas and Qi16) or (3) encapsulating with protein.
The aim of this study was to measure the levels of (1) incretin gene expression, (2) incretin peptide secretion and (3) glucose transporter gene expression, in response to starch/casein mixtures. The hypothesis is that encapsulation of starch in structured protein networks results in a slower rate of starch digestion and a more controlled release of glucose, as the protein limits the access of the gastric enzyme, α-amylase, to the gelatinised starch(Reference Ezeogu, Duodu and Emmambux17, Reference Colonna, Barry and Cloarec18).
Experimental methods
Preparation of starch/casein mixtures
Waxy Maize Starch (trade name Amioca Powder TF) was kindly provided by National Starch (Manchester, UK). The starch was prepared as a 5 % solution in Milli-Q water. Maize is one of the main natural sources of starch and is described as waxy when the amylase–amylopectin ratio is < 15 %(Reference Tester, Karkalas and Qi16). The protein enriched α-casein and β-casein fractions (trade name UltranorTM) were sourced from Kerry Food Ingredients (Listowel, County Kerry, Ireland). β-Casein was supplied in the sodium caseinate form and α-casein was supplied in the acid form. The protein content of the α-casein was 84·072 % and the β-casein was 85·619 % as determined by Kjeldahl(19). Casein solutions (10 % w/w) were prepared by dissolving the powders in Milli-Q water at room temperature and then storing them overnight at 4°C to ensure complete hydration.
The starch and starch/casein mixtures were gelatinised by increasing the temperature of the starch solutions (starch alone or starch in the presence of either α- or β-casein) from 35 to 95°C. The samples were held at 95°C for 6 min and then cooled. The gelatinised starch alone was used as a control to examine the effects of the casein proteins on the starch.
The gelatinised starch alone and the starch gelatinised in the presence of α- or β-casein were then digested using a two-stage in-house digestion process (A. P. Kett et al., unpublished results). The process comprised sodium phosphate buffer (Na2HPO4/NaH2PO4, pH 6·9) pre-incubated to 37°C for 20 min and adjusted to pH 1·5 using 2 m-HCl. To this, 8 ml pepsin (catalogue no. P-7000; Sigma-Aldrich Ireland Ltd, Wicklow, Republic of Ireland, enzyme activity 800–2500 units per mg) was added with continuous agitation followed by 8 g of the substrate that was either 5 wt% gelatinised starch or 5 wt% starch gelatinised in the presence of 5 wt% α-casein or 5 wt% β-casein. The actual casein concentration was 3·8 mg/ml of protein and was determined using the weight of protein powder used and the protein concentration of the individual casein powders. Peptic digestion was carried out at 37°C for 30 min and the reaction was stopped by adjusting the pH to 6·9 using 2 m-NaOH. Amylolytic digestion was then performed at 37°C for 180 min with an addition of 41·2 ml buffer and 2 ml α-amylase (catalogue no. A3176; Sigma, enzyme activity- ≥ 10 units per mg). Following the amylolytic digestion, a 10 ml sample was taken from this internal solution. This aliquot was incubated at 80°C for 30 min to terminate enzyme activity and then stored at − 20°C for subsequent analysis.
Control samples for the digestion process included (1) 5 wt% α-casein digested with pepsin in the presence of α-amylase (2) 5 wt% β-casein digested with pepsin in the presence of α-amylase (3) 5 wt% gelatinised starch treated with heat-inactivated enzymes, (4) 5 wt% starch gelatinised in the presence of 5 wt% α-casein treated with heat-inactivated enzymes and (5) 5 wt% starch gelatinised in the presence of 5 wt% β-casein treated with heat-inactivated enzymes.
Fractionation of α- and β-casein hydrolysates
For fractionation of the casein hydrolysates, following in vitro digestion of 5 wt% casein, the entire solution within the cellulose membrane cell was collected and incubated at 80°C for 30 min to terminate enzyme activity. Approximately 2 ml of this solution was then filtered through a 0·2 μm syringe filter into an HPLC vial. The sample was fractionated by repeated reverse-phase HPLC using a Waters 2695 Separation Module (Waters Corporation, Milford, MA, USA). The sample (100 μl) was injected onto a 150 mm × 20 mm C18 reverse-phase column (Waters Corporation) equilibrated with solvent A (0·1 % trifluoroacetic acid in Milli-Q water). Gradient elution with solvent B (0·1 % trifluoroacetic acid in 90 % acetonitrile/Milli-Q water) was used with a flow rate of 10 ml/min. Peptides were eluted based on hydrophobicity in a gradient of 5 to 35 % solvent B for 55 min, held at 35 % for 2 min and finally increasing to 60 % over the next 7 min. Four fractions were generated for each protein. The process was repeated to yield a final protein concentration in each fraction of 3·8 mg/ml.
Cell culture
An STC-1 cell line, stably transfected with GIP, was received as a kind gift from Dr B. Wice (Washington University, St. Louis, MO, USA) with permission from Dr D. Hanahan (University of California, San Francisco, CA, USA). Cells were cultured in Dulbecco's modified Eagle's medium containing 4·5 g/l glucose and l-glutamine (Sigma-Aldrich). Media were supplemented with 400 μg/ml of the antibiotic G418 (Sigma-Aldrich) to maintain stable transfection of the GIP construct (with a G418-resistance marker), 17·5 % fetal bovine serum, 100 units/ml penicillin and 100 mg/ml streptomycin. All cells used in these studies were between passages 15 and 25.
The Caco-2 cell line was purchased from the European Collection of Cell Cultures (collection reference: ECACC 86010202). Cells were cultured in Dulbecco's modified Eagle's medium containing 4·5 g/l glucose and l-glutamine (Sigma-Aldrich). Media were supplemented with 10 % fetal bovine serum, 15 mm-HEPES buffer, 100 units/ml penicillin and 100 mg/ml streptomycin (Sigma-Aldrich). All cells used in these studies were between passages 18 and 30.
Cell exposures
STC-1 cells or Caco-2 cells were seeded into six-well plates at a density of 1·5 × 106 cells per well and incubated for 18 h before exposures at 37°C, 5 % CO2. Media were aspirated off and the cell monolayers were washed with PBS (Sigma-Aldrich). One millilitre test sample and control sample after digestion was pH adjusted to pH 7–7·4 and diluted 1:1 with media before well addition. Therefore, the actual casein protein concentration assayed was 1·9 mg/ml.
Casein protein fractions eluted from the C18 reverse-phase column were freeze-dried to powder form and reconstituted in sodium phosphate buffer. Before incubation, the samples were pH adjusted to pH 7–7·4 and diluted with media to give a final protein concentration of 1·9 mg/ml.
Cells were exposed to test and control samples for 4 h. Each sample was tested at least in duplicate. A vehicle control sample of sodium phosphate buffer diluted in the ratio 1:1 with media was always included to show the basal levels of the targets in STC-1 cells for 4 h.
Determination of levels of secreted glucagon-like peptide 1 and glucose-dependent insulinotropic polypeptide
Following the 4 h incubation period, 10 μl of 10 × Halt Protease and Phosphatase Inhibitor (Thermo Fisher Scientific, Waltham, MA, USA) was added to each well to inactivate endogenous dipeptidyl peptidase IV (DPP-IV) activity. The cellular supernatants were collected by aspiration and stored at − 80°C before analysis.
Cellular supernatant levels of active GLP-1 (7-36 amide and 7-37 amide) and GIP were assayed using ELISA kits (Millipore (UK) Limited, Watford, UK) according to the manufacturer's instructions. Supernatant samples were assayed in duplicate and the GLP-1 concentrations (pm) and GIP concentrations (pg/ml) in the samples were quantified by interpolating their absorbance from standard curves generated in the same assays. As a quality control measure for non-specific binding, ELISA were performed on test samples in the absence of cells.
RNA extraction
Following the 4 h incubation period, cell monolayers were initially washed with 1 ml Hanks' balanced salt solution (Sigma-Aldrich). Cells were then lysed using QIAzol Lysis Reagent (QIAGEN Limited, West Sussex, UK) and RNA was isolated from cell suspensions using the QIAGEN miRNeasy Mini Kit (QIAGEN Limited) according to the manufacturer's instructions. RNA was quantified spectrophotometrically using the NanoDrop 1000 (Thermo Fisher Scientific) and the integrity was assessed by electrophoresis in a 1·5 % glyoxyl gel with 1 × glyoxyl buffer (Ambion, Applied Biosystems, Foster City, CA, USA). Complementary DNA was prepared from 1 μg RNA using the QuantiTect Reverse Transcription Kit (QIAGEN Limited) according to the manufacturer's instructions.
Real-time RT-PCR
For quantification of Proglucagon (of which exon 4 codes for GLP-1), GIP, SGLT-1 and GLUT-2 mRNA, RT-PCR was performed in a LightCycler 480 instrument (Roche Diagnostics GmbH, Mannheim, Germany). All primers were designed across intron/exon boundaries. Primers for murine proglucagon were designed based on the GenBank sequence (accession no. Z46845): forward primer 5′-AGGGACCTTTACCAGTGATGTGA-3′, reverse primer 5′-ACGAGATGTTGTGAAGATGGTTGT-3′. The annealing temperature for amplification was 56°C. Primers for murine GIP were designed based on the GenBank sequence (accession no. NM_008119): forward primer 5′-TCTCTGTTGCTGGTGCTCCTGTTC-3′, reverse primer 5′-GCTCTCCTGTGCCTCTTTGTCCTC-3′. The annealing temperature for amplification was 58°C. Primers for human SGLT-1 were designed based on the GenBank sequence (accession no. M24847): forward primer 5′-ATCGTGGTCATCTCCCTCCT-3′, reverse primer 5′-CCGTCATCTTCATCTTCATG-3′. The annealing temperature for amplification was 56°C. Primers for human GLUT-2 were designed based on the GenBank sequence (accession no. J03810): forward primer 5′-TGCTGGGTTCCTTCCAGTTT-3′, reverse primer 5′-GCCACCCACCAAAGAATGAT-3′. The annealing temperature for amplification was 53°C.
Plasmid standards were created by cloning an amplified PCR product into the pCR4-TOPO vector using the TOPO-TA cloning system (Invitrogen, Life Technologies, Carlsbad, CA, USA), according to the manufacturer's instructions. The cloned amplicon was identified by PCR amplification, using gene-specific primer pairs, and/or digestion of plasmid DNA using the EcoRI restriction enzyme and confirmed by sequencing (Lark Technologies (Europe), Essex, UK). For RT-PCR standards, plasmid DNA was linearised and quantified using the NanoDrop 1000 (Thermo Fisher Scientific). Standard curve preparation involved creating a series of dilutions from 109 to 102, for each gene of interest.
For each 10 μl LightCycler reaction, 1 μl of test complementary DNA or serially diluted standard was used. The LightCycler 480 SYBR Green I Master Kit (Roche Diagnostics GmbH) was used for quantification according to the manufacturer's instructions using 0·5 μm forward and reverse primers. RT-PCR assays on test samples and controls were performed in triplicate.
Statistical analysis
Data were analysed using Minitab® 15.1.1.0 statistical software (Minitab Limited, Coventry, UK) and the ANOVA system with a Fisher's least significant difference comparison. Means without a common letter are significantly different (P < 0·05) from each other. Whole α- and β-caseins were not included in the statistical model for Figs. 6(a–c), as it would be incorrect to compare a whole protein to fractions of itself.
Results
The incretin hormone response of the murine enteroendocrine STC-1 cell line to in vitro digested waxy maize starch and casein mixtures is described in Figs. 1–4. STC-1 cells were derived from an intestinal endocrine tumour developed in a double transgenic mouse(Reference Rindi, Grant and Yiangou20) and have been shown to be a physiologically relevant model for studies of human enteroendocrine GLP-1 production and secretion(Reference Geraedts, Troost and Saris21). The modified STC-1 cells are a suitable model for GIP secretion(Reference Boylan, Jepeal and Jarboe22). Fig. 5 details the mRNA transcript levels of glucose transporters in the human colonic cell line, Caco-2, after incubation with the digested starch/casein mixtures. Caco-2 cells were derived from a human colonic adenocarcinoma and, when fully differentiated, mimic the lining of the intestine. Cytotoxicity assays indicated that these food mixtures, at the concentrations measured, were not toxic (data not shown). Preliminary time–response curves indicated a 4 h incubation period was sufficient (data not shown). The vehicle control contained 2·25 g/l glucose but the use of alternative buffers without glucose resulted in precipitation of α-casein (data not shown).
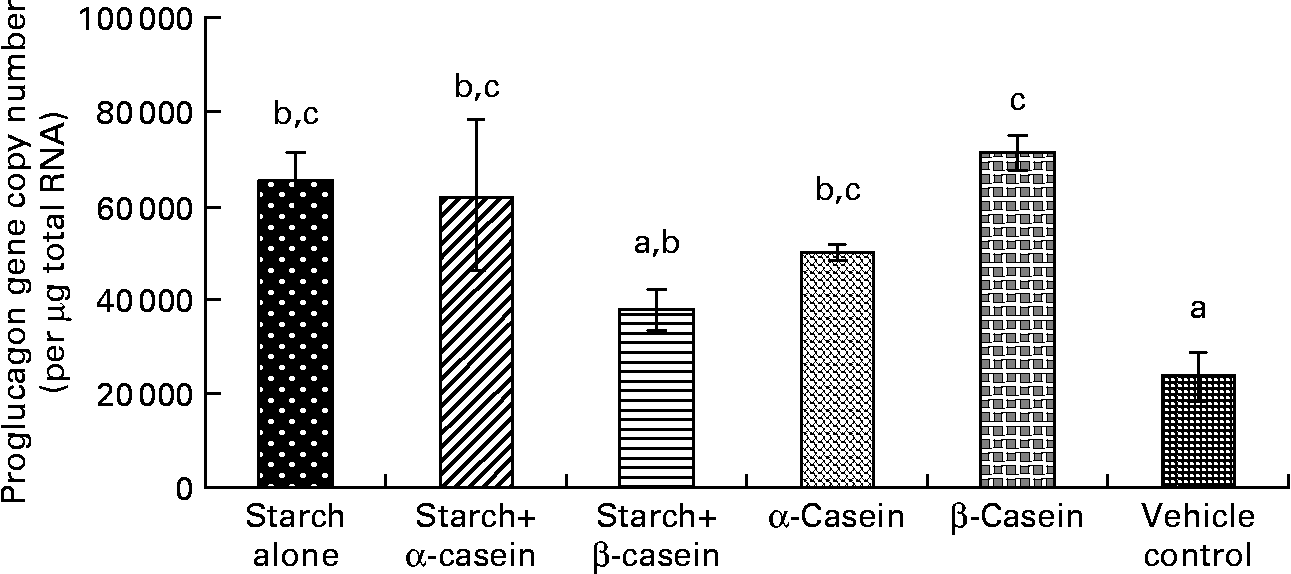
Fig. 1 Proglucagon mRNA levels in STC-1 cells in response to 4 h incubations with digested starch and casein mixtures. Values are means, with standard deviations represented by vertical bars (n 6). a,b,c Mean values with unlike letters were significantly different from each other (P < 0·05).
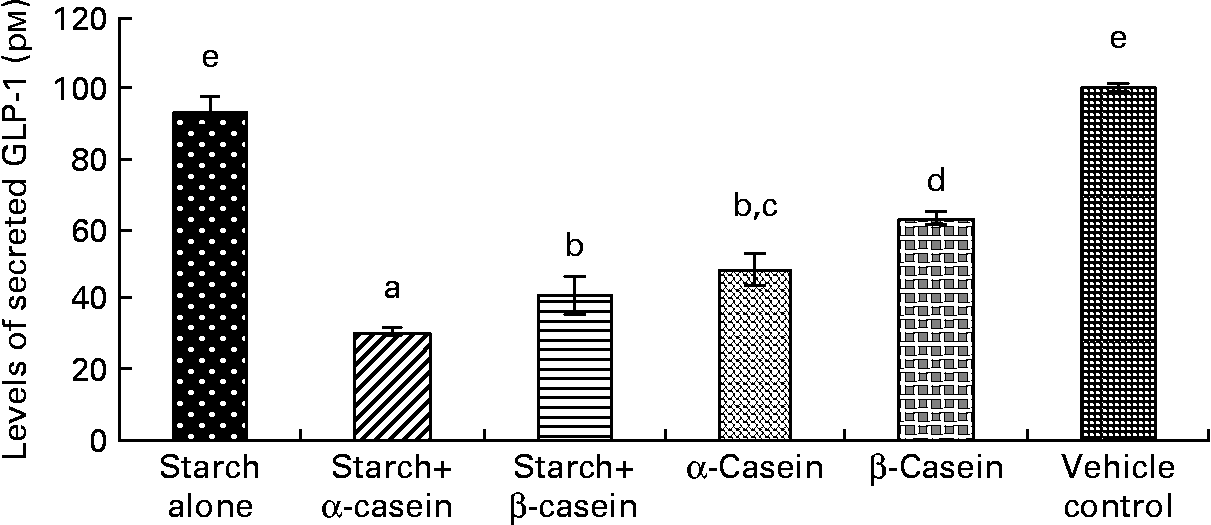
Fig. 2 STC-1 supernatant levels of glucagon-like peptide 1 (GLP-1) in response to 4 h incubations with digested starch and casein mixtures. Values are means, with standard deviations represented by vertical bars (n 4). a,b,c,d,e Mean values with unlike letters were significantly different from each other (P < 0·05).
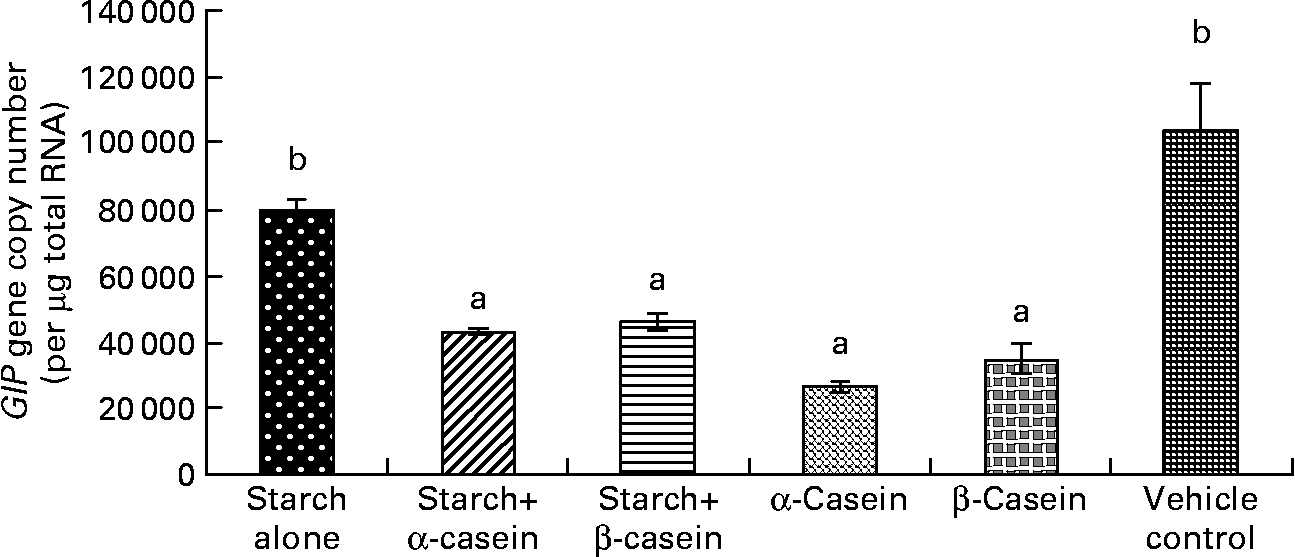
Fig. 3 Glucose-independent insulinotropic polypeptide (GIP) mRNA levels in STC-1 cells in response to 4 h incubations with digested starch and casein mixtures. Values are means, with standard deviations represented by vertical bars (n 6). a,b Mean values with unlike letters were significantly different from each other from each other (P < 0·05).
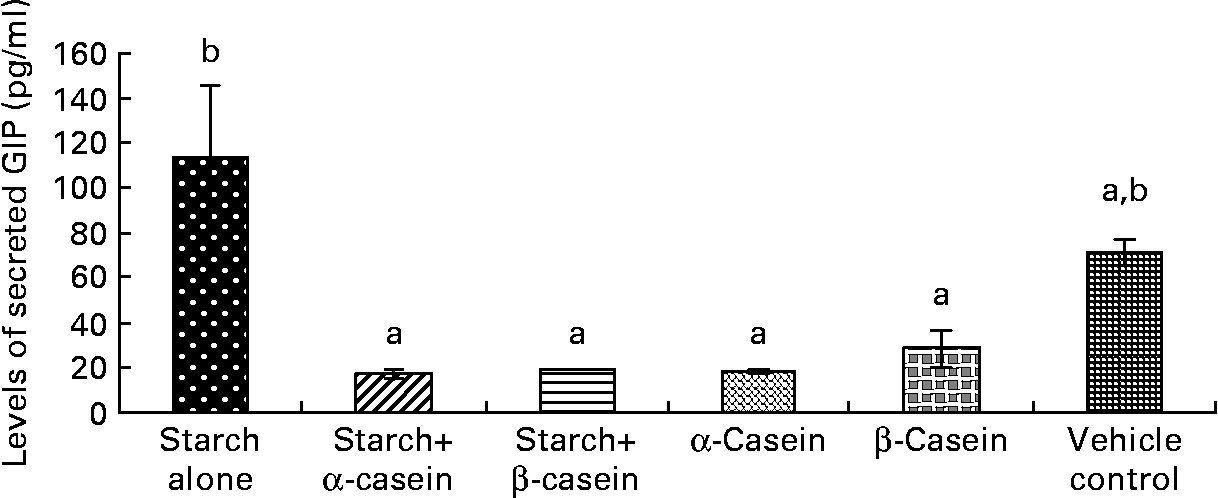
Fig. 4 STC-1 supernatant levels of glucose-independent insulinotropic polypeptide (GIP) in response to 4 h incubations with digested starch and casein mixtures. Values are means, with standard deviations represented by vertical bars (n 4). a,b Mean values with unlike letters were significantly different from each other (P < 0·05).
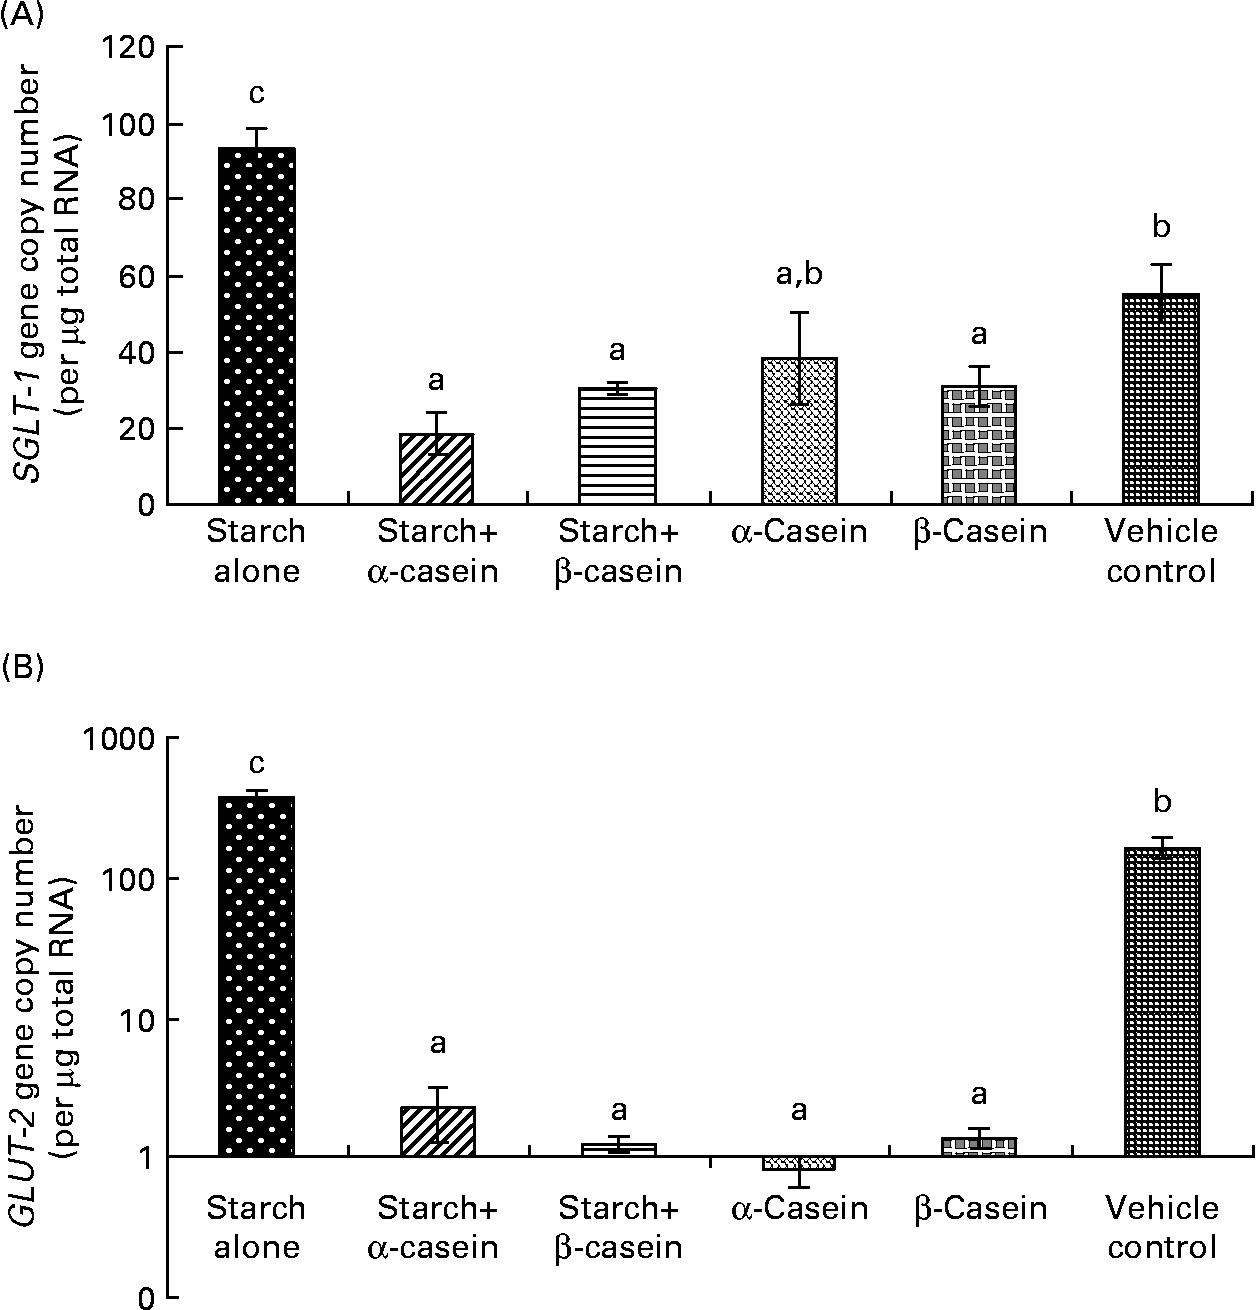
Fig. 5 Glucose transporter mRNA levels in Caco-2 cells in response to 4 h incubations with digested starch and casein mixtures. (A) sodium–glucose cotransporter 1 (SGLT-1), (B) GLUT-2 (graph is in log scale). Values are means, with standard deviations represented by vertical bars (n 6). a,b Mean values with unlike letters were significantly different from each other (P < 0·05).
Proglucagon mRNA levels in response to starch and starch gelatinised with casein
In vitro digestion of gelatinised starch alone, starch gelatinised with α-casein, α-casein alone and β-casein alone all induced significantly higher levels of proglucagon mRNA in STC-1 cells compared with the vehicle control (Fig. 1). There were no significant differences in proglucagon gene expression following a 4 h exposure to these complexes (Fig. 1).
Supernatant levels of glucagon-like peptide 1 peptide in response to starch and starch gelatinised with casein
Both digested starch gelatinised with α-casein and digested starch gelatinised with β-casein induced significantly lower levels of GLP-1 peptide compared to digested gelatinised starch alone (Fig. 2). In fact, exposure to digested starch gelatinised with α-casein resulted in the lowest level of secreted GLP-1 peptide (Fig. 2). Surprisingly, levels of GLP-1 peptide were also significantly lower in response to digested α-casein alone compared with digested β-casein alone (Fig. 2). Levels of GLP-1 peptide were similar in response to the vehicle control (containing 2·25 g/l glucose) and digested gelatinised starch alone (Fig. 2).
Glucose-dependent insulinotropic polypeptide mRNA levels in response to starch and starch gelatinised with casein
There were significantly lower levels of GIP mRNA in STC-1 cells when exposed to digested starch gelatinised with β-casein, digested starch gelatinised with α-casein, digested β-casein alone and digested α-casein alone, compared with digested gelatinised starch alone (Fig. 3). Interestingly GIP mRNA levels secreted by STC-1 cells exposed to digested gelatinised starch were similar to levels secreted by STC-1 cells incubated with the vehicle control containing 2·25 g/l glucose (Fig. 3).
Supernatant levels of GIP in response to starch and starch gelatinised with casein
Exposure of STC-1 cells to digested starch gelatinised with β-casein and digested starch gelatinised with α-casein resulted in the release of significantly lower levels of GIP compared with digested gelatinised starch alone (Fig. 4). In this case, levels of GIP secreted by STC-1 cells in the vehicle control were similar to exposures with all test samples (Fig. 4).
Sodium–glucose cotransporter and GLUT-2 mRNA levels in response to starch and starch gelatinised with casein
SGLT-1 mRNA levels in Caco-2 cells were significantly reduced in response to digested starch gelatinised with α-casein and digested starch gelatinised with β-casein compared with digested gelatinised starch alone (Fig. 5(a)). Not surprisingly, digested gelatinised starch alone induced significantly higher levels of SGLT-1 mRNA compared to the vehicle control (Fig. 5(a)). GLUT-2 mRNA levels were significantly reduced in response to digested starch gelatinised with α-casein and digested starch gelatinised with β-casein compared with digested gelatinised starch alone (Fig. 5(b)). Digested gelatinised starch alone induced significantly higher levels of GLUT-2 mRNA compared to the vehicle control (Fig. 5(b)).
Incretin response to fractions of α- and β-casein
Since the gelatinisation of starch with casein lowered levels of (1) GLP-1 secreted peptide, (2) GIP mRNA transcripts and (3) GIP-secreted peptide, the casein hydrolysates after digestion were fractionated to determine if a particular protein fraction was responsible for this effect. Four peptide fractions, eluted based on hydrophobicity, were generated for each casein. The incretin responses of STC-1 cells to the casein fractions generated are detailed in Fig. 6.
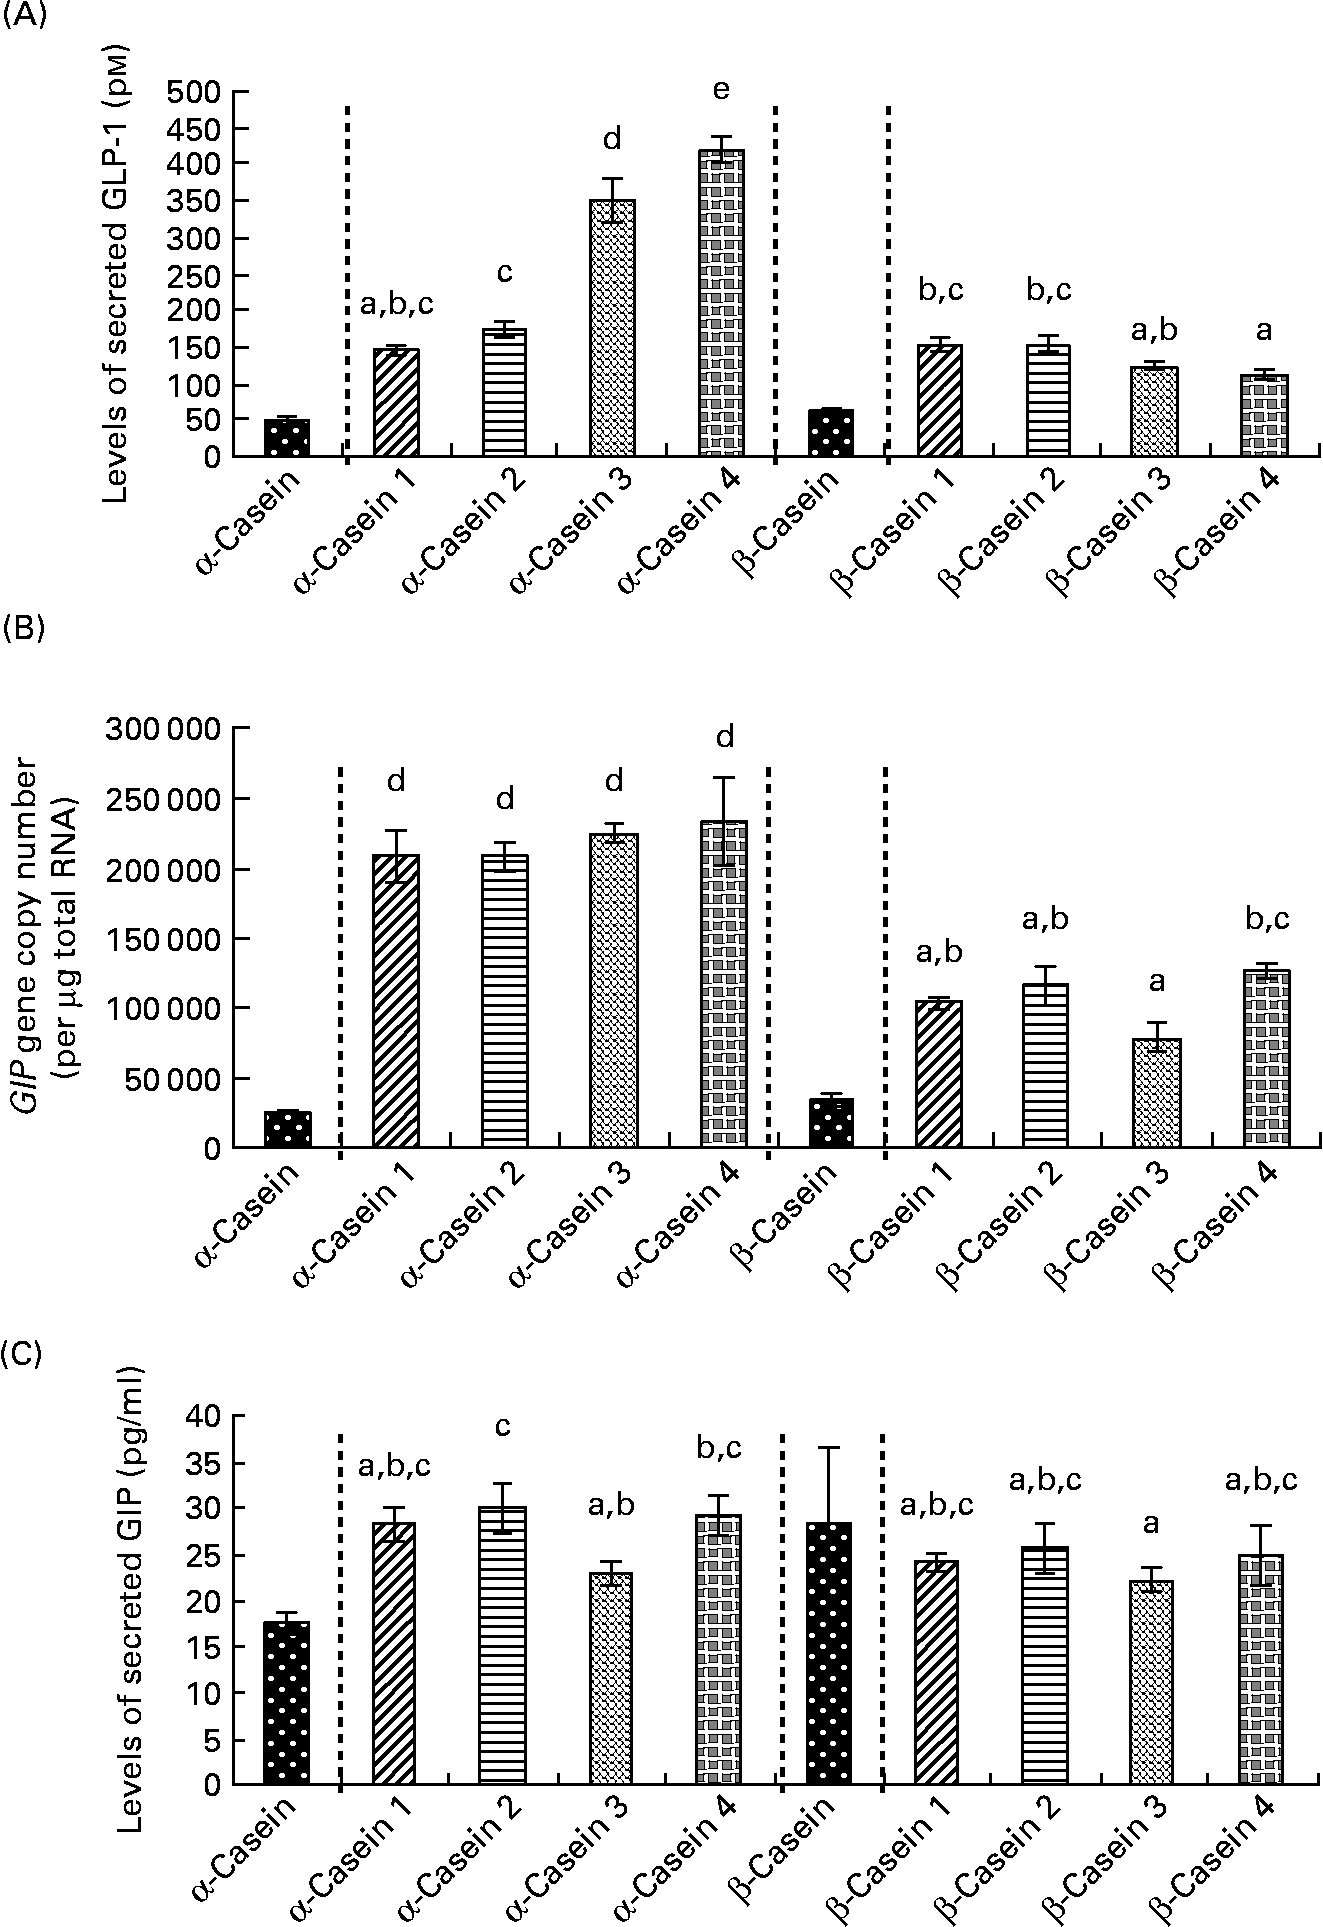
Fig. 6 Incretin levels in STC-1 cells in response to 4 h incubations with fractions (1–4) of digested α-casein and β-casein. (A) STC-1 supernatant levels of glucagon-like peptide 1 (GLP-1), (B) glucose-dependent insulinotropic polypeptide (GIP) mRNA levels in STC-1 cells, (C) STC-1 supernatant levels of GIP. Values are means, with standard deviations represented by vertical bars (n 6). a,b,c,d,e Mean values with unlike letters were significantly different from each other (P < 0·05). Results for digested, unfractionated α- and β-caseins were generated on separate days. Unfractionated α- and β-caseins were not included in the statistical model.
Levels of secreted GLP-1 were significantly lower in response to α-casein fractions 1 and 2 compared to α-casein fractions 3 and 4 (Fig. 6(a)). α-Casein fraction 4 induced significantly higher levels of GLP-1 peptide compared to all of the other α- and β-casein fractions (Fig. 6(a)).
GIP gene expression results demonstrated that the β-casein fractions resulted in significantly lower levels of GIP mRNA transcripts than the α-casein fractions (Fig. 6(b)). There were no significant differences in GIP gene expression between the α-casein fractions (Fig. 6(b)). β-Casein fraction 3 induced lower levels of GIP gene expression than β-casein fraction 4.
Results for GIP levels in response to the α- and β-casein fractions demonstrated that there were no significant differences in secreted GIP following exposure to any of the β-casein fractions (Fig. 6(c)). α-Casein fraction 3 induced significantly lower levels of GIP compared to α-casein fraction 2 (Fig. 6(c)). In addition, secreted levels of GIP were significantly lower when STC-1 cells were exposed to β-casein fraction 3 compared to both α-casein fraction 2 and α-casein fraction 4 (Fig. 6(c)).
Discussion
Starch gelatinised with casein decreased the incretin response compared to starch alone. In contrast, a study by Nilsson et al. (Reference Nilsson, Stenberg and Frid23) reported a significant increase in GIP secretion in healthy subjects, 15 min after co-ingestion of dairy protein/carbohydrate compared to carbohydrate alone. The protein/carbohydrates examined were whey proteins and lactose. A plausible explanation for the lower incretin response observed in the present study is that the casein proteins protect starch from α-amylase digestion, thereby reducing the amount of glucose released. The lower levels of expression of glucose transporter genes in response to starch gelatinised with casein, compared to starch alone, support this explanation. Indeed, preliminary work by our group has demonstrated an almost two-fold decrease in the levels of glucose released from digestion of starch when it is gelatinised with casein protein compared with gelatinised starch alone (A. P. Kett et al., unpublished results). Work by other groups has also demonstrated the restricting effect of protein on the swelling of starch granules after gelatinisation(Reference Debet and Gidley24).
Surprisingly, no individual fraction of either the α- or the β-caseins explained this lower incretin response, which may indicate that the response is not a result of individual casein bioactives released during in vitro digestion, but a function of the physical matrix of the digested starch gelatinised with casein. Interestingly, secreted levels of GLP-1 were higher with cell exposure to hydrolysed casein proteins alone compared to exposure to protein/starch mixtures. Although carbohydrates are the main stimulators of the incretin response(Reference Baggio and Drucker5), individual amino acids such as arginine, leucine and phenylalanine have also been shown to have insulinotropic effects(Reference Van Loon, Kruijshoop and Menheere25). It is possible that the gelatinisation of starch with casein protects not only the starch from digestion, but also the protein. The gelatinisation process, pH changes and enzyme attack would also alter dairy protein structure and the dielectric properties of the caseins(Reference Tsoubeli, Davis and Gordon26). Many studies have assessed the impact of individual food components on the incretin hormones(Reference Greenfield, Farooqi and Keogh27); however, recent focus has shifted to examining the effects of food matrices on the release of GI peptides(Reference Karhunen, Juvonen and Flander28, Reference Jenkins, Kacinik and Lyon29).
The results of the present study indicate a difference between the two casein proteins in GLP-1 peptide response. This is surprising as α- and β-caseins have similar amino acid sequences, molecular weights (approximately 23 kDa) and 3D structure(Reference McSweeney30). However, differences in degree of phosphorylation and hydrophobicity(Reference Fox and McSweeney31) may account for the differences observed. Certainly preliminary work has indicated differences in the interaction of β- v. α-casein with the starch granule itself (A. P. Kett et al., unpublished results).
Individual fractions of α-casein were shown to differ in their ability to induce incretin hormone secretion with α-casein fraction 4 inducing the highest response. Further fractionation of α-casein fraction 4 may result in the identification of a food bioactive for type 2 diabetic patients. In this diseased state, Van Loon et al. (Reference Van Loon, Kruijshoop and Menheere25) have shown that the co-ingestion of dairy protein and carbohydrate improves glycaemia by reducing blood glucose levels and increasing incretin hormone production. The incretin response to food ingestion has been shown to be severely impaired in these individuals(Reference Greenfield, Farooqi and Keogh27)and many also show insulin resistance(Reference Martin15).
Although, incretin secretion can be increased by digestion of proteins and individual amino acids(Reference Van Loon, Kruijshoop and Menheere25, Reference Greenfield, Farooqi and Keogh27), digestion of starch alone yields the largest secretions in our data set. The levels are similar to those in response to the vehicle control (containing 2·25 g/l glucose). STC-1 cells have previously been shown to respond to various protein hydrolysates, including meat hydrolysate and albumin egg hydrolysate, along with carbohydrates and lipids, by increasing both GLP-1 secretion and proglucagon gene expression(Reference Cordier-Bussat, Bernard and Levenez32) and also increasing the levels of satiety hormones(Reference Foltz, Ansems and Schwarz33).
In agreement with other studies, the present study indicates differences in the responses of GLP-1 and GIP to protein ingestion(Reference Greenfield, Farooqi and Keogh27, Reference Frid, Nilsson and Holst34). Greenfield et al. (Reference Greenfield, Farooqi and Keogh27) observed increased GLP-1 levels with little effect on GIP levels over a 90 min time period after ingestion of glutamine. Similarly, a study by Frid et al. (Reference Frid, Nilsson and Holst34) found a 43 % increase in GIP levels 60 min after co-ingestion of whey and carbohydrate compared to carbohydrate alone, yet there was no significant difference in GLP-1 levels in response to whey and carbohydrate compared to carbohydrate alone after 60 min.
In this study, GIP secretion follows similar patterns to GIP gene expression whereas there is some disconnect between proglucagon gene expression and GLP-1 secretion. This disconnect may be a function of post-translational processing (as the GLP-1 ELISA used measured only active GLP-1). It may also indicate that proglucagon gene expression functions to replenish GLP-1 cellular pools rather than respond directly to nutrient stimulation. GIP and GLP-1 are quite different in terms of structure, release and circulating half-life. The mature, 42AA, active GIP (GIP 1–42) is produced following proteolytic processing of the GIP preprohormone(Reference Vilsboll and Holst35). It has a half-life of 20 min and is cleaved by DPP-IV to the inactive polypeptide, GIP (3–42), reference(Reference Drucker4). GLP-1 is produced as a 37AA polypeptide (GLP-1 1–37) following the cleavage of the prohormone, preproglucagon(Reference Yip and Wolfe36). Post-translational cleavage of six N terminus AA yields GLP-1 (7–37), which is then amidated at the C terminus to produce GLP-1 (7–36 amide) which is the major circulating form of the hormone(Reference Ranganath13). GLP-1 has a much shorter half-life than GIP and is degraded within minutes to inactive (GLP-1 9-36) by DPP-IV(Reference Aaboe, Krarup and Madsbad37). GIP has been shown to respond more potently to carbohydrate rather than fat in rats and pigs and it responds primarily to fat compared to protein in human subjects(Reference Baggio and Drucker5).
Conclusions
We have shown that gelatinisation of waxy maize starch with α- or β-casein results in a decrease in the in vitro incretin response and a decrease in the expression of glucose transporters compared to starch alone. A difference in the incretin response to whole and fractionated casein has also been observed. Subtle differences in response to the individual caseins are also noteworthy. Further investigations will include in vivo postprandial studies following ingestion of the starch gelatinised with α- or β-casein. Starch food formulations, which can lower the incretin response and hence, glycaemia, are desirable in the development of functional foods targeted at healthy individuals to help minimise fluctuations in blood glucose levels.
Acknowledgements
This work was supported by the Department of Agriculture and Food under the Food Institutional Research Measure as part of the National Development Plan 2007–2013. C. M. B. and A. P. K. are in receipt of Teagasc Walsh Fellowships. We acknowledge Kerry Food Ingredients Limited, for supplying the casein proteins. All authors have read and approved the final manuscript. The authors have no conflicts of interest to declare. C. M. B. performed in vitro cell line exposures and biological assays, statistically analysed the data and drafted the manuscript. A. P. K. was responsible for preparation of the gelatinised starch/casein mixtures, fractionation of the casein hydrolysates and for digestion of the samples. F. O. H. was involved in design of experiments and manuscript drafting. V. C. was involved in preparation of the starch/casein mixtures and fractionation of the casein hydrolysates. M. A. F. was responsible for production of starch/casein mixtures, involved in design of experiments and secured funding for the project. K. A. C. was involved in design of experiments and manuscript drafting. L. G. was involved in design of experiments, analysis of data and manuscript drafting. All work described in this report was performed at Teagasc Food Research Centre, Moorepark, Fermoy, County Cork, Republic of Ireland.


