Introduction
A rapid growth in the number of diabetic patients is noticed all over the world in the past few years. According to the diabetes report of the World Health Organization (WHO) [1], the number of diabetic patients has rapidly increased to 422 million in 2014 in comparison to 108 million in 1980. Nowadays, diabetes has become a major cause of illness, like blindness, organ failure (kidney), heart attack, brain stroke, as well as lower limb amputation. Until 2019, diabetes has started to count as the ninth leading cause of death, with an estimation of 1.5 million deaths directly. According to the IDF Diabetes Atlas 2021 [Reference Whiting, Guariguata, Weil and Shaw2], 537 million people are living with diabetes in the world. There is no cure to eradicate diabetic illness, but its risk can be minimized by the utilization of food and regular monitoring of glucose concentration. Diabetes is considered a metabolic illness that happens in the condition where the pancreas becomes unable to produce sufficient insulin or in a situation when the body is not able to utilize the produced insulin effectively. Insulin is a type of hormone that regulates the blood glucose concentration in the human body [Reference Raj, Tripathi, Upadhyay, Tripathi and Tripathi3].
Glucose concentration in the human body plays an important role as a source of energy in the cell. Glucose is found in various parts of the body in the form of tears, urine, intestinal fluids, intracellular fluids, saliva, etc. Presently, invasive method of blood glucose measurement is very popular, but a finger has to be pricked for blood samples. There are a few limitations of invasive methods like a painful procedure, being expensive, and a higher risk of getting an infection [Reference Burt, Roberts, Aguilar-Loza and Stranks4]. So, there is a demand for developing an accurate and reliable noninvasive method.
The noninvasive method can provide a painless, protected, and easy-to-use method at a low cost. There are different techniques either in use or in the development stage to detect glucose level concentration in the blood cell. Noninvasive measurement techniques include optical, electrochemical, and RF/ electromagnetic (EM)/microwave techniques. The optical technique is based on spectroscopy, Raman spectroscopy, optical change tomography, polarization change, fluorescence method, smart hologram, etc. [Reference Singh and Jha5–Reference Jung, Jung and Kong7]. The optical technique has a higher initial cost, has bulky device, and needs patients to be admitted for a longer time. The electrochemical method is an enzyme-based method for glucose concentration measurement that uses other fluids like blood. In paper [Reference Wang, Zhang, Hossain and Johnson8], an acetone-based breath analysis is discussed to provide a noninvasive measurement of glucose concentration. Paper [Reference Rabih, Dennis, Ahmed, Khir, Ahmed, Idris and Mian9] described an acetone vapor–based Micro-electromechanical Systems (MEMS) sensor for noninvasive glucose measurement. It has been found that after a certain level of measuring, both electrochemical and chemo-resistive technique–based sensor gets saturated and becomes less effective. In paper [Reference Vrba, Karch and Vrba10–Reference Sutradhar and Hazarika12], the EM technique is introduced for blood glucose measurement with the help of a miniaturized RF sensor. The EM/RF wave radiated from the RF sensor is interacted with a diabetic patient’s tissues [Reference Bruen, Delaney, Florea and Diamond13]. The electrical properties of tissues get to change depending on the level of glucose concentration in the blood cell, which results in the shift of the resonance frequency. The changes in the frequency of EM waves can be calibrated to analyze blood glucose levels directly. Based on the above process, a microstrip patch antenna designed for the microwave can be used for detecting blood glucose levels.
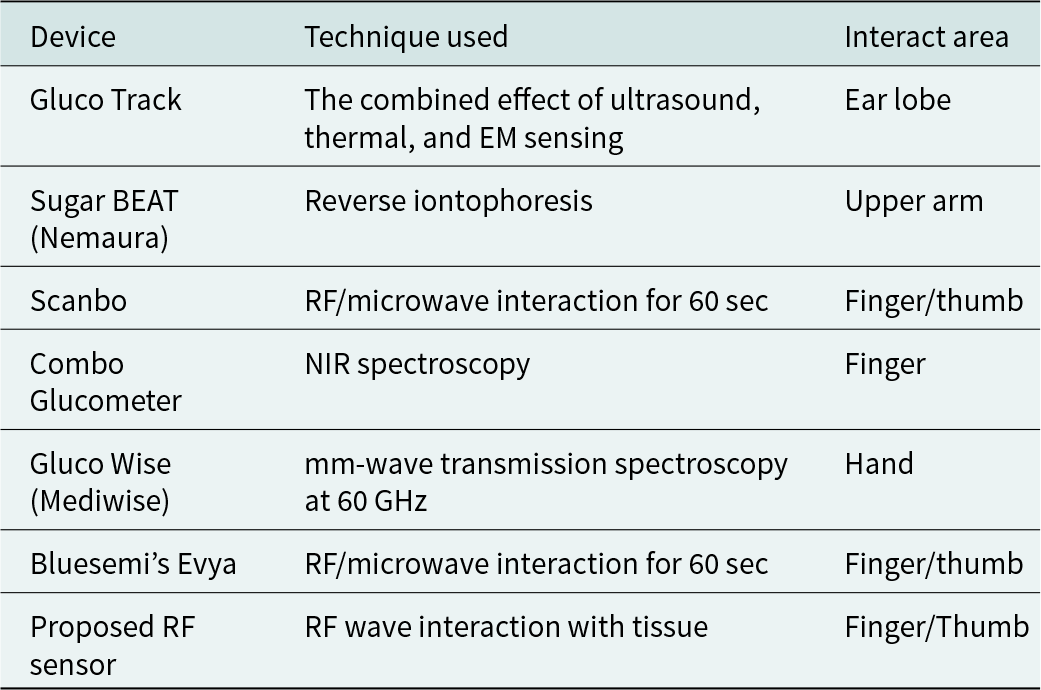
Presently, Gluco track, Gluco wise, Sugar BEAT, etc., have been developed as noninvasive glucose measuring devices by different companies all around the world [Reference Rodriguez14]. The glucose measuring devices and used technique are shown in Table 1.
Table 1. The comparison of noninvasive glucose measuring devices using RF sensors
A highly sensitive noninvasive microwave sensor is developed in reference [Reference Mohammadi, Mohammadi, Demir and Kara15] for a real-time blood glucose measurement. The prototype sensor has a size of 3.5 × 3.5 × 0.16 cm3 and a sensitivity of about 0.72 MHz/mg dL−1. In reference [Reference Deshmukh and Chorage16], a narrowband microstrip antenna is presented as a microwave sensor at a resonance frequency of 1.3 GHz. The designed sensor has a dimension of 68 × 48 × 1.6 mm3 with a frequency shift of 650 MHz. Reference [Reference Yunos, Manczak, Guines, Mansor, Mak, Khan, Ramli, Pothier and Nordin17] has a stepped impedance resonator at 3.528 GHz. A microfluidic device structure has been fabricated in polydimethylsiloxane(PDMS) that can sense the changes in glucose concentrations. Based on the change in resonance frequency, the sensitivity of the biosensor was noted as 264.2 kHz/mg dL−1. The antenna was fabricated on an FR-4 substrate with a thickness of 1.57 mm and a size of 40 × 50 mm2. A novel sensor is designed for glucose measurement in reference [Reference Islam, Hoque, Almutairi and Amin18]. The sensor is designed on Rogers RO 4350 B substrate with a size of 20 × 20 mm2. The unit cell sensing device is inspired by metamaterial properties. The measurement is done in a glucose–aqueous solution characterized by water with dielectric constant variation from 55 to 87 at a frequency of 3.91 GHz. In reference [Reference Korostynska, Mason and Al-Shamma19], the microwave sensor is developed on a flexible substrate for the analysis of water contaminants. Reference [Reference Gharbi, Martinez-Estrada, Fernández-García and Gil20] presents a monopole antenna-based sensor to measure the concentration of salt and sugar present in water, while in reference [Reference Abdolrazzaghi, Genov and Eleftheriades21], a microwave sensor has been developed for the detection of glucose levels in aqueous solutions.
In this paper, a novel planar antenna–based sensor is proposed. The proposed sensor is compact and has higher sensitivity and frequency shifts in near-field radiation. A homogeneous finger equivalent rectangular tissue phantom is used to provide a real environment. It is shown that the proposed design is suitable for blood glucose concentration noninvasively. The methodology, sensor design and specification, simulated and experimental results, and discussion along with regression analysis of the designed sensor are presented in the upcoming sections of the paper.
Methodology
It is observed that the electrical properties of blood cells are affected by glucose concentration. The electrical properties include conductivity, relative permittivity, loss tangent, etc. Glucose concentration also can be explained in terms of dielectric constant instead of glucose concentration in mg/dL, g/mL, or mol/L. The frequency-dependent electrical behavior of glucose concentration of blood cells is defined by the Cole–Cole model. Cole–Cole model is the most widely used method for determining the effective and precise dielectric properties of biological tissues for a wide range of frequencies. The correlation between relative permittivity and conductivity at a specified resonance frequency is defined by equation (1) [Reference Hays, Wojcieszak, Nusrat, LE and Topsakal24]:
 \begin{equation}\varepsilon \left( \omega \right) = {\varepsilon _\infty } + \mathop \sum \nolimits.^ {^n} {{\Delta \varepsilon } \over {1 + j\omega \tau {n^{\left( {1 - \alpha } \right)}}}} + {\sigma \over {j\omega \varepsilon }}\end{equation}
where ω is an angular frequency, ε(ω) is the symbol for frequency-dependent relative permittivity, and order of the mode is shown as n. ε∞ represents the permittivity of blood plasma at the higher frequency, ΔԐ is the amplitude of scattering, and τ is the symbol for the relaxation time constant. The expansion of the dispersion parameter is shown by α, and the static conductivity of blood plasma is denoted by “σ” [Reference Yilmaz and Hao22, Reference Schwan and Foster23]. For the single pole Cole–Cole model, n equals unity.
To satisfy Cole–Cole model-based glucose concentration, an experimental study has been done in reference [Reference Hays, Wojcieszak, Nusrat, LE and Topsakal24]. In this study, a few samples are collected by manipulating blood glucose concentration in vitro. Measurement has been done by taking eight samples from 0 mg/dL to 16,000 mg/dL in the frequency range 1 GHz to 20 GHz as shown in Fig. 1. To measure the blood glucose concentration noninvasively, an arrangement of the sensor with biological tissues and an equivalent phantom model is shown in Fig. 2. In Fig. 2(a), schematic view of a multilayer fingertip model with biological tissue has been shown as a superstrate loaded on the sensor. The biological tissue of the human fingertip (thumb) is further divided into skin, fat, blood, and bone. The level of glucose concentration in the blood is 10% higher than that in other tissues. The characteristics of the multilayer models are discussed in references [Reference Turgul and Kale25, Reference Turgul and Kale26]. In reference [Reference Celeste, Rabioglio, Gelosi, Ribas, Uriz and Moreira27], ultrasound technology has been used to specify the thickness of different layers of the thumb of a volunteer. Its equivalent phantom model and the simulated sensor have been shown in Fig. 2(b).
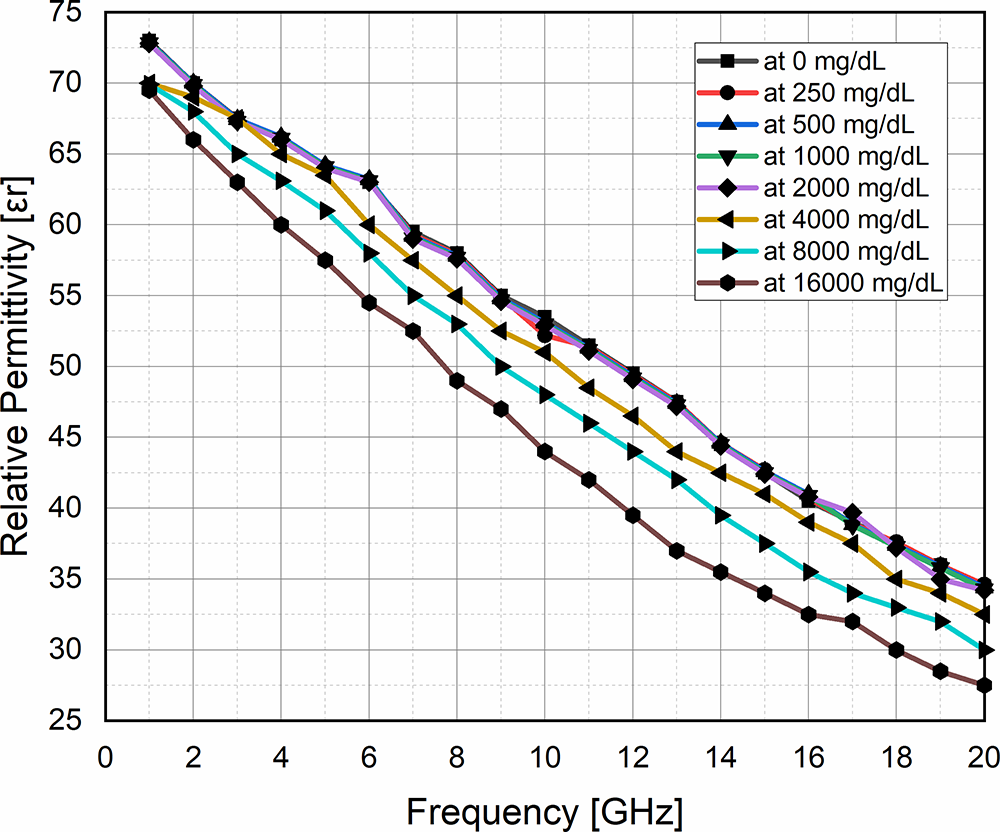
Figure 1. Measurement of dielectric constant at different glucose concentrations in the frequency range of 1–20 GHz.

Figure 2. (a) Schematic and (b) simulated view of the noninvasive model of RF sensor for glucose measurement.
The proposed antenna transmits an EM wave that penetrates through the different layers of tissues. Some of the EM waves are reflected in the patch antenna and measured in terms of reflection coefficient S 11 in dB. The reflection coefficient shows a shift in a resonance frequency that has direct dependent relation with glucose concentration in the blood cell. For noninvasive measurement, the thumb is loaded as a superstrate, which results in changing the resonance frequency of antenna parameters in terms of reflection coefficient, a shift in resonance frequency, amplitude, input impedance, etc. The electrical properties and thickness of different tissue layers at a resonance frequency of 5.7 GHz are shown in Table 2.
Table 2. Electrical characteristics of the phantom at 5.7 GHz [Reference Negi, Khanna and Kaur28]

Sensor design and specification
The design process and specification of the novel and compact size of the planar antenna–based sensor are illustrated in this section. The simulation of the designed sensor has been carried out in the HFSS simulation tool (Ansys Electronics Desktop Version 2021 r1). Ansys HFSS is a finite element method–based solver with adaptive mesh refinement. The simulated and fabricated views of the designed planar sensor are shown in Figs. 3 and 4, respectively. The proposed sensor is designed on the FR-4 epoxy substrate (Ԑ r = 4.4 and tanδ = 0.02) with a thickness of 1.6 mm. The total volume of the substrate is 30 × 30 × 1.6 mm3. It consists of two conducting parts, i.e., patch and ground on the top and bottom surface of the substrate, respectively. The patch structure of the designed antenna consists of two rectangular-shape strips perpendicular to each other. The cross-point edge of these two strips is extended by a semicircular shape to minimize the level of discontinuities and to achieve the desired frequency range. To meet the matched condition of feed point impedance, a 20 mm × 20 mm square slot and staircase structure near to feed point have been cut from the ground plane as shown in Fig. 3. The optimized dimension of the proposed sensor has been shown in Table 3.

Figure 3. Dimension of the proposed sensor for noninvasive glucose measurement: (a) patch and (b) ground.

Figure 4. Fabricated antenna view of the back and front sides: (a) ground and (b) patch.
Table 3. Optimized dimensions of proposed planner antenna–based sensor

Results and discussion
Simulation analysis
This section of the paper shows the explanation of results achieved after simulation and measurement of the designed sensor. Figure 5(a) shows the reflection coefficient |S 11| and frequency plot. From the figure, it can be observed that the designed sensor operates at 5.7 GHz with a 3.8–6.2 GHz frequency band.

Figure 5. Simulated results. (a) Reflection coefficient |S 11| plot with respect to frequency and (b) comparison of reflection coefficient |S 11| of the sensor with and without tissue layer.
The interaction of the proposed sensor with the human tissue phantom shows the frequency shift, which is illustrated in Fig. 5(b). The shift in resonance frequency explains the level of glucose concentration in the human blood cell. The frequency shift of the designed sensor is found to be 1.7 GHz (5.7–4 GHz). The value of frequency shift is also obtained by parametric analysis of the phantom position at the port where the excitation is delivered and phantom height from the sensor as shown in Fig. 6(a) and (b).

Figure 6. Parametric analysis of phantom (a) for phantom position from the port and (b) phantom height from the sensor surface.
During simulation analysis, it has been observed that phantom position concerning distance from the port and height from the designed antenna surface has a major influence on S 11 performance. So, there is a need for optimization to achieve a better |S 11| response. We have performed parametric analysis to achieve the best possible results by varying the distance and height of the port from the sensor surface to the phantom. Figure 6(a) shows the parametric analysis of the phantom position response from the port. From the figure, it can be seen that due to the small variation in the distance, the reflection coefficient value increases, and the operating frequency shifts toward a higher frequency band. Parametric analysis of the phantom position for height from the sensor surface has been shown in Fig. 6(b). From the figure, it can be observed that the reflection coefficient value decreases, and the operating frequency shifts toward a higher frequency band. After parametric analysis, we consider the phantom position with the port at a distance of 0.5 mm and a height (from the sensor surface) of 0 mm, respectively. These two optimized values give better results for the sensor.
To detect the blood glucose level, the relative permittivity of blood should be used as a reference parameter. The relative permittivity of blood from 53 to 68 with a step value of 5 is shown in Fig. 7(a). From the figure, it can be observed that the operating frequency of the sensor gets shifted toward a higher frequency with an increase in the relative permittivity in a linear manner. Figure 7(b) also shows the linear shift in operating frequency, which is a required parameter for the sensor.

Figure 7. Simulated results: (a) variation in reflection coefficient S 11 for relative permittivity and (b) close view of frequency shift as per variation in relative permittivity.
The loss tangent and conductivity of the blood also depend on the blood glucose concentration. These two electrical properties of blood are also varied in this work to validate the performance of the sensor toward blood glucose concentration. The plot of reflection coefficient |S 11| and frequency with a variation of conductivity and loss tangent of blood have been shown in Fig. 8(a) and (b), respectively.

Figure 8. (a) Variation in S 11 versus conductivity. (b) Variation in S 11 versus loss tangent.
From the figure, it can be observed that there is no shift in operating frequency with a variation of conductivity and a loss tangent. From these two graphs, we can conclude that the effect of loss tangent and conductivity is small compared to relative permittivity on the operating frequency.
Experimental analysis
The experimental study has been done in two steps. Step one is about the vector network analyzer (VNA) interaction with aqueous glucose solutions to provide a wide range of detection capabilities of the designed sensor. The second step is the study of VNA interaction with the patient’s thumb to detect the glucose level in the real scenario. Both steps are shown in Fig. 9.

Figure 9. Experimental setup for sensor measurement: (a) sensor in free space, (b) sensor with the thumb (human tissues), and (c) sensor with glucose solution connected to VNA.
In the figure, the sensor is connected with a VNA in three conditions. Figure 9(a) shows the sensor connected with VNA in free space; Fig. 9(b) shows the sensor connected to VNA with thumb tissues loaded; and Fig. 9(c) shows the sensor connected to VNA having contact with glucose solutions.
Figure 10 represents the comparison of the simulated and measured results of the proposed sensor under no loading and with loading by tissue. There is a good agreement between simulated and measured results. Results with thumb loaded show a 1.7 GHz shift in resonance frequency in comparison to the unloaded resonance frequency.
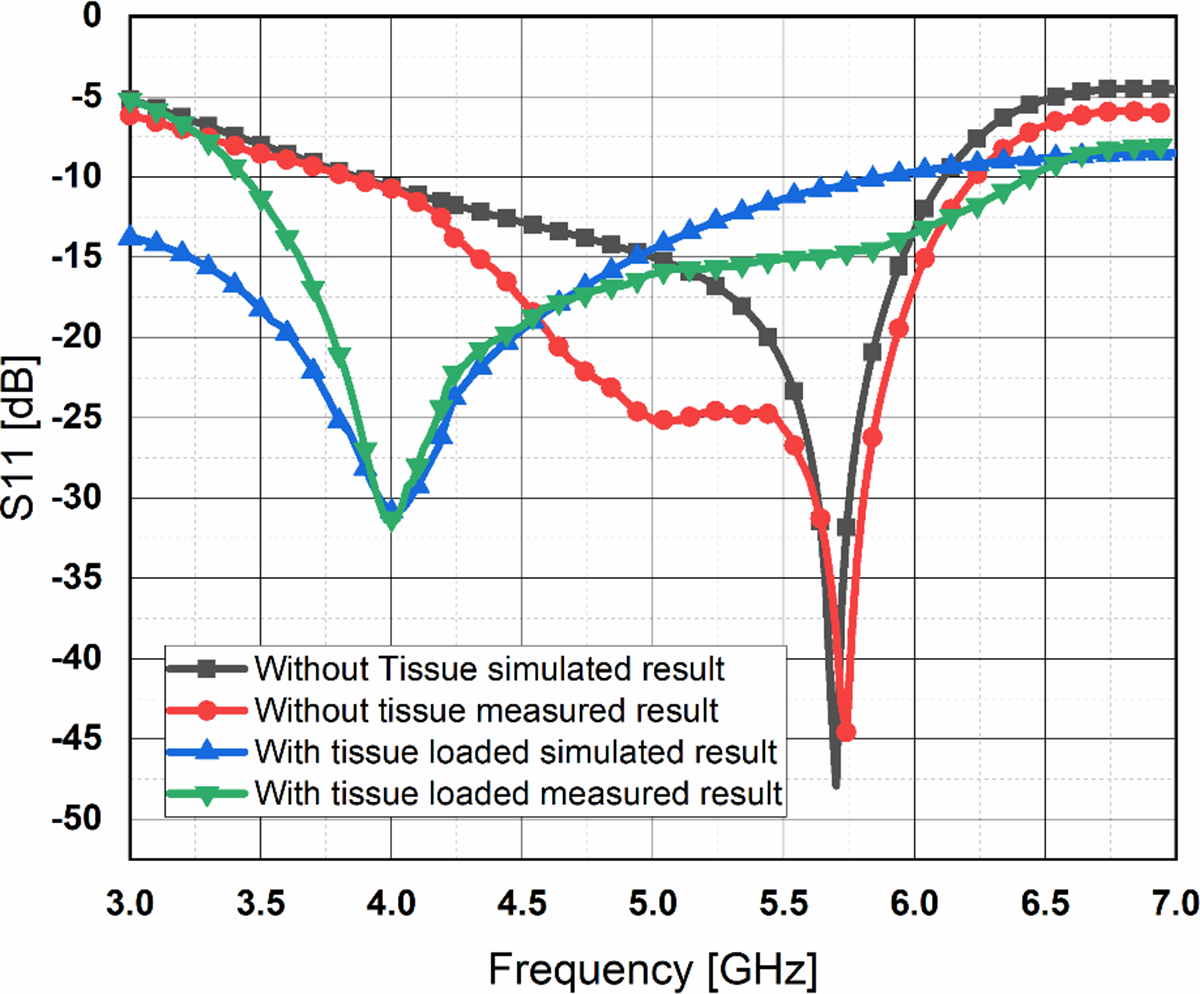
Figure 10. Comparison of simulated and fabricated proposed antenna results with and without loaded tissues.
Statistical studies also have been done to perform error analysis between these two results. The variation found between simulated and measured results for the sensor with and without tissue varied between minimum values of 0.04 to a maximum value of 8.5667 in terms of S 11.
For experimental validation of glucose sensing, an aqueous solution of glucose concentration is prepared by taking D-glucose (purity >99%) and DI water. About eight samples of a solution have been prepared for glucose concentration in the range of 0 mg/dL (DI water) to 900 mg/dL at the interval of 150 mg/dL at room temperature 25°C as shown in Fig. 11. These samples have been used as an ideal condition for linear comparison with a commercially available invasive method having a 4–5% variation with actual blood glucose concentration [Reference Omer, Shaker, Safavi-Naeini, Alquié, Deshours, Kokabi and Shubair31, Reference Govind and Akhtar32].
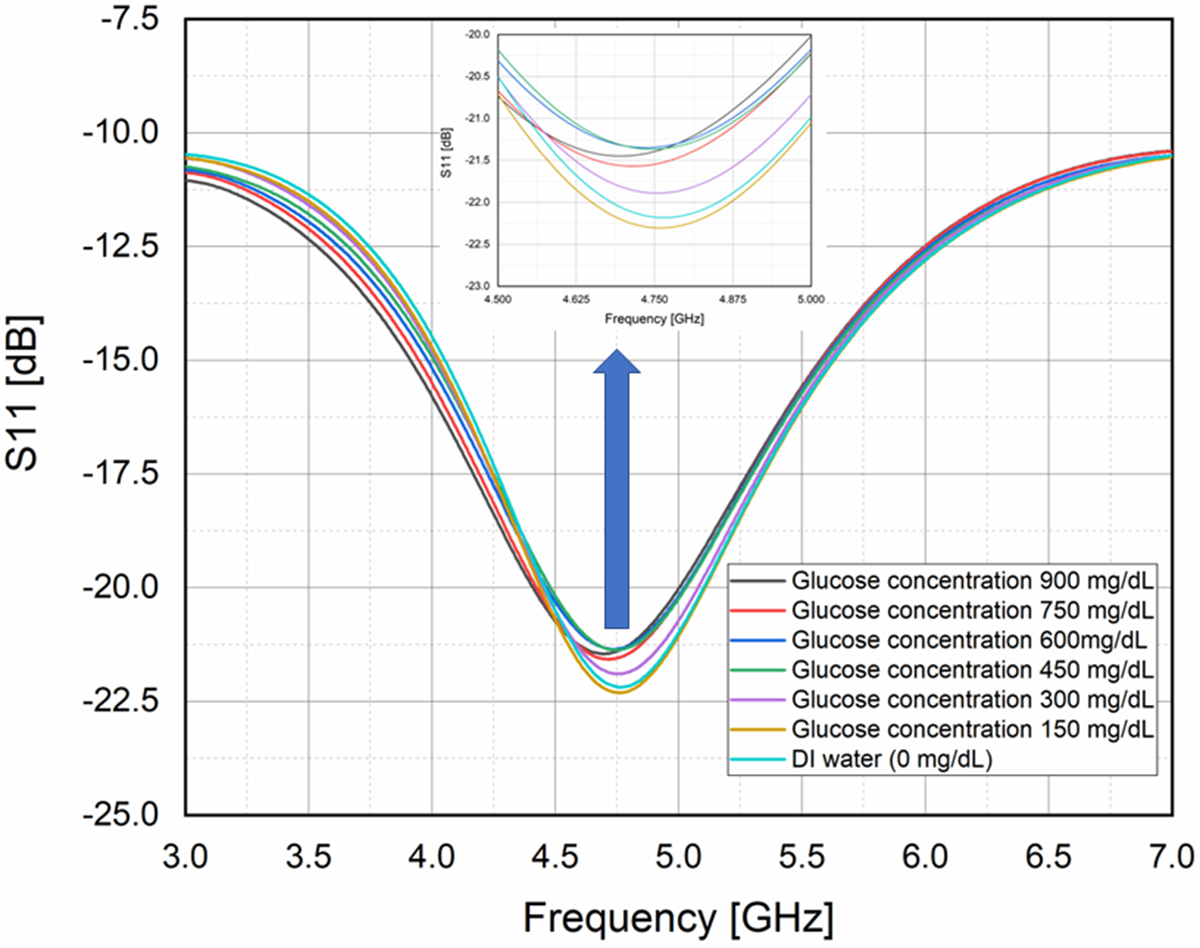
Figure 11. Graph of frequency variation at a different level of glucose concentration in (mg/dL).
Regression analysis
Figure 12 shows the graph of regression analysis. Regression analysis is a statistical curve fitting method widely used for predicting the stage of linearity in terms of coefficient of determination (COD) R 2 value. In regression analysis, the results obtained from the invasive method is assumed to be a straight line. Measurement of about eight samples of aqueous glucose concentration has been taken in comparison to a straight line [Reference Omer, Shaker, Safavi-Naeini, Alquié, Deshours, Kokabi and Shubair31, Reference Govind and Akhtar32]. It has been found that there is a direct relation between blood glucose concentrations and frequency shifts including error.

Figure 12. Regression analysis: graph of the fitted curve for linearity in frequency.
The equation of the regression curve is given by
here y is the dependent variable (frequency), x is the independent variable (concentration of blood glucose), and a and b are constant. After simulation, the equation of the regression curve becomes
with the COD value, R 2 = 0.9339.
This means that 93.39% of the glucose sample values match the regression line, where a sample with 20% variation (above 80%) is assumed to be clinically accepted [Reference Deshmukh and Chorage16].
The sensitivity is defined as
 \begin{equation*}{\textrm{Sensitivity }}\left[ {\textrm{S}} \right] = {{{\textrm{change in frequency }}\left( {{{\Delta f}}} \right){\ }} \over {{\textrm{change in glucose concentration }}\left( {{{mg}}/{\textrm{dL}}} \right)}}\end{equation*}
The calculated sensitivity of the designed sensor shows a sensitivity of 4 MHz/Ԑ r or 0.089 MHz/mg dL−1. It has been also noticed that there is little variation in the frequency of the different samples at each glucose concentration level during the measurement. This variation of frequency shift ranges between 2.5 and 4.3 MHz.
The experimental validation of the proposed sensor has been done for glucose concentration in the range of 0–900 mg/dL, which is not practically suitable for diabetic patients. Therefore, a fasting experiment has been performed on a diabetic patient with a high glycemic index (GI) meal for 90 minutes. High GI meal has the capacity of increasing blood glucose level rapidly at a certain time, after that it starts decreasing as shown in Fig. 13.
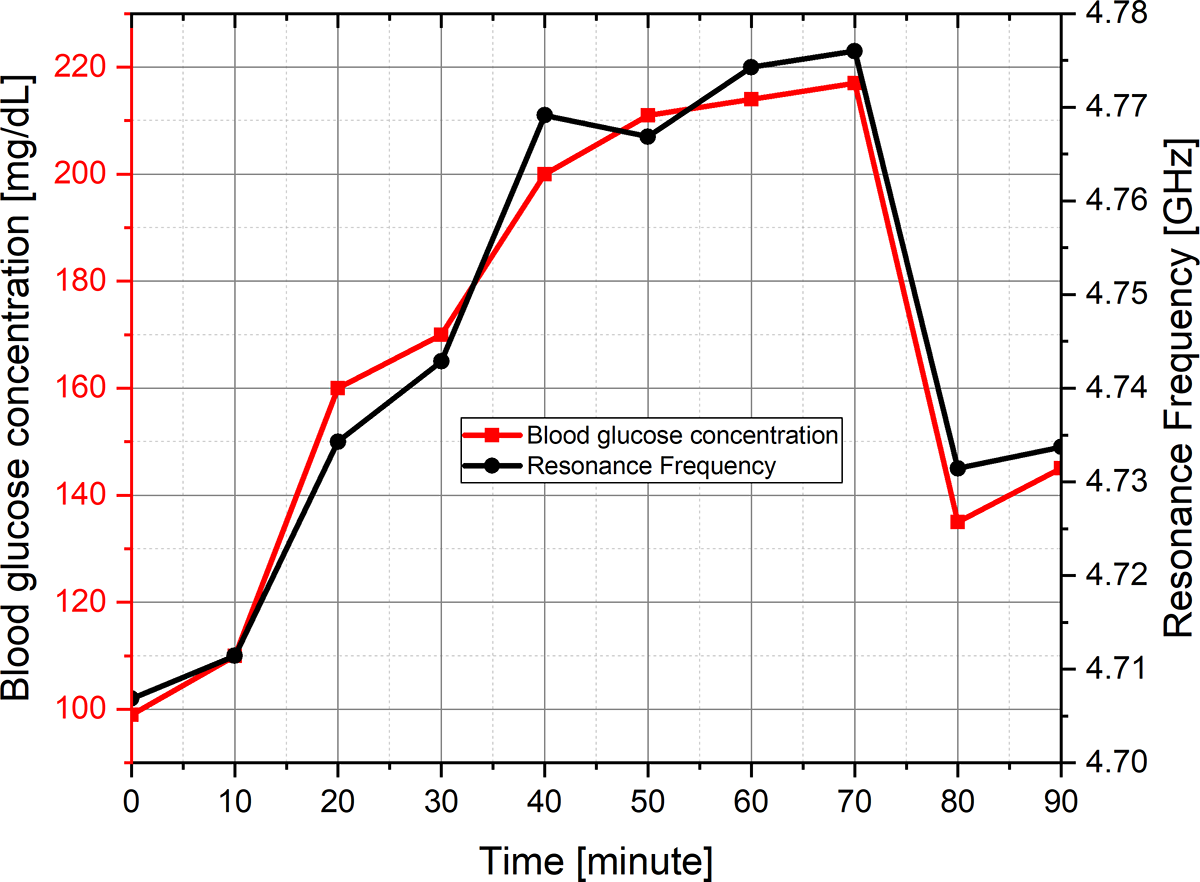
Figure 13. Variation in blood glucose concentration and respective resonance frequency with respect to time.
The experimental studies have also been done by taking four samples of glucose concentration in the range of 190–210 mg/dL with respective resonance frequencies of 4.76–4.775 GHz at time intervals of 40–70 minutes.
The comparison of the proposed antenna performance and specification with another existing sensor is given in Table 4. Table 4 presents a comparative view of some sensors proposed in the recent literature. It can be noticed that the sensor shows a better frequency shift of 1.7 GHz than other referenced sensors. From the table, it can also be observed that the designed sensor has a more compact size than other referenced sensors.
Table 4. Comparison of the proposed sensor with another existing sensor for blood glucose sensing applications

In the comparison table, the different sensor uses different measurement technique to define sensitivity based on the amount of glucose concentration and reflection coefficient parameters, respectively. It can be noticed from this table that researchers have used two definitions of sensitivity. One is MHz/Ԑ r and the other is MHz/mg dL−1. Both are similar because Ԑ r of blood depends on its glucose concentration. We have considered the second definition.
Conclusion
This paper presents a novel structure of a planar antenna–based sensor for the 5.8 GHz ISM band. The designed sensor works on the RF wave technique, which gives better sensitivity and accuracy. It has the potential for measurement of glucose concentration variation in blood by varying electrical properties of human tissues. The designed sensor has a compact size of 30 × 30 × 1.6 mm3. The bandwidth of the designed sensor is 2.4 GHz (3.8–6.2 GHz), and it works at the resonance frequency of 5.7 GHz. The fabricated sensor has been validated, measured and experimentally tested for blood glucose level measurement. The experimental result of the sensor with fingertip gives a 1.7 GHz frequency shift that validates better accuracy of the sensor applicable to diabetic patients. The linear graph between frequency and relative permittivity of blood shows better sensitivity of 4 MHz/Ԑ r or 0.089 MHz/mg dL−1. The simulated and experimental results of the designed sensor suggest that it can be useful for blood glucose level measurements.
Financial support
This research received no specific grant from any funding agency, commercial, or not-for-profit sectors.
Competing interests
The authors report no conflict of interest.

Tilakdhari Singh (Author) received a B.Tech. degree in Electronics & Communication Engineering from Feroze Gandhi Institute of Engineering and Technology, Raebareli, Uttar Pradesh Technical University Lucknow in 2012. He has completed MTech from BBDNIIT, Lucknow in 2016. Currently, he is Pursuing Ph.D from MNNIT Allahabad in Department of Electronics and Communication Engineering. His research interests include flexible microwave sensors for health monitoring applications.

Piyush Kumar Mishra (Co-author) born in Varanasi (U.P.), India, in 1991. He is a research scholar in the Electronics and Communication Engineering Department at Motilal Nehru National Institute of Technology Allahabad, Uttar Pradesh, India. He is completed his Master degree (M.Tech.) in ElectronicsEngineering from University of Allahabad, India in 2019 and Bachelor degree (B.Tech) in Electronicsand Communication Engineering from Uttar Pradesh Technical University, Lucknow, India in 2014. His research interests include antenna design for biomedical applications.

Aditya Pal (Co-Author) received a B.Tech. degree in Electronics & Communication Engineering from university of Allahabad, India in 2018. He has completed M.Tech from MNNIT Allahabad in 2021. Currently, he is Pursuing Ph.D from MNNIT Allahabad in Department of Electronics and Communication Engineering. His research interests include MIMO antenna design.

Vijay Shanker Tripathi (Co-author) born in Gorakhpur (U.P.) in 1965. He has completed his Ph. D from Electronics & Communication Engineering Department from Motilal Nehru National Institute of Technology Allahabad in 2007, M.E. in Digital Systems from Motilal Nehru National Institute of Technology Allahabad in 1999 and B. Tech. in Electronics and Telecommunication Engineering from University of Allahabad in 1988. He is currently Professor in Department of Electronics and Communication Engineering, Motilal Nehru National Institute of Technology Allahabad, Prayagraj, U.P., and India. He has authored or co-authored over 60 research papers in international/national journals/conference proceedings. His research interests include RF Circuits and Systems, Antenna, SDR and Non-Invasive RF Sensors.


