Introduction
A glacier system is regarded as the ensemble of many glaciers sharing the same region, influenced by a similar climate and organized by certain intrinsic laws; it can be divided and subdivided based on certain characteristics (e.g. mountain massif, watershed boundaries) (Reference Kotlyakov and SmolyarovaKotlyakov and Smolyarova, 1990). There are 59406 km2 of glacial area and 5590 km3 of glacial volume in China (C. Reference Liu, Xie, Liu, Shi, Huang, Yao and DengLiu and others, 2000). Glaciers are a vital fresh-water resource in the arid western area of China. The recent temperature rise is the key factor in the variation of glaciers, which have been retreating since the middle of the last century due to global warming (Reference Liu, Kang and LiuLiu and others, 1999). As a result, many studies were carried out on the variation of glacier response to global warming (Reference Kotlyakov, Grosswald, Dyurgerov and MazoKotlyakov and others, 1991, Reference Kotlyakov and Lebedeva2000; Reference Shi and LiuShi and Liu, 2000; Reference Ye, Ding, Liu and LiuYe and others, 2003).
The model of glacier system response to climate warming was previously applied on the glacierized regions of southern Tibet (Reference Xie, Feng and LiuXie and others, 2002). In this paper, we improve our model further and apply it to glacier systems all over China and try to gain average results of glacier systems in China responding to climate warming during this century.
Parameters for Models
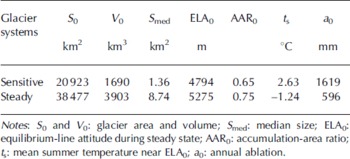
Glacier data (number, area, volume, etc.) were obtained from Chinese glacier inventories acquired from aerial surveys during the 1960s–80s. Glaciers were divided into ‘sensitive’ and ‘steady’ glacier systems (Fig. 1) based on the glacier system’s mean summer temperature near the equilibrium-line altitude (ELA) and their median size. Temperature data were taken from the Climatic Atlas of Tibetan Plateau Climate which reflects meteorological conditions of the 1960s and 1970s. The parameters needed in order to run glacier system modeling are listed in Table 1.

Fig.1. Location and sensitivity to climate change of glaciers in China.
Table 1. Parameters of glacier systems in China for prediction

Modeling
Calculation of mass-balance change
The specific net mass balance near ELA0 is approximately equal to the average net mass balance of a glacier (Reference Xie, Ding, Liu and LiuXie and others, 1996), and the depth of ablation and runoff are also approximately equal to their corresponding average values (Reference Kang, Liu, Wang, Han and ZhangKang and others, 1994). These laws can also be applied to glacier systems (Reference Xie, Feng and LiuXie and others, 2002). With a given temperature rise, employing the ablation formula by Reference Kotlyakov and KrenkeKotlyakov and Krenke (1982), the net balance of a glacier system, bni , in a given year i can be expressed as:

where a 0 and ai are ablation in the original year and in the given year i, t s0 is the mean summer temperature near ELA0 in the original year and Dt s i is the increase of mean summer temperature in the given year i.
We define the ratio between |b n i| and a 0 of a glacier system in the year i as:
Calculation of glacier runoff and area change for climate warming
When temperature rises, glacier melting will accelerate, negative mass balance will occur, and therefore glacier runoff will increase. On the other hand, glacier area will decrease as glaciers retreat, and the total glacier runoff, wi , in a given year iwill be:
where r 0 and s 0 are the depth of runoff and area of glacier in the original year, respectively, and rdi and s d i are the increase of runoff depth and the decrease of glacier area due to climate warming in a given year i, respectively. With the temperature continuously rising, glacier runoff will first increase due to the increase in ablation, and after reaching its maximum amount, it will decrease again because of the reduction in glacier area. When it returns to the original amount of glacial runoff, we call this ‘restoring original glacier runoff state’ (Reference Xie and FengXie and Feng, 1996). At that time, ignoring evaporation, we can set r 0 = a 0 , r d i = |bni| and the decrease of glacier area, s d i, is:
We employ the widely used empirical formula to relate glacier area and thickness (Reference Liu, Ding, Ding, Xie and LiuLiu and Ding, 1986) to determine the time when a glacier reaches restoring original glacier runoff state under continuous warming, T ei (Reference Xie and FengXie and Feng, 1996). Then the glacier area si in a given year i is:

When it comes to predicting the variation in the glacier system, we use s med to replace the total area of the whole glacier system, S, and apply the laws mentioned above to arrive at the results. Ignoring evaporation, the total runoff of the glacier system, Wi , in a given year i is:
where Si is the total area of the glacier system in a given year i, and the constant 106 is used to convert mm into km.
Prediction Results
The global mean surface air temperature will rise this century (Reference HoughtonHoughton and others, 2001) and so will the temperature in northwestern China and on the Tibetan Plateau (Reference Zhao, Gao, Tang, Xu, Qin and DingZhao and others, 2002). Since the prediction for a climatic warming trend is accompanied by uncertainties, we have made some assumptions about climatic scenarios with possible rates of temperature increase of 0.01, 0.03 and 0.05 Ka−1 in this century. We take 1980 as the original year and calculate the tendency of glacier systems’ variations in response to these possible climatic scenarios. By the end of this century, the glacier area of China (AS/S) will on average be reduced by 14.2%, 39.7% and 59.7% under the climatic scenarios of 0.01, 0.03 and 0.05 Ka−1, respectively. However, there are distinct differences between the sensitive glacier system (Fig. 2) and the steady glacier system (Fig. 3).

Fig. 2. Responses of a sensitive glacier system in China with respect to total runoff and glacier area in response to possible climatic scenarios in this century: (σ) glacier runoff variation; and (b) glacier area variation.

Fig. 3. Same as Figure 2 , but for a steady glacier system.
Verification and Discussion
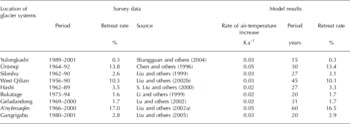
The continuous increase in the abundance of glacier variation observations and alpine meteorological data makes it possible to verify our models. However, care needs to be taken since there exists a lag time in glaciers’ response to climate change, especially for large, thick debris-covered glaciers. But with respect to alpine glacier systems, the small and non-debris-covered glaciers which are sensitive to climate change are most prevalent in China, so we argue that our model is reliable. On the other hand, precipitation has been increasing in northwest China since the 1980s (Shi and others, 2003); but considering that the prediction of precipitation variation is accompanied by large uncertainties, we discuss the influence of precipitation on glacier systems under climate warming separately. The survey data for contemporary glacier variations (Fig. 1) and corresponding model results are compared in Table 2.
Table 2. Verification of model results with data of the glacier changes in western China in recent decades

In the Northern Hemisphere, average air temperatures were 0.4 K higher in the 1980s than in the 1960s (Reference Lin, Zhao, Tang, Cheng and LinLin and Zhao, 1998). In Tibet the average rate of increase in air temperature was >0.02Ka−1 (Reference KangKang, 1996) and it has been accelerating since the mid-1980s (Reference Shi, Shen and HuShi and others, 2002). On average, air temperatures were 0.5 K higher during 1985– 2001 compared to 1958–85 in the glacierized source region of the Ürümqi river (Reference Li, Han, Jing, Yang and JiaoLi and others, 2003), with air temperatures increasing by 0.03 K a−1 from 1985 to 2001. Thus, the rate of air-temperature increase was on average 0.02–0.03 K a−1 for the last 30–40 years in the glacierized region of China. The survey data for glacier variations largely reflect this temperature increase, and they agree well with the results of our model under similar temperature-rise scenarios (Urumqi and A’nyemaqen were exceptions). Thus, we suggest that our model is generally reliable.
Acknowledgement
This research project was supported by grants from the National Natural Science Foundation of China (40371027).


