

The Chairman was Professor J. F. Nye, and he opened the discussion by proposing that it be structured according to the scheme shown in Figure 1.
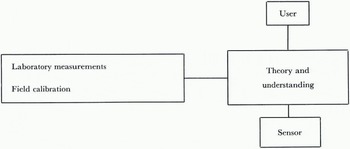
Fig. 1. Structure of discussion.
J. F. NYE: At the top we have the user of remote sensing, at the bottom the sensor itself. Somewhere in between we have what we might label “theory and understanding” of how the particular sensor senses the thing that the user is interested in. I was struck by a remark of Meier’s in relation to the 19 GHz Antarctic image with the contrast, about which he said “Even if we went to Antarctica to try and find out what that contrast is all about, we would not know what to measure”. It is that sort of problem which is in the central box. We also have to include measurements, either in the laboratory or the held, and the general question of calibration. I am thinking here of measurements of dielectric constant, resistivity, etc., which are necessary to feed this theory and understanding. I have purposely put the diagram this way up, with the user on top, and I suggest users of remote sensors say in the discussions what you would like sensed; then we have people with us who know all about how these instruments function, and they can tell us to what extent they think their sensors, and sensors which might be developed, will satisfy these user needs. That should lead to a discussion of the central area and also of the measurements and calibration.
We have also a division into the type of ice and snow we are talking about:
-
1. 1. Snow
-
2. Glaciers and ice sheets
-
3. Floating ice
-
4. Ground ice
There is also another area I shall just call “admin.”—I mean the sort of discussion we had in the previous session—maybe the user cannot locate the data or equipment he needs.
We shall divide the time into these sections, and start with users concerned with snow, going on to glaciers and ice sheets, and the other subjects listed. 1 have asked Dr Meier, Dr Paterson, Dr Weeks and Dr Schytt to prepare lists of what they as users would like remote sensing to provid.
SNOW
M. F. MEIER: I am very happy to find myself on the top of the pile as a user. I am usually out on the snow digging holes in one of these off-to-the-side field measurements. 1 have been asked a very difficult question, what is needed to know about snow from the point of view of the user community, and it is difficult because what is the user community of seasonal snow cover? Snow cover falls upon almost all countries in the world, and a large proportion of the population of the world gets snowed on and therefore there are lots of reasons to study snow. For instance, snow data are needed for hydrology, meteorology, agriculture, glacier mass balances, forecasting avalanches. If we list the requirements for all of these, I would, if I were competent enough, have a list which was outrageous. I have been asked not to be outrageous, and therefore I will not say that such measurements as the depth of dry powder snow, and the frequency and amplitude of moguls on the ski slopes are necessary and important uses of major remote-sensing experiments. Looking from the point of view of hydrology and its boundary with meteorology, we can see that remote sensing is going to give us answers that we desperately need and cannot obtain in any other way. I would say that most important is (i) time variations in area. This alone would be extremely valuable, and even better than that would be (ii) time and space variations in mass (water-equivalent) of snow. These are perhaps of highest importance. There are other similar areas of need, such as (iii) time and space variations in wetness -very important if you want to know whether the snow will provide run-off water, to provide soil moisture for crops, or to tell you what the integrated meteorological conditions have been.
There are many other things that we could talk about upon which I will not dwell, such as layering, of special importance in avalanche prediction, as is the thickness (I am separating this from mass, which is thickness times density), since the avalanche people need to know thickness change with time more than they need to know mass changes. Then there is surface roughness, very important meteorologically and from the point of trafficability, and crystal size distribution. All of these parameters are of importance to some large group of scientists or engineers.
Next we should also say that for this not to be outrageous, I should indicate the resolution needed. In time, from a hydrologie point of view, if we could have repeated measurements at 2-7 d intervals, this would be sufficient—obviously daily measurements would be even better, but 18 d intervals would be fairly good. This is about the interval required for the regulation of reservoirs in major river systems for instance. If it appears that snow-melt floods are in the offing, daily measurements become a requirement, but in general we do not need them often. A spatial resolution of too m (such as ERTS) is perfect—it is probably more than we need—and 1 000 m resolution would be satisfactory for most purposes if in the 1 000 m square we knew something quantitative about the snow cover in that area, e.g. what percentage is snow-covered. Finally, the reason for this 1 000 m requirement is because most users of snow data do not want detailed maps, they simply want numbers, e.g. the hydrologist wants to know that the mass of snow in the particular drainage basin is so-many cubic metres of water equivalent. He does not want to be presented with a detailed map of the snow. He may want to know that there are so-many cubic meters of water equivalent in a certain altitude region. but I think maps are over emphasized by many users of snow data. We want numbers to represent total volumes, areas, percentages, etc., and this may make the goals easier to obtain.
J. MARTINEC: Dr Meier has discussed whether snow maps are needed for hydrological evaluation, I think we must then distinguish between seasonal forecasts and short-term forecasts. I think Meier is right for seasonal forecasts, but for daily forecasts we really need a detailed picture, especially in rugged terrain, and in that case, perhaps the I 000 m resolution would not be adequate.
I also want to comment on the frequent reference here to the hydrological exploitation of remote sensing. The progress in technology and interpretation has been clearly demonstrated, but these data deserve proper hydrological evaluation. This can be achieved only when contacts between the specialist in hydrology and remote sensing are further improved.
A. W. ENGLAND: I would like to comment as a technologist in passive microwave radiometry. I think that the needs mentioned by Meier for time and space variation in mass and wetness might be amenable to this technique, as you well know. To solve the problems there are things we need better data on—specifically the size distribution, and I really mean the distribution not just the average size, as the difference in the fall-off at short wavelengths will be governed by the size distribution. We have been using one size and were surprised we were predicting such a steep fall-off. With a spread we will get a slower fall-off.
NYE: YOU mean that in order to interpret the remote-sensing data to obtain area, mass, and wetness, you need to know these “less important” things?
ENGLAND: Yes, though I doubt if we will ever get mass—I think given this information we could hope to give information on area and wetness, and we need also to know these data not just at one spot; we need some idea of the areal and temporal variations. If we develop the data for one spot and get a brightness temperature as a function of wavelength, we will want to know if the statistics of this will remain the same; we need to test the variability of parameters influencing this with altitude and time of year.
Another thing, which Dr Gloersen mentioned in the previous session, in the case of severe scattering such as occurs at short wavelengths: we only need to sample the upper 50 cm, but I do not think you can take the extinction coefficient and think in terms of skin depths, because the extinction coefficient is just a measure of how one parcel of radiation is scattered, but it is bounced about and can still come out at the top. In fact in Rayleigh scattering hall of it is forward scattering when first scattered, so it is a kind of diffusion problem, and in the modelling I have done, I have found there is very little difference in sensitivity to a buried layer as you add scatterers.
D. F. PAGE: Active microwave systems can give quite a bit of information about the structure of snow layers, but there is one basic problem, because in order to measure the mass, or even the depth of the snow, we have to know the dielectric constant so as to calculate the velocity of propagation, and this is a function of the density of the snow cover. We therefore really need further information to use active microwave techniques in order to calculate the mass.
ENGLAND: There may be a possibility once the snow gets wet of using a combination with passive to get the water content and get the dielectric constant from that.
PAGE: I think there is a real possibility worth exploring of using active and passive microwave techniques together.
P. GLOERSEN: I do not share Dr England’s pessimism on the possibility of measuring snow depths by passive microwave techniques, particularly if the wavelengths used are short enough- I admit there are problems as we indicated with the model studies; 1 think we must agree that such studies are in their infancy and we really need more experimentation. Our studies indicate there is some possibility of measuring snow depth, though how well that can be done remains to be seen.
R. VICKERS: If Dr England is going to give us mass and wetness given structural details, I would offer part of these details if someone would give mc the rest. I think density is really the missing parameter here every time. When we are talking about active radar, for example, we would determine the relative layering within a snow pack without knowing the absolute depth of the pack. Somebody else would have to give us the depth in order to determine where the layers were, but we could determine the presence and extent of layering. We could also determine, I think, with something like a laser profilometer technique, the surface roughness. I do not see any way right now easily to determine crystal size distribution.
Density is a different problem; what comes out in active radar experiments is of course a combination of density, depth, and relative dielectric permittivity. If somebody could give us frequent depth measurements, radar would, in principle, give you the density, or vice versa. And I should preface that remark by saying that it applies at present only to dry snow, which is a limitation. I would endorse the suggestion that we concentrate on a combination of active and passive techniques; I do not think this has received nearly enough attention in the past.
W. F. WEEKS: I think we have to remember that the variations Dr Meier refers to are variations over very broad areas, with time intervals of days. Therefore the dielectric permittivity or density of the snow that you need will probably have to be obtained from some general correlation between say, the mean thickness of a snow pack and the average density. If you do not have some general sort of correlation working for you, if you need detailed information on every profile at every spot, then I think you are in trouble.
ENGLAND: I was not thinking that we would need to know it every time we did it, but we would need to know how much variability to expect so as to have some confidence in interpretation; in other words do it once so that we can say whether this is reliable. One further argument for the combined use of radar and passive microwave is the very low resolution of passive microwave compared to radar, and the ambiguity in, say, first-year ice with leads versus multi-year ice—radar would allow us to separate the two. The same might apply with trees or rock and snow.
Another comment: radar has two resolutions, the areal resolution and the grey-scale resolution. The latter is not often talked about. In terms of particular radars, many of these have been developed just to enhance contrast, and they do not have very good grey-scale resolutions. I do not think we really know what wavelengths in radar are sensitive to different things in snow structure. I would like to see developed a multi-frequency radar, calibrated, and of high image and grey-scale quality, so we could really determine what we would see with radar. Many people have referred to things you can see with X-band but not with Ku-band, when the radar they have used in Ku-band was not of the same quality as the X-band.
NYE: Would anyone care to comment on whether the real need is for new hardware, or whether it is for deeper theoretical studies as to what the present hardware is sensing?
H. J. ZWALLY: What is needed is what Dr Gudmandsen has done in Greenland, that is a combination of a theoretical treatment and field measurements for situations where you know something about the snow conditions. Also, the idea of using active and passive microwaves combined to sort out some of the parameters has been proposed and tested recently in Greenland.
A. O. POULIN: I do not think we need more theory or instrumentation at the moment; we need more real-world data, intelligently collected, that can be correlated with any of a number of sensors. That is the hardest, and possibly the most expensive, need to satisfy.
E. L. LEWIS: I would like to make a very general comment that applies to snow or any other substance we are trying to investigate. We operate time-lapse cameras looking at snow fields, icebergs, glaciers, etc., and if you overflew the area with your satellite, presumably subsequently you could coordinate the two forms of information with quite a bit of structural information which would enable you to interpret remote sensing in terms of the area, mass, and wetness. You can set it up to cover quite a fair area and you can get some information about surface roughness, by photographing about twenty stakes you can get some sort of distribution of the thickness, admittedly a bit subjectively when you pick the field of view, and I suggest that if you looked at the history in a lime-lapse movie, you might be able to infer something about the layering.
S. I. OUTCALT: 1 would just like lo make a rather general comment which is not directly on remote sensing but it is on the issue of using the satellite as an interrogation device. The hydrology problem is getting information from rather inaccessible points, particularly in winter in low-altitude mountain areas, to some central location at reasonable speed. The point sensors have all been worked out, and a lot of our ERTS outputs are placed where they are only a couple of hundred feet from telegraph wires, and 1 think mountain hydrology is an excellent use for this.
Glaciers and ice sheets
W. S. B. PATERSON: If my list seems outrageously long compared with Dr Meier’s, I would point out that most of these are one-shot measurements; there is no question of us wanting them every 4-7 d or even once a year. In preparing this list I have not presumed to think of all the studies that possibly could be done on the basis of which remote sensing might be useful, I have taken the much easier course of dealing only with my own programme and what might be useful to what I am doing. In justification of this I would say that what I am doing is fairly conventional and so I hope that if it is useful to me it will be useful to most other people too. I am at present core-drilling to intermediate depths in polar ice sheets to study climatic history and also studying flow in these ice sheets. This is a project in which I think remote sensing can only be helpful. It does not entirely replace field measurements. If I had asked for any oxygen-isotope profile through a polar ice sheet, by remote sensing, then 1 think 1 would be considered outrageous. Most of the items in my list are self-explanatory, and some of them we know we can do anyway, so only a certain number need discussion:
-
1. Surface and bedrock contours.
-
2. Position of the equilibrium line.
-
3. Average accumulation rate (not snow as it falls-the average figure over some 50-100 a).
-
4. Surface temperature (what we want here is to take out the seasonal variations—a 10 m temperature is what we are really looking for).
-
5. Whether the basal ice is at the melting point.
-
6. Internal layers (such as the claim of Dr Reference GudmandsenGudmandsen (1975, p. 98) to be able to identify Wisconsin ice in Greenland. This would be an enormous help in planning drilling).
All of these are things you want over a large area in order to help you to select where is the best place to put your bore hole; having decided that, the next seven are items you want only in the area surrounding your bore hole, to help interpretation of the bore-hole studies.
-
7. Bed roughness (one way of getting this would be a map of the bedrock on a small scale; almost equally useful, and less ambitious would be a roughness parameter. One must indicate scale, and I have put > 1 m on the general principle that in cold ice sheets it is the plastic deformation that is important there being no regelation).
-
8. Horizontal velocity at the surface.
-
9. Sliding velocity (if the ice is at the melting point at the bottom).
-
10. 10. Vertical strain-rate, preferably as a function of depth (a bit ambitious, but very useful for time-scale calculations, it is much better to measure it than calculate it).
-
11. 1l. Thickness of any basal debris layer (this would help you to know whether your drill has got to the bottom or not).
-
12. 12. Mean ice temperature (as distinct from surface and bed temperature).
-
13. 13. Water content (on temperate glaciers).
NYE: We must not forget that remote sensing will show us things that we never thought even existed—we might not have thought of crevasses on the bottom side of the Ross Ice Shelf, or subglacial lakes in Antarctica. That is a defect of the scheme I have used to organize the discussion, and should be borne in mind. Others may wish to add to the list.
W. F. BUDD: I would like to add something mentioned in Dr Bentley’s paper, which concerns the anisotropy of the ice, particularly in ice sheets. I understand this can be measured by several techniques at present but they are all laborious and slow (including deep-hole seismic velocity profiling, bore-hole core studies, polarization studies in radio-echo sounding). Anisotropy is very important in the flow law (a factor of perhaps 2 5 or something of that order) and is understood to be of large extent. Can one develop something that could be done automatically, say by aerial sounding, so it could be studied on a large scale?
P. GUDMANUSEN: It is not certain whether we can do it from the air, but when we get the new remote-sensing aircraft, it will be fitted with orthogonal antennae in an attempt to measure polarization change, but one has to recall a difficulty; bedrock also gives a depolarization, so it will be difficult to ascertain whether what is measured is due to anisotropy or roughness, so we will have to combine this analysis with the roughness question, which may be difficult to do from the air.
M. V. BERRY: In my talk on Monday, I stated that no information about bed roughness could be inferred by measuring the spatial fading of the echo. 1 was followed by Oswald, who described how he had used the spatial fading of the echo to measure bed roughness. I think the subsequent discussion between us may have confused some people and I would welcome a few moments to outline the way in which Oswald and I have resolved this disagreement. Cine had the echo wave function, from which one constructed the echo envelope and then averaged it. One way of measuring the bed slope ß is by making measurements on the tail of the echo, and this was used by Oswald. The echo envelope at any given time delay, for example the time delay for which the envelope is on average a maximum, is something which fluctuates as you move the echo-sounder. The fading rate depends on the time delay which one chooses to make the measurement, and generally the fading rate increases with increasing delay. The point I was making is that the fading-rate function is independent of the rough surface characteristics provided this echo has a long tail. The form of the echo, and especially the time at which its maximum value occurs, does depend on the form of the rough surface, and particularly on the slope ß; for example with reasonable justification one can assume that most of the scattering comes by specular reflection from the root-mean-square slopes. This gives a connection between the slopes and the time delay; so if one measures not the spatial fading as a function of time delay, but the spatial fading as a function ofthat time delay at which the maximum echo is received, then this does depend on the slope, and does give a way of finding the slope.
The situation is further complicated by a splendid example of the law of perversity of Nature which says that any case one thinks is very special and will only occur occasionally is likely to be the dominant one. That is what has happened this time: we are not dealing here with echoes of long duration, and that means that three corrections have to be applied to this procedure. They have all been done, and we have understood thoroughly in the discussion this week exactly how they must be carried out. It would waste too much time to go into this in detail, but the upshot is that one can use spatial fading to measure this root-mean-square slope, but of course that is not new information—one can get the root-mean-square slope by looking at the tail of the echo. If one has two methods for getting the same quantity and one knows that in principle these should lead to the same answer, one wants to know which is the more convenient to apply in practice and it seems clear to me that if the echo had a long tail, one can identify that tail, and it is extremely easy to measure the rate at which that tail decays, and use that to measure the slope. However, in the case which Oswald considered, the echo does not have a long tail, and it is very hard to discriminate the tail from the shape of the original pulse, and he quite rightly attaches little reliability to that method of measuring roughness in his case. Therefore I think that in his case the method using spatial fading is the best way of measuring the slopes. Of course, spatial fading really comes into its own to measure quantities which one could not get in any other way, such as movements relative to the ice rock interface, as Walford and Doake have shown.
Another possibility which Oswald has suggested is that spatial fading should be a very sensitive indicator of anisotropy of bedrock roughness; e.g. if the bedrock consists of ridges, if one moves parallel to the ridges there will be no spatial fading, whereas if one moves perpendicular to the ridges there will be; so one suggestion is that we should measure the anisotropy of the spatial fading with respect to different directions of movement of the radio-echo sounder.
NVE: Has Mr Oswald any tiling to add to that?
G. OSWALD: NO. Dr Berry and 1 have worked out a fairly unified expression of what we have been discussing this week. With reference to the last point about the anisotropy of the bedrock, if we combine measurement of the exact time delay of the echo with its fading rate, we should be able to get some information about the anisotropy of the bedrock.
G. DE Q. ROBIN: If we have two methods of measuring one quantity such as bottom slope, I do not think the first thing you do is to choose the simpler method to measure the final result— you try both methods and see if they give the same answer. In our early experiments in 1969 we did that.
BERRY: Provided of course the model which models the bed has one dominant slope. This may not be correct; there may be several sorts of roughnesses.
NYE: Dr Berry in his paper made the distinction between “geography” and “roughness”. Large-scale topography he calls geography, and on that you have little wiggles which he calls roughness. Nature may be as simple as that, but I personally believe it is not, and that the distinction between geography and roughness is a gradual one. It is my impression that there is still an area of theory here to be filled in; Dr Berry’s treatment really would be fine if geography were quite separate from roughness, but if it is not, it seems to me there is still quite a bit of work to be done.
BERRY: I would agree completely with that, it is a very difficult problem and I think somebody should tackle it. 1 am trying to do it; I have not been able to solve it so far—the problem is how the instrumentation picks its own scale, which we call “geography” in the cases where Nature does not provide a suitable distinction of scales.
I. M. WHILLANS: 1 think one thing omitted from the list is how to obtain an understanding of accumulation records. We really have a very poor understanding of why that much snow accumulates each year. Part of this problem is meteorological, but the balance also includes the effects of drifting, and if you are really trying to reconstruct climate, or past mass balances, you have got to know what changes affect mass balance.
J. W. GLEN: There is one remote-sensing technique which has been discussed which would appear to offer a packet of information which on the “if A then B” principle might be useful.
I refer to the one which appeared to differentiate between great areas of the Antarctic ice sheet, (Gloersen and Salomonson, 1975, p. 382), that is to say the variation of emitted radiation with wavelength, which appeared to be saying something about a brightness temperature, which combined with an infrared temperature (which putatively was called the temperature) gave an emissivity, but it was varying over an area which most people think is rather uniform, and they therefore suspect it is something to do with grain size. We were talking over this at lunch and Dr Budd was saying that he did not really think that the snow that fell over Antarctica was all that different from place to place, and if it is not, the grain size ought to be about the same. However, it is metamorphosing as it goes down, and if at some places there is less accumulation than others, then presumably grain size grows rather faster with depth because it is behaving similarly with time, so that what you may be measuring with these emissivity curves is accumulation. Has that gone too far? Is that too wild?
MEIER: Whether it is wild or not, it is very interesting that the areas of very high accumulation on the Antarctic ice sheet, especially near the base of the Antarctic Peninsula, appear extremely warm in the brightness-temperature image in contrast to other areas of similar temperature.
ROBIN: The reverse is also true -the areas of very low accumulation also appear cool and there is a strong correlation also that way round.
ZWALLY: We have done some comparison of overlays of some of the accumulation data with the emission and there is a rough correlation, but we have not as yet separated out the temperature variation.
GLOERSEN: Dr Mock at CRREL has done this for somewhat similar patterns on Greenland, where the relationship between accumulation-rate patterns and the brightness-temperature patterns are not all that good, but again the physical temperature variation enters in. There is of course no guarantee that the accumulation patterns are known all that accurately either.
BUDD: The parameter one wants, as I understand it, is the rate of change of crystal size with depth. That depends on the crystal size at the surface, the accumulation rate, and the temperature, which controls the rate of change of crystal size with time. The accumulation rate and temperature tend to have an opposite effect. As you go inland in Antarctica and Greenland the accumulation rate goes down and the temperature also goes down, so the rate of growth of crystal size is slower, so at the same size you have older crystals but a smaller depth, but if we have data on the crystal size at the surface, which I think we have, we can make an ad hoc guess at the rate of change of crystal size with depth down to some 2 m over Antarctica which could perhaps be tested against the microwave data.
ZWALLY: I would like to add to the list the measurement of the mass balance of the ice sheets. The technique would be radar altimetry from satellites. Dr Robin has proposed the use of this technique for measuring the surface topography to an accuracy of about 10 m, but the U.S. is now developing radar altimeters for the measurement of the sea surface topography to an accuracy of some tens of centimetres. If this technique can be adapted to measure the topography of the ice sheet to an accuracy of about 1 m, you would have a measurement roughly to about 1: 1 000. If you repeated this measurement in ten years you would have a measurement of change to 1: 104 over a decade. It would also allow you to check particular regions of the ice sheet which you thought might be undergoing significant changes.
ENGLAND: This might be a good place for our group to apply some pressure, because I checked on GEOS-C which is the first one that will be doing this kind of thing, and the circuit parameters in there are set up so it will not lock up with anything but water, and so it will not follow the ice.
ZWALLY: There are some technical problems. You will not get as high a signal-to-noise ratio because you are reflecting from the snow surface. Also a serious problem is that the radar altimeters that are going up on GEOS-C and SEASAT only go to about lat. 65° and 72°. What is needed is a polar orbiting instrument later on which has the parameters suitably changed for measuring the snow surface.
ENGLAND: There is also another parameter which is quite wrong; there is a certain tracking rate with which it can track a change of level, which I think limits it to about 2°. If anything changes faster than that it loses its lock.
ZWALLY: I have checked that, I think that is all right.
R. D. WATTS: NOW that we have demonstrated that the apparent attenuation in temperate ice is not really attenuation but an effect of scattering, wc are in a position to start chasing down what to do with remote sensing in temperate ice as regards spatial and temporal variations of water content. We need a great deal of theoretical work so as to understand better how scatterers work in temperate ice, and more experimental work to find out the appropriate range of frequencies and polarizations for this type of work.
NYE: I got the impression that it is very difficult to distinguish between a pocket of water 1 m across and a cloud of small water droplets 1 m across—that you were not in any way getting directly the volume of water.
WATTS: If you do an experiment at a single frequency I believe that is true, but by using a number of different frequencies; I think there is a good chance of discriminating between these two situations.
S. EVANS: I want to think about the type of temperate glacier soundings reported by Vickers and others. I have talked to Vickers about the distinction between accuracy and resolution. When I use the term “accuracy”, I am not talking about the absolute accuracy by which we know the dielectric constant, etc., but random errors of measurement. What I overlooked in the Scott Polar Research Institute when we were trying to measure temperate glaciers was that the random errors of measurement can be arbitrarily small if the signal is arbitrarily large, so that what the Stanford Research Institute group transmit is a waveform like (a) in Figure 2. Now obviously if you compare that with a received waveform which is identical in shape, you can measure the separation between them with arbitrarily high accuracy. One reason it may not be the same in shape is if it has some noise on it as in (b). That is the usual case, but what they were more concerned about was the resolution of one signal from another which is displaced slightly in time but not by as much as a pulse length. These could be separated by a similar technique if you correlate the received waveform with a delayed version of the transmitted waveform and plot a correlation function as a function of delay. This should have peaks corresponding to the different signal delays. I think this is all right with a few provisos: (i) The medium and correlator must both be linear over the range of echo powers you wish to measure in order to preserve the waveforms. The Stanford group have expressed surprise and relief that the medium itself is non-dispersive, so that different frequencies do not travel with different velocities to any extent and that does not distort the waveform, (ii) The medium could still have different attenuations at different frequencies. That would alter the waveform slightly and the wave-form (a) might change to a slower rise and fall as in (c) if the higher frequencies were more attenuated. One could still correlate, but the correlation coefficient would not go to unity.
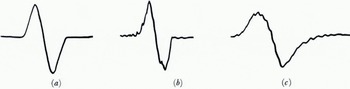
Fig. 2. Fig 2 (a) (b) (c).
This raises the question: if you can resolve echoes which are separated by less than the pulse length, why pulse at all? Why not use the continuous wave system, in a sort of Michelson interferometer? I think the answer is that you cannot encompass the enormous dynamic range between transmitted and received signal in the correlator. I doubt you could make it linear over such a vast range. I think the distinction is possibly not between accuracy of measurement of time delay and resolution (where they overlap), but between resolution and the minimum range you can measure.
R. VICKERS: I think all Dr Evans’ points are valid. We did indeed use high power to remove the noise problem, in fact we had three more orders of magnitude of power available that we did not use (megawatts and we used kilowatts). The distinction between accuracy and resolution is indeed a problem, and we did not really have the problem Dr Evans outlined, our problem was having two pulses coinciding and having to resolve between them. This occurs at minimum range. I have debated whether you can in fact achieve better than half a pulse length resolution with any system.
NYE: IS not the objection to using continuous waves that you sacrifice all possibility of discriminating between returns from different places?
EVANS: The only thing we measure in any pulse system is the difference in their time delays.
WATTS: I have participated in a continuous-wave experiment (Reference Strangway, Strangway, Simmons, LaTorraca, Watts, Bannister, Baker, Redman and RossiterStrangway and others, 1974), and the foremost problem is that you have to use non-directional antennas at these frequencies unless you are to have immense antenna arrays. Consequently if you are transmitting waves continuously, you are receiving simultaneously a wave which comes directly through the air, a wave which travels just beneath the ice surface, and a wave which comes from the bottom. If the bottom is at any substantial depth, its wave is completely swamped by the two surface waves, and consequently any interference between these two waves is very small in amplitude.
ENGLAND: Furthermore in the continuous-wave technique you receive coherent scattering from a volume rather than from a surface of the propagating wave as you do in the short-pulse technique.
MEIER: From the point of view of the flow of temperate glaciers, we need to know not only the roughness of the bed but also the presence of water at the bed. Are there any ways of using existing systems, or of analysing existing data, to say something about water al the bed?
R. TURPENING: Shear-wave seismology might help. If you can generate shear waves to propagate in the bedrock, you will get no returns to the surface if there is water above the bedrock. We have used this technique in locating flooded coal mines, where we can locate water 1 m thick.
NYE: In glaciers we have to deal with much thinner layers, 1 cm, r mm, or so on. Will it then work?
TURPENING: If it is a continuous layer of water, no matter how thin it is, it cannot support any shear and no wave will be propagated through it.
WATTS: Then it cannot support a glacier either.
GLEN: It can float! Provided it is touching at a relatively small number of points. Is this not the model some people have anyway for the bed at the bottom of a glacier? I imagine these few points would hardly transmit much intensity of shear waves, but what do the seismic people think? If 5% of the area was in contact with solid and rest was on water, what would you get?
TURPENING: You would get a very small amount of shear energy on the surface, and of course diffraction of shear wave energy around these points, and that would obscure the resolution of the edges. However I believe there are techniques for resolving those edges, just as there are in optics for resolving diffracting edges.
NYE: I think Dr Glen and 1 are thinking of different sorts of water on the bottom. I was talking about an exceedingly thin layer due to regelation of the glacier over the rocks, and the other possibility is ponded water in pockets. So far as the first layer is concerned, 1 would maintain that it does not support a shear stress.
OSWALD: 1 think a water layer more than about 1 m thick could be determined by radio-echo sounding, much as has been done for thicker layers beneath ice sheets.
ROBIN: You did not include temperature gradients on the list, nor the basal temperature unless it is at the melting point. I think particularly for deep Antarctic ice there may be a real hope of determining these from the way in which internal radio-wave reflections fall off near bedrock. Once we know more about the change of absorption and reflection coefficients with temperature in the deep ice, we may be able to deduce temperatures and temperature gradients at great depths.
Also, in deep sounding we are interested in finding what is under the ice sheet as well as studying the ice itself. We therefore ought to include decent magnetometry in our aircraft, and eventually other things, such as perhaps gravity.
PATERSON: AS I understand it, most echo-sounders consider they are getting echoes off the bedrock, but Dr Doake seemed convinced he was getting reflections off boulders in the ice moving with it. Can the echo-sounders distinguish between these two cases?
M. E. R. WALFORD: No.
NYE: This looks like something in my “theory and understanding” box that may be susceptible to theoretical treatment.
GLEN: I suspect the subglacial geomorphology is also of interest. First just to see what it is like, and then hopefully in the future, to see it actually happening. After all a big ice stream might be eroding back at a measurable rate in a reasonable time—but is this not just in the area where “geography” is changing over to “roughness”, where you tell us therefore that there are lots of difficulties?
WALFORD: One interesting application of this might be the study of jökulhlaups. It was mentioned this morning that it is still not entirely clear how they operate, and I imagine the type of low-frequency radar we have been discussing might be used to monitor the depth of water in the caldera in Iceland.
GLEN: The Grimsvötn caldera seems an ideal place for seeing whether there is a subglacial extension of the lake which slowly moves down for some time before it explosively moves on. Is there a continuous build up of a large water body stretching on down the valley? That, surely, is a rather easier thing to look for than the normal subglacial or intraglacial plumbing which we would like to see, but is probably of the next order of difficulty.
Do either of these (subglacial gcomorphology, or the water body) sound do-able in current terms?
TURPENING: I think the water question is solvable today at the depth at which I imagine the phenomenon occurs. In regard to the earlier question of debris at the bed, we have all plotted P-wave travel-time curves at the bottom to see if there is a velocity change but have not had much faith in it. There may be some hope that if one plotted both P-wave and S-wave travel-time curves simultaneously, and if there was some change in both of them, then one might have a little more faith in the observation.
S.THORARINSSON: I would like to say how much I would like to see any attempt to measure water under Vatnajökull, in Grimsvötn and elsewhere, also to have some knowledge about the water collecting under Mýrdalsjökull where Katla may erupt possibly in a few years. This is becoming of great economic importance in Iceland, since roads running over the lowland plains are liable to be flooded.
Floating Ice
WEEKS: Basically what we want for floating ice is:
Thickness.
Movement.
Precise estimates of the different areas associated with different ice types (what one means here varies with location and purpose, for example thin ice types in 10 cm splits).
Geometry of ice (lead patterns or floe-size distributions in those few places where it looks like a granular material).
Anything related to the physical state of the ice (such as average salinity, temperature, strength, electrical properties, etc. One of the rare advantages of sea ice is that thickness is on average correlated with composition).
Surface and sub-surface roughness.
All of these would be desirable on a 2-7 d time scale; the spatial scale requirements vary, but for ice thickness the sensor should not see an area much larger than 5 m in diameter.
T. HUGHES: Can we ask about the junction between floating and grounded ice? Can we find where this happens? Dr Budd tells us that in such places it is difficult to get echoes from the bottom, and we may have a thin layer becoming thicker at the grounding line, gradually, perhaps, with the density of pinning points becoming less as the ice floes out to sea. Can we find anything out about that?
TURPENING: Given that we can work in the area, I suspect that in the very thin region, where you have a large number of pinning points, you would see an attenuation of the shear wave; it would be greater than you would expect from just the spreading attenuation at the ice sheet edge, and at some particular point you would see no more shear-wave energy arriving at the surface. You could get information that way.
PAGE: 1 would like to comment on the use of microwave techniques for floating ice. We feel that for fresh-water ice the problem of thickness measurement is more or less solved; we have an operational system of microwave high-resolution radar. But with sea ice the situation is really very complicated, though perhaps not quite as bad as with snow. We have now established that there is a fair amount of regularity in the dielectric properties of newer ice which we hope is utilizable to get the thickness of new sea ice. The fact that one can get returns from the bottom side has been demonstrated last winter in the Soviet Union by Bogorodskiy and Tripolnikov (see p. 473), but with multi-year ice we have problems of variable salinity. Is the thickness-salinity relation Dr Weeks mentioned applicable here?
WEEKS: NO, I was referring to first-year ice. There it really holds amazingly well (Reference Cox and WeeksCox and Weeks, 1974). Everybody’s data were plotted and gave a simple curve. For radar, might not the multi-year case be simpler? The salinity is very low, and the bottom surface is probably closer to a sharp boundary.
PAGE: The complication is that we do not know its salinity, so we do not know how to interpret the thickness measurement.
GLOERSEN: Do you really mean a resolution of 5 m?
WEEKS: Yes. Thickness measurements averaged over 100 m would be useless.
GLOERSEN: The best resolution you could hope to get from ERTS satellite data is 80 m, and I doubt if any satellite can give you better than 20 m without a severe sacrifice in area coverage and on a regular basis.
LEWIS: One problem which goes right through meteorology, oceanography, and glaciology is the exchange of energy between the ocean and the atmosphere. At high latitudes, 1% open water doubles this energy exchange; why we need a resolution of 5 m is to find how much open water we have got. This is enormously important because sea ice is the main dash-pot in the world’s climatic system.
GLOERSEN: I think to determine open water with a microwave system you do not really need that resolution because you can obtain concentration within the resolution cell simply by using an interpolation between (he solid and water values of the brightness temperature, and you can determine this to say ½% in proper circumstances (sec paper in the proceedings of the BESEX symposium).
NYE: I have just been talking to the ATDJEX people about this very problem, and they are not as optimistic about doing it that accurately.
E. R. POUNDER: The trouble is that in many situations you have not just water and ice but water and different kinds of ice.
GLOERSEN: That is true. This sort of determination would have to include knowledge of the seasonal temperature, and the nature of the ice. It is certainly more difficult if you have a mixture of multi-year and first-year ice. This gives an increased noise on your ice-concentration determination; it does not preclude this determination by any means. Lack of knowledge of the average surface temperature would also add difficulty, but an independent determination of this would improve one’s result.
BUDD: The way the Soviet investigators measured ice thickness was similar to that used for temperate glaciers, but they did have to work at analysing the return from the bottom, but it seems as though, at the frequency they used, it should be possible to gel an echo for both the surface and the bottom and by matching phase to get sufficient accuracy for thickness. As regards the effect of salinity, I believe they corrected for this by calibrating with a measured thickness salinity profile. Soon I think we may be able to get geodetic satellites with laser profiling to give the large-scale topography from which thickness distributions may be obtainable.
POUNDER: Do we know what resolution the Soviet group got? 16
BUDD: The thickness ranged from about 50 cm to a little over 2 m; the scattering length was about ±25 cm uncorrected, ±10 cm corrected. I am not sure of their horizontal resolution.
NYE: In the conference we have had quite a few papers about SLAR imagery, but I do not think they discussed the theory; you send a beam obliquely against the ice surface and it penetrates and gets scattered. Is there a theory of what SLAR shows us?
PACE: Yes, there is a theory which says that whether it is a reflection from the surface or from the volume of the target area depends on wavelength. I do not think it has been emphasized as much as it might have been that there is information in SLAR imagery at different wavelengths which it is worthwhile to study.
R. LARSON: In lake ice where there is a lot of penetration; it is clear that radiation penetrates into the ice to a depth of 1 m and can then scatter from the water-ice boundary. As the wavelength gets shorter this penetration will decrease, depending of course on the loss tangent, and with a very short wavelength (the shortest we used was the so-called X-band, 3.2 cm), the penetration is down to ≈ 20 cm, and with an order of magnitude further decrease in wavelength to about 4 mm, which can be done if there is sufficient motivation, you can get returns from the near-surface.
WEEKS: While we were flying last spring out of Barrow we also, purely by accident, obtained some imagery over the tundra where there are a large number of relatively shallow lakes. We found two colours of lakes in the radar, white and dark, and people who have been on the ground think the difference is due to whether or not the lake was frozen to the bottom. This indicates that X-band was penetrating almost 2 m through fresh-water ice.
BERRY: The theory of sideways looking radar is related to the theory given here by Clay (see Reference Berkson, Berkson, Clay and KanBerkson and others, 1973; Reference Clay, Leong and HamptonClay and Leong, 1974; Reference Kan, Kan, C. S. and BerksonKan and others, 1974) for sonar. Polarization effects need to be added. There is not nearly so much theory concerning polarization effects as regards echoes generally. There are some rudimentary theories on what we can infer from depolarization, but we lack a comprehensive theory of the effect of pulse length, wavelength, and especially different time delays.
LARSON: The system we have experience with does indeed record and image the depolarized return and there are a lot of unanswered questions here. The roughness determines a lot of the back-scatter in both like- and cross-polarizations but the dielectric permittivity of the material strongly affects the cross-polarization.
M. DUNBAR: One of the things we need worst is practical imagery of something which has been measured by other means so we know what we are looking at. It is probable we also need more theory, because the radar people give the impression they do not know either, because they know their instrument but not how it reacts with a material.
GLEN: I am not sure what has been done, but remote sensing, probably for extremely good reasons, normally seems to be concentrated on remote places, and this produces the effect that Dr Poulin and Mrs Dunbar have referred to—that you do not know what it is you are looking at anyway. Is there something to be said for trying the remote sensing in places where we know more about things underneath, snow cover not in the remoter parts of Alaska but, say, Switzerland; sea ice, not in Nares Strait but in somewhere like the Baltic?
DUNBAR: But sea ice in the Baltic is quite different. One needs both of these things.
POULIN: It follows the golden rule: He who hath the gold maketh the rule. Where the people who pay for it want the data is where you have got to get it.
LARSON: On the question of sea-ice observations by radar, there is not much reason to expect penetration. We are pretty sure our reflection is from close to the surface, unlike fresh-water ice.
WATTS: On SLAR images of sea ice, there is a shadow area away from the flight line from a pressure ridge. Can one not deduce the height of the ridge from this?
PAGE: Yes, I think it is possible to deduce heights, but I did not know that there were pressure ridges high enough for this to give the kind of accuracy you want.
DUNBAR: There is one problem; it is often not easy to see where the shadow of the ridge ends, because there is usually something else getting in the way. I think if the resolution is improved there will be more chance of identifying the end properly, but it is pretty difficult.
C. S. CLAY: Some of our experience in looking at back-scattering from the sea floor and sea surface may be relevant to SLAR images. We found that small wind ripples can give a tremendous amount of back-scatter and at the same time a large swell gave us no back scatter. We also found that going over a bed of rippled sand in one direction we have large back-scatter; looked at orthogonally there is virtually no back-scatter. All of this is pretty well handled theoretically by including the possibility of ridges in the scattering function. If we have ridges in one direction and none in another we may get large scattering in one direction and virtually none in another. R. K. Moore of the University of Kansas suggested surveying in orthogonal directions.
POULIN: That has been done by the Coast Guard, and they found exactly that result: the ridges gave very strong signals when parallel to the flight track, and very commonly were not apparent at all when perpendicular to the flight track.
ENGLAND: TO achieve this without two flights one can squint the radar forward and backward to get both in one flight.
Ground Ice
V. SCHYTT: In order to start the discussion I shall list some rather obvious things: Areal extent of (a) permafrost, (b) seasonal frost.
These are not wanted at very frequent intervals, though perhaps more frequently than Dr Swithinbank’s hundred years.
Thickness of (a) permafrost, (b) seasonal frost, (c) active layer. Identification of buried ice masses.
A lot of this could be done by seismic and resistivity work, and has been so done, but are there any applications of radio methods that could be used? For example we often want to establish how much ice there is in end moraines and how it is disposed. Are there any new methods for that?
HUGHES: I would like to add temperature profile in permafrost, also some way to sense the relative composition of permafrost with depth.
MEIER: I also feel we need to identify not just big ice masses, but also the ice content of frozen ground.
J. CLOUGH: Buried ice masses have been studied by a radar technique. This is a mono-pulse radar system operated on a contract basis in the Arctic, in which buried ice masses have been successfully identified by profiling both natural and experimentally constructed ice masses in the permafrost.
ROBIN: There is a reference in my review paper to a suitable technique for this work described by Vickers and Rose. Bertram, Campbell and Sandler’s paper “Locating large masses of ground ice with an impulse radar system” appeared in the Proceedings of the Eighth International Symposium on Remote Sensing of the Environment.
POULIN: I thought someone at CRREL had obtained results with tilt-wave methods on ground ice.
WEEKS: Yes, P. Hoekstra has done a considerable amount of work on this recently in conjunction with the people from ßaringer out of Toronto, but I do not know all the details. Apparently they have been very pleased with the method, particularly in certain permafrost situations.
PAGE: We have an experimental programme arranged in the coming winter in which, in conjunction with some of our sea-ice work, a lower frequency version of the type of impulse radar I described will be used with the Geological Survey of Canada to study permafrost as there is a large user interest in this.
NYE: I think we should not infer from the lack of discussion on this topic that it is not an important aspect of remote sensing of ice, only that there do not happen to be present here the people for whom this is a speciality.
Admin.
LARSON: I want to discuss possible developments in imaging radar. I think we have here all the experience to deal with the conventional sideways looking system. 1 would like to mention some things that are in development. If we can get relative calibration of the rays there are a lot of interesting possibilities. We have in our system, for example, four channels and they can be calibrated relative to one another to a very fine degree. To help with absolute calibration, a lot of information can also be gained by knowing what the absolute value of the back-scatter coefficient is for a given resolution path on the imagery, and this adds a third dimension to the whole scene, and I think will be very valuable in interpretation of data, particularly in terms of depolarization, where you can get a quantitative measure of depolarization.
There is also an experimental form of radar already existing that will provide an image in a down-looking mode in the same way as microwave and infrared passive scanners and photography, and this is very well adapted to a multi-sensor approach. I am sure combining sensors will be an important way forward.
R. S. WILLIAMS, JR.: I think you implied that users fall into two broad groups: the operational users who need satellite data quickly because it is tied into something, like Dr Meier’s discussion of snow-melt users who need the data before they make a decision, and where the speed factor becomes important; then there is the other body of users, which probably includes most of the people in this room, who are using the data retrospectively and speed is not essential. In both cases there has to be some sort of archiving of satellite data, so that the enormous expense that goes into the instrumentation and data acquisition is not just thrown away. For this there must be some system set up such as the Canadian one with its “quick-look” for access to ERTS imagery, and where the system is designed to do just that. Beyond this with the ERTS system you do have archiving. In particular, however, going through the EROS Data Centre takes some time as you all know, although we are working hard to reduce the turn-around time and also to create a U.S. “quick-look” system.
When we come to other systems such as NOAA-2 or any of the NASA satellites, it is very difficult to get hold of the data. You can get some if you are patient, but there are limited staff, etc. and the tape is destroyed after about 14 d. All you then have is imagery. I think that over a period of time there must be some way for an international archiving of these data, since it is extremely important for global studies that a base-line be set up and we can refer back to data acquired in the past. For example, for global climatology, snow cover at high latitude in summer, and environmental degradation on the global basis, there has to be some sort of archive for the data, and some way of retrieving it quite easily whether it be for the retrospective study, or for decision making.
BUDD: The main feature of this is that we must accept some sacrifice of data because of storage problems within the preservation of the essential. One way would be to destroy after a certain time but to collect and process for integrated and average values over appropriate periods, such as monthly averages and totals. If the data bank is built up on this basis, storage problems are reduced, but some information is kept to test climatological ideas.
NYF.: I do think we have had an exceptionally interesting discussion and I hope and believe a productive one.


