1 Introduction
Stimulated Raman scattering (SRS) in optical fiber provides a convenient and practical mechanism for wavelength conversion, allowing the generation of laser sources at wavelengths which cannot be generated directly by rare-earth-doped fiber lasers[Reference Malinowski, Vu, Chen, Horak and Richardson1]. Benefiting from the strong confinement and the long interaction length of optical fibers, SRS-induced Stokes light can be generated efficiently with just a single pass through a section of optical fiber[Reference Chen, Chen, Jiang, Yin and Hou2]. Generally, a pulse propagating in an optical fiber will generate light of several Stokes wavelengths since all parts of different instantaneous power are simultaneously involved in the frequency conversion process[Reference Guo, Zhu, Chen, Xu, Duan, Xu and Tang3]. However, Malinowski and Chen et al. reported the selection of individual Stokes wavelengths with high conversion efficiency by spatially coupling into actively shaped flat-topped pulses generated by a fiber master oscillator power amplification (MOPA) system[Reference Chen, Alam, Codemard, Malinowski and Richardson4]. The MOPA system consists of a directly modulated semiconductor diode as a seed laser, two stages of Yb-doped fiber pre-amplifiers and one stage of power amplifier, allowing a pulse peak power well in excess of the Raman threshold[Reference Vu, Malinowski, Richardson, Ghiringhelli, Hickey and Zervas5].
Chang et al. theoretically predicted the existence of dissipative soliton resonance (DSR) in which the pulse energy can increase indefinitely alongside the pulse width with a constant peak power. Since then, experimental phenomena were realized in many single-pumped figure-of-eight cavities[Reference Ahmad, Aidit, Ooi and Tiu6, Reference Ahmad, Aidit and Tiu7]. Interestingly, utilizing the configuration of a dual-pump figure-of-eight cavity based on nonlinear amplifying loop mirror (NALM) as the saturable absorber, the peak power and width of the DSR pulse can be tuned continuously by the amplifiers in two separated loops[Reference Mei, Chen, Xu, Zhang, Gu, Sun and Wang8, Reference Semaan, Braham, Fourmont, Salhi, Bahloul and Sanchez9]. Thus, it is possible to obtain peak power tunable rectangular pulses well in excess of the Raman saturable power based on this simple and controllable configuration. In this regime, the stimulated Raman wavelength can be chosen by the peak power of DSR while the strength of the chosen wavelength is theoretically supposed to be controlled by the pulse duration. Compared with typical solitons, it is possible to convert most of the energy to the selected wavelength by controlling the peak power of the square-shaped DSR pulse.
In this paper, we report the excitation of individual Raman Stokes lines of up to fifth order with relatively high extinction ratios pumped by rectangular peak power tunable DSR pulses. The simplified all-fiber Raman-lines-converting structure reduces the required peak power threshold of seed pulses. A detailed description of the easily available 1030 nm DSR fiber laser and Raman conversion section will be provided in Section 2. Sections 3 and 4 focus on the characteristics of DSR pulses and output Raman spectra, while conclusions will be drawn in Section 5.
2 Experimental setup
A fully fiberized Raman-lines-converting system consisting of a peak power tunable DSR laser as a pump source and 1 km-long single-mode fiber is shown in Figure 1.
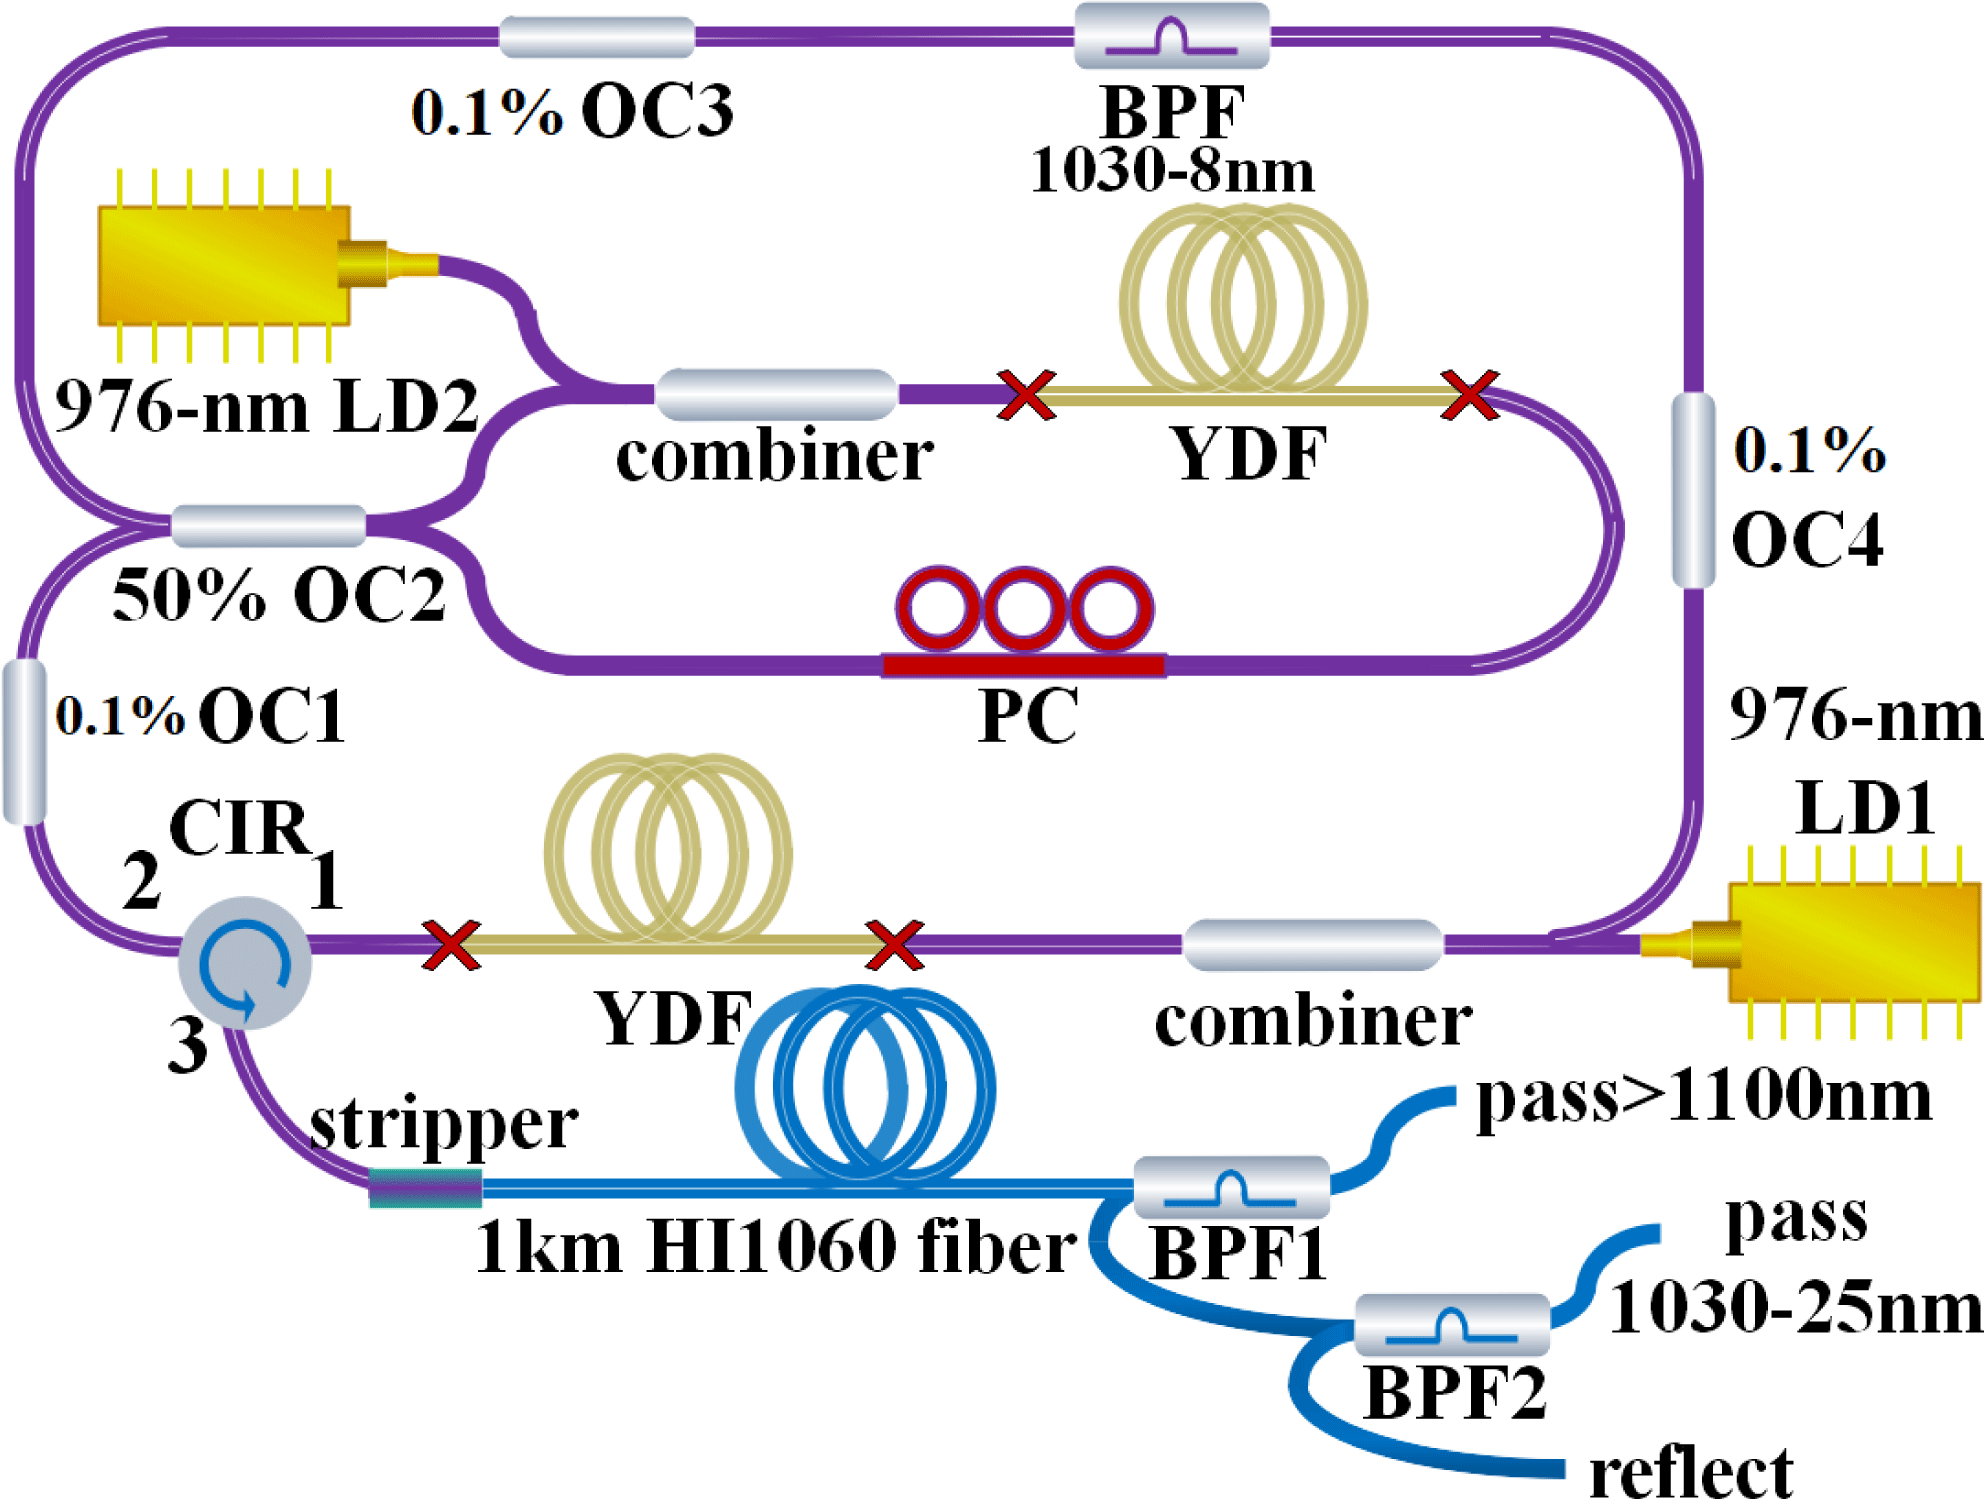
Figure 1. Schematic configuration of the peak power tunable DSR laser and Raman converter. YDF: Yb-doped double-clad fiber; LD: laser diode; PC: polarization controller; BPF: bandpass filter; OC: output coupler; CIR: circulator.
The laser cavity contains a unidirectional loop and an NALM, which are connected by a 50% fiber coupler (OC2). The pigtails of all components, the ytterbium-doped fiber (YDF) and the passive fiber are all
![]() $10~\unicode[STIX]{x03BC}\text{m}$
-core-diameter large-mode-area fibers to alleviate nonlinearity, thus enabling a high pulse energy. Using 976/1030 nm pump-signal combiners, two pieces of 2 m YDF are cladding-pumped by two laser diodes (LD1 and LD2) with maximum output powers of around 25 W and 8 W, respectively. The circulator (CIR) acts as an isolator and an output coupler simultaneously. The bandpass filter (BPF) centered at 1030 nm is utilized to impose spectrum loss and select the central wavelength of the pulse. Three
$10~\unicode[STIX]{x03BC}\text{m}$
-core-diameter large-mode-area fibers to alleviate nonlinearity, thus enabling a high pulse energy. Using 976/1030 nm pump-signal combiners, two pieces of 2 m YDF are cladding-pumped by two laser diodes (LD1 and LD2) with maximum output powers of around 25 W and 8 W, respectively. The circulator (CIR) acts as an isolator and an output coupler simultaneously. The bandpass filter (BPF) centered at 1030 nm is utilized to impose spectrum loss and select the central wavelength of the pulse. Three
![]() $0.1\%$
optical couplers (OC1, OC3, OC4) are placed after the amplifier, the NALM and the BPF separately, for pulse detection. Adjusting the PC helps to achieve the mode-locking state. The total cavity length is about 33.5 m, with a net dispersion of
$0.1\%$
optical couplers (OC1, OC3, OC4) are placed after the amplifier, the NALM and the BPF separately, for pulse detection. Adjusting the PC helps to achieve the mode-locking state. The total cavity length is about 33.5 m, with a net dispersion of
![]() ${\sim}0.68~\text{ps}^{2}$
. The dual-pump figure-of-eight cavity offers great flexibility in varying the pulse duration and peak power by adjusting the two LDs in each ring. The 16 m-length of NALM could be favorable to generate standard square-shaped DSR pulses of nanosecond duration. After pump dumping by the stripper at the splicing point, the DSR pulse is launched into 1 km HI1060 fiber to excite Raman Stokes lines. In order to remove the leakage from a mismatch splice, the stripper is used between the
${\sim}0.68~\text{ps}^{2}$
. The dual-pump figure-of-eight cavity offers great flexibility in varying the pulse duration and peak power by adjusting the two LDs in each ring. The 16 m-length of NALM could be favorable to generate standard square-shaped DSR pulses of nanosecond duration. After pump dumping by the stripper at the splicing point, the DSR pulse is launched into 1 km HI1060 fiber to excite Raman Stokes lines. In order to remove the leakage from a mismatch splice, the stripper is used between the
![]() $10~\unicode[STIX]{x03BC}\text{m}$
-core-diameter circulator pigtail and the
$10~\unicode[STIX]{x03BC}\text{m}$
-core-diameter circulator pigtail and the
![]() $6~\unicode[STIX]{x03BC}\text{m}$
-core-diameter HI1060 fiber, thus preventing overheating by the propagation of cladding light through the 1 km HI1060 fiber. A BPF1 with a cutoff wavelength at 1100 nm and a BPF2 centered at 1030 nm with a bandwidth of 25 nm are connected at the end to separate the transmitted pulse into three different wavelength bands: more than 1100 nm, 1010 to 1050 nm and 1050 to 1100 nm, respectively.
$6~\unicode[STIX]{x03BC}\text{m}$
-core-diameter HI1060 fiber, thus preventing overheating by the propagation of cladding light through the 1 km HI1060 fiber. A BPF1 with a cutoff wavelength at 1100 nm and a BPF2 centered at 1030 nm with a bandwidth of 25 nm are connected at the end to separate the transmitted pulse into three different wavelength bands: more than 1100 nm, 1010 to 1050 nm and 1050 to 1100 nm, respectively.
3 Peak power tunable square pulse generation
The characteristics of the DSR laser are depicted in Figure 2.
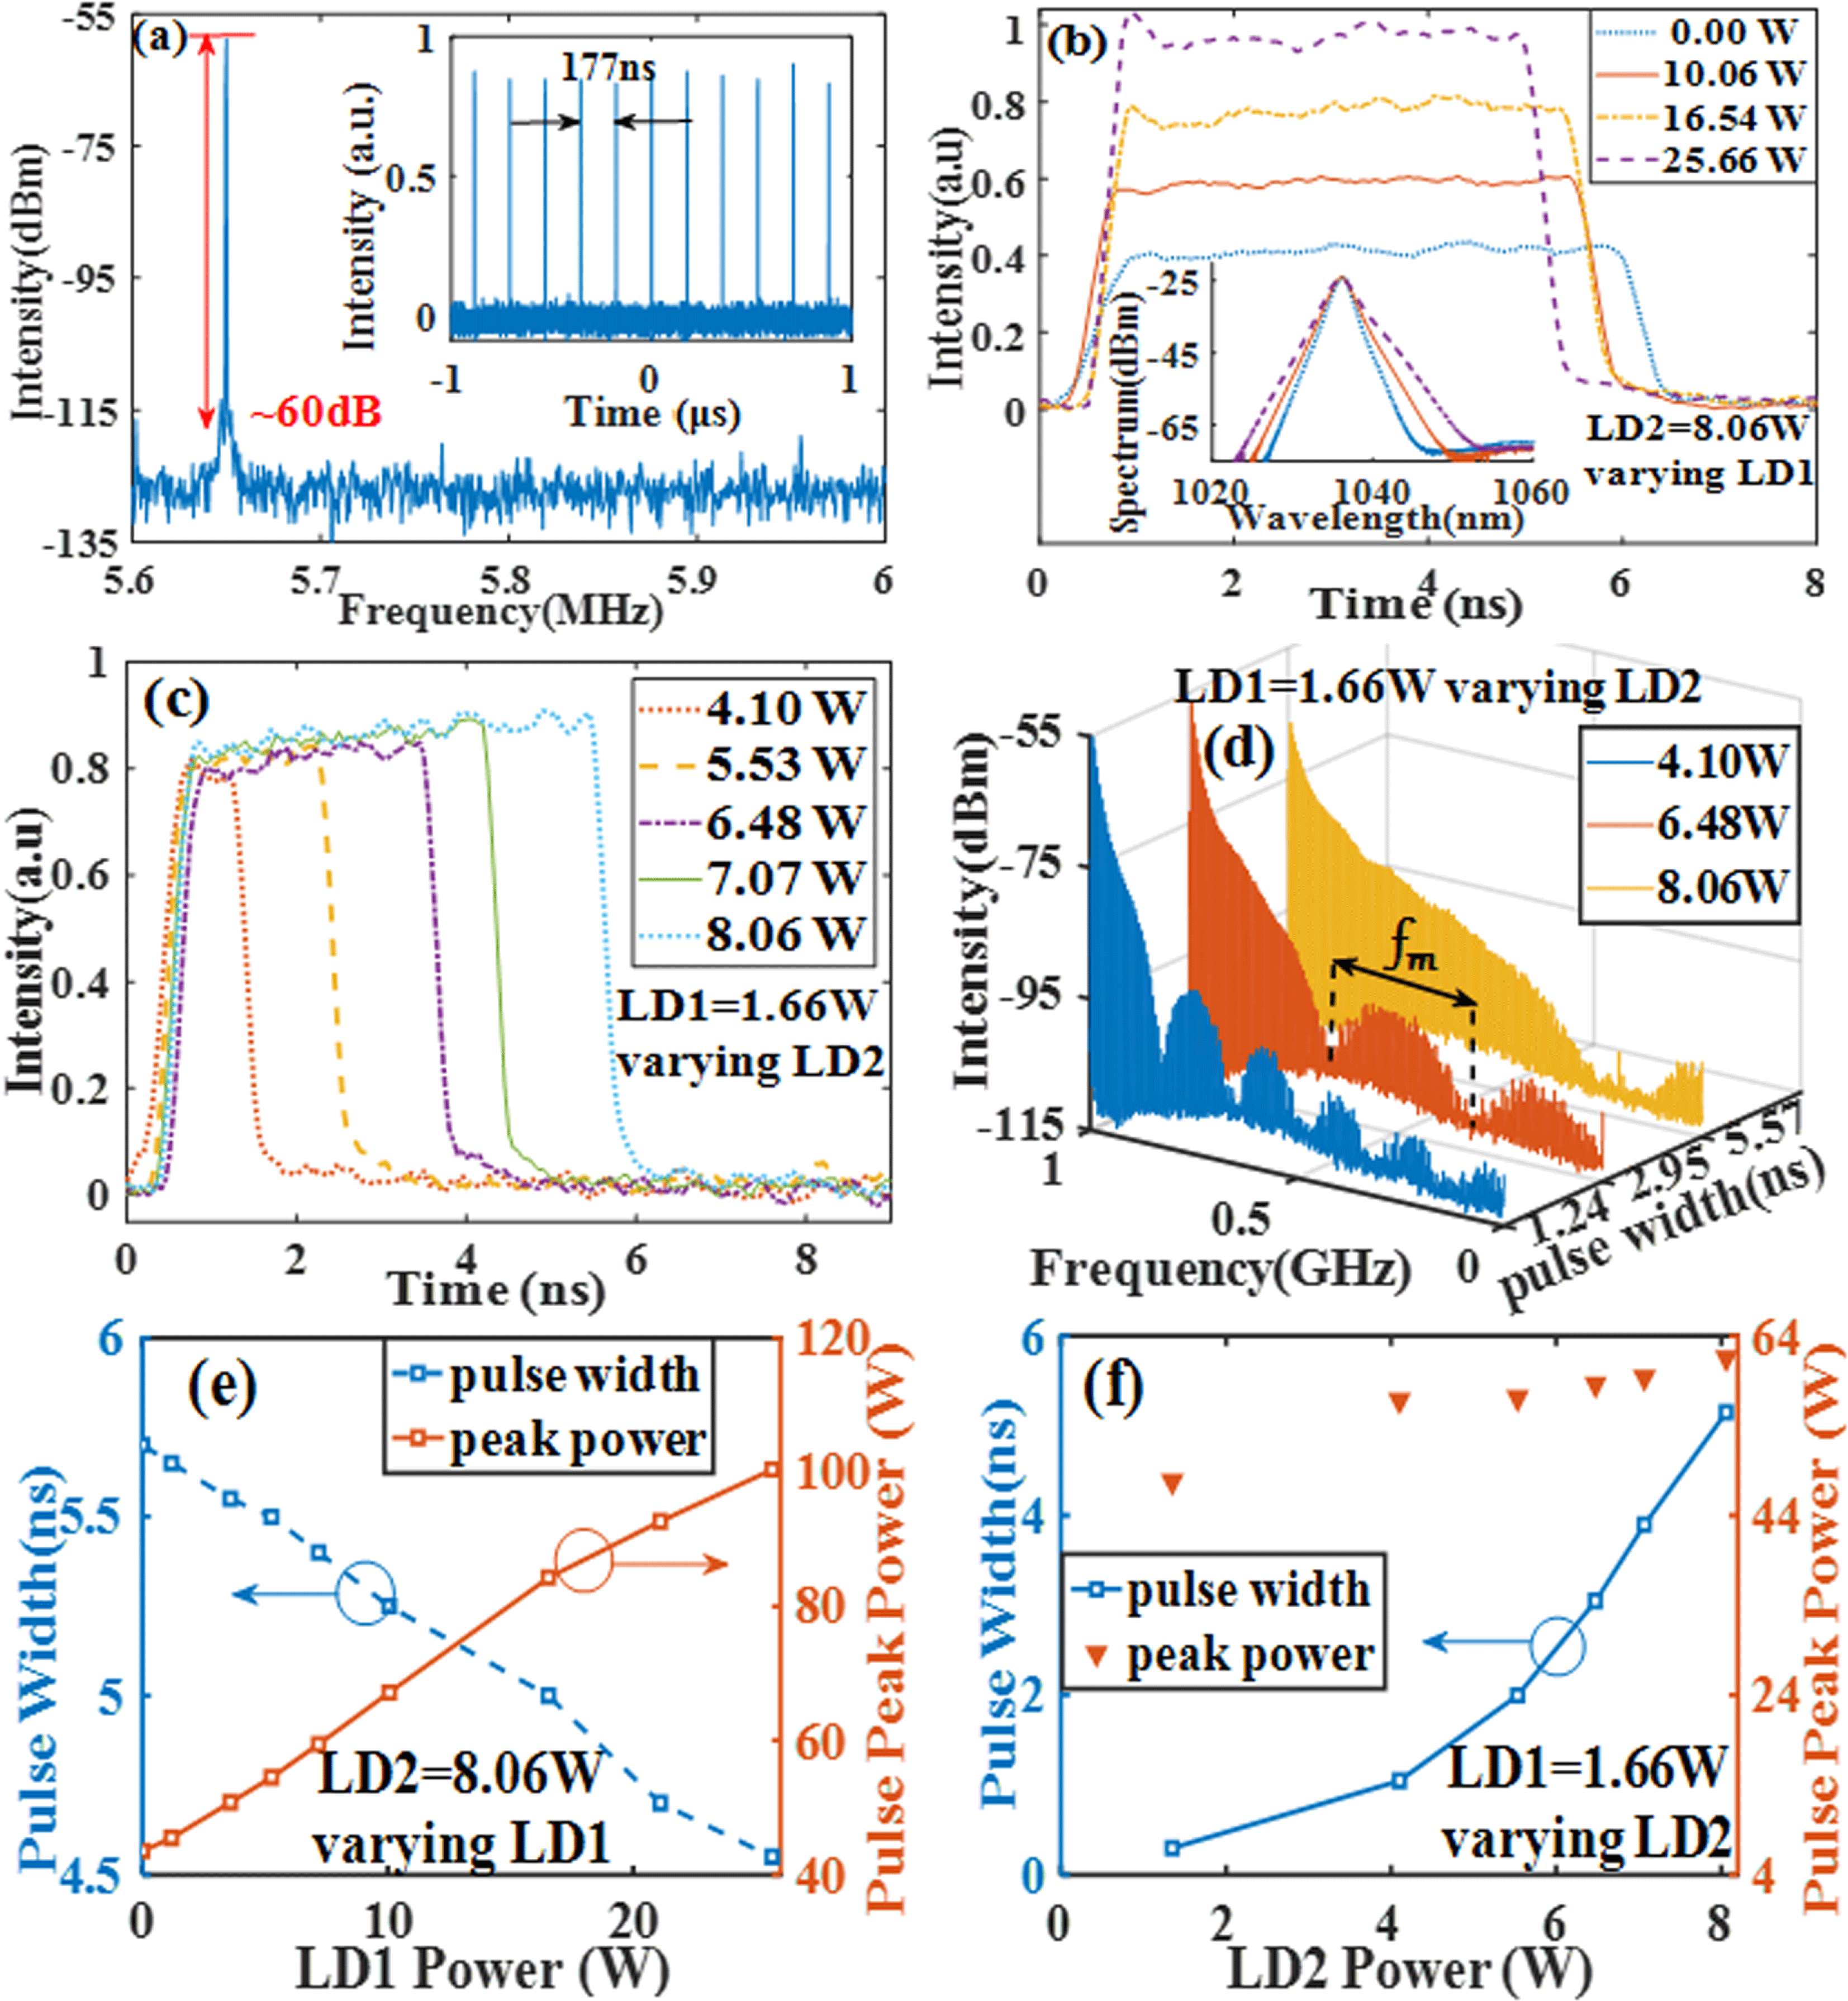
Figure 2. Properties of the DSR laser. (a) RF spectrum and the pulse train (inset) at a 5.650 MHz repetition rate. (b) Pulse waveform and spectra (inset) variations with the power of LD1. (c) Pulse waveform variation and (d) RF spectrum evolution with increasing power of LD2. Pulse peak power and width variation with (e) LD1 power and (f) LD2 power.
Once mode-locked, the laser produces a stable train of pulses with an interval of
![]() ${\sim}$
177 ns, corresponding to a fundamental repetition rate of
${\sim}$
177 ns, corresponding to a fundamental repetition rate of
![]() ${\sim}$
5.650 MHz, as plotted in Figure 2(a). The measured signal-to-noise ratio is 60 dB, indicating good temporal stability. The graphs in Figures 2(b) and 2(e) show that the pulse peak power increases linearly from
${\sim}$
5.650 MHz, as plotted in Figure 2(a). The measured signal-to-noise ratio is 60 dB, indicating good temporal stability. The graphs in Figures 2(b) and 2(e) show that the pulse peak power increases linearly from
![]() ${\sim}$
40 W to
${\sim}$
40 W to
![]() ${\sim}$
100 W with an increase of the power of LD1 from 0 W to
${\sim}$
100 W with an increase of the power of LD1 from 0 W to
![]() ${\sim}$
25 W when the power of LD2 is fixed at 8.06 W. The spectral shape is triangular and the central wavelength is always located at
${\sim}$
25 W when the power of LD2 is fixed at 8.06 W. The spectral shape is triangular and the central wavelength is always located at
![]() ${\sim}$
1035 nm with a 3-dB spectral bandwidth of
${\sim}$
1035 nm with a 3-dB spectral bandwidth of
![]() ${\sim}$
2 nm, as can be seen from the inset of Figure 2(b). The corresponding 3-dB spectral width increases whilst the pulse width decreases slightly with increasing power of LD1. Figures 2(c) and 2(f) show the increase of pulse width with increasing power of LD2, for a fixed power of LD1.
${\sim}$
2 nm, as can be seen from the inset of Figure 2(b). The corresponding 3-dB spectral width increases whilst the pulse width decreases slightly with increasing power of LD1. Figures 2(c) and 2(f) show the increase of pulse width with increasing power of LD2, for a fixed power of LD1.
This kind of dual-pump figure-of-eight laser can generate DSR pulses with tunable pulse width and peak power, which is different from lasers with constant peak power DSR pulses, which can be understood as follows. The peak power of the DSR pulse is limited by the saturation power of the artificial saturable absorber, which is influenced by the pump power intercoupling in such a dual-pump cavity. To be specific, the saturation power is equal to the input power at the first peak of the transmissivity of the NALM. In such a dual-pump cavity, if the coupler ratio (
![]() $\unicode[STIX]{x1D6FC}$
) is fixed, the transmissivity of the NALM (
$\unicode[STIX]{x1D6FC}$
) is fixed, the transmissivity of the NALM (
![]() $T$
) is related to the amplification coefficient (
$T$
) is related to the amplification coefficient (
![]() $G$
) of the incident light of the NALM and the phase shift (
$G$
) of the incident light of the NALM and the phase shift (
![]() $\unicode[STIX]{x1D6FF}\unicode[STIX]{x1D711}$
) of the counter-propagating waves, as
$\unicode[STIX]{x1D6FF}\unicode[STIX]{x1D711}$
) of the counter-propagating waves, as
![]() $T=G\cdot [1-2\unicode[STIX]{x1D6FC}(1-\unicode[STIX]{x1D6FC})(1+\cos \unicode[STIX]{x1D6FF}\unicode[STIX]{x1D711})]$
. The pump power of the unidirectional ring and the NALM together influence
$T=G\cdot [1-2\unicode[STIX]{x1D6FC}(1-\unicode[STIX]{x1D6FC})(1+\cos \unicode[STIX]{x1D6FF}\unicode[STIX]{x1D711})]$
. The pump power of the unidirectional ring and the NALM together influence
![]() $G$
and
$G$
and
![]() $\unicode[STIX]{x1D6FF}\unicode[STIX]{x1D711}$
. Hence the saturation power varies with the two amplifiers, allowing adjustment of the pulse peak power.
$\unicode[STIX]{x1D6FF}\unicode[STIX]{x1D711}$
. Hence the saturation power varies with the two amplifiers, allowing adjustment of the pulse peak power.
Although the output pulse broadens by more than five times due to the accumulated pulse energy, it is noted that the pulse peak power remains almost constant at
![]() ${\sim}$
60 W, as a result of the peak power clamping effect, which represents a distinguishing feature of the DSR operation regime. Each modulation frequency (
${\sim}$
60 W, as a result of the peak power clamping effect, which represents a distinguishing feature of the DSR operation regime. Each modulation frequency (
![]() $f_{m}$
) of the three RF spectral distributions in Figure 2(d) is equal to the reciprocal of the native DSR pulse duration (
$f_{m}$
) of the three RF spectral distributions in Figure 2(d) is equal to the reciprocal of the native DSR pulse duration (
![]() $f_{m}=1/\unicode[STIX]{x1D70F}$
)[Reference Zhao, Ouyang, Zheng, Liu, Ren, Li, Ruan and Xie10]. Overall, the laser can generate pretty standard square-shaped DSR pulses with continuously tunable widths from 500 ps to 5.7 ns and amplitudes from 10 W to 100 W.
$f_{m}=1/\unicode[STIX]{x1D70F}$
)[Reference Zhao, Ouyang, Zheng, Liu, Ren, Li, Ruan and Xie10]. Overall, the laser can generate pretty standard square-shaped DSR pulses with continuously tunable widths from 500 ps to 5.7 ns and amplitudes from 10 W to 100 W.
4 Selective generation of individual Raman Stokes lines
We successfully excited individual Raman lines with the side-mode suppression better than 8 dB by launching square-shaped DSR pulses at 1035 nm into 1-km-long single-mode fiber, as shown in Figure 3(a). Displayed in Figure 3(b) are corresponding input pulse waveforms with average powers of 0.06 W, 0.68 W, 1.64 W and 2.82 W. The maximum launched single pulse energy is 5 nJ. By dividing the measured average power by the product of the pulse width and frequency, the peak powers are 9 W, 22 W, 56 W and 98 W for exciting the four wavelengths.
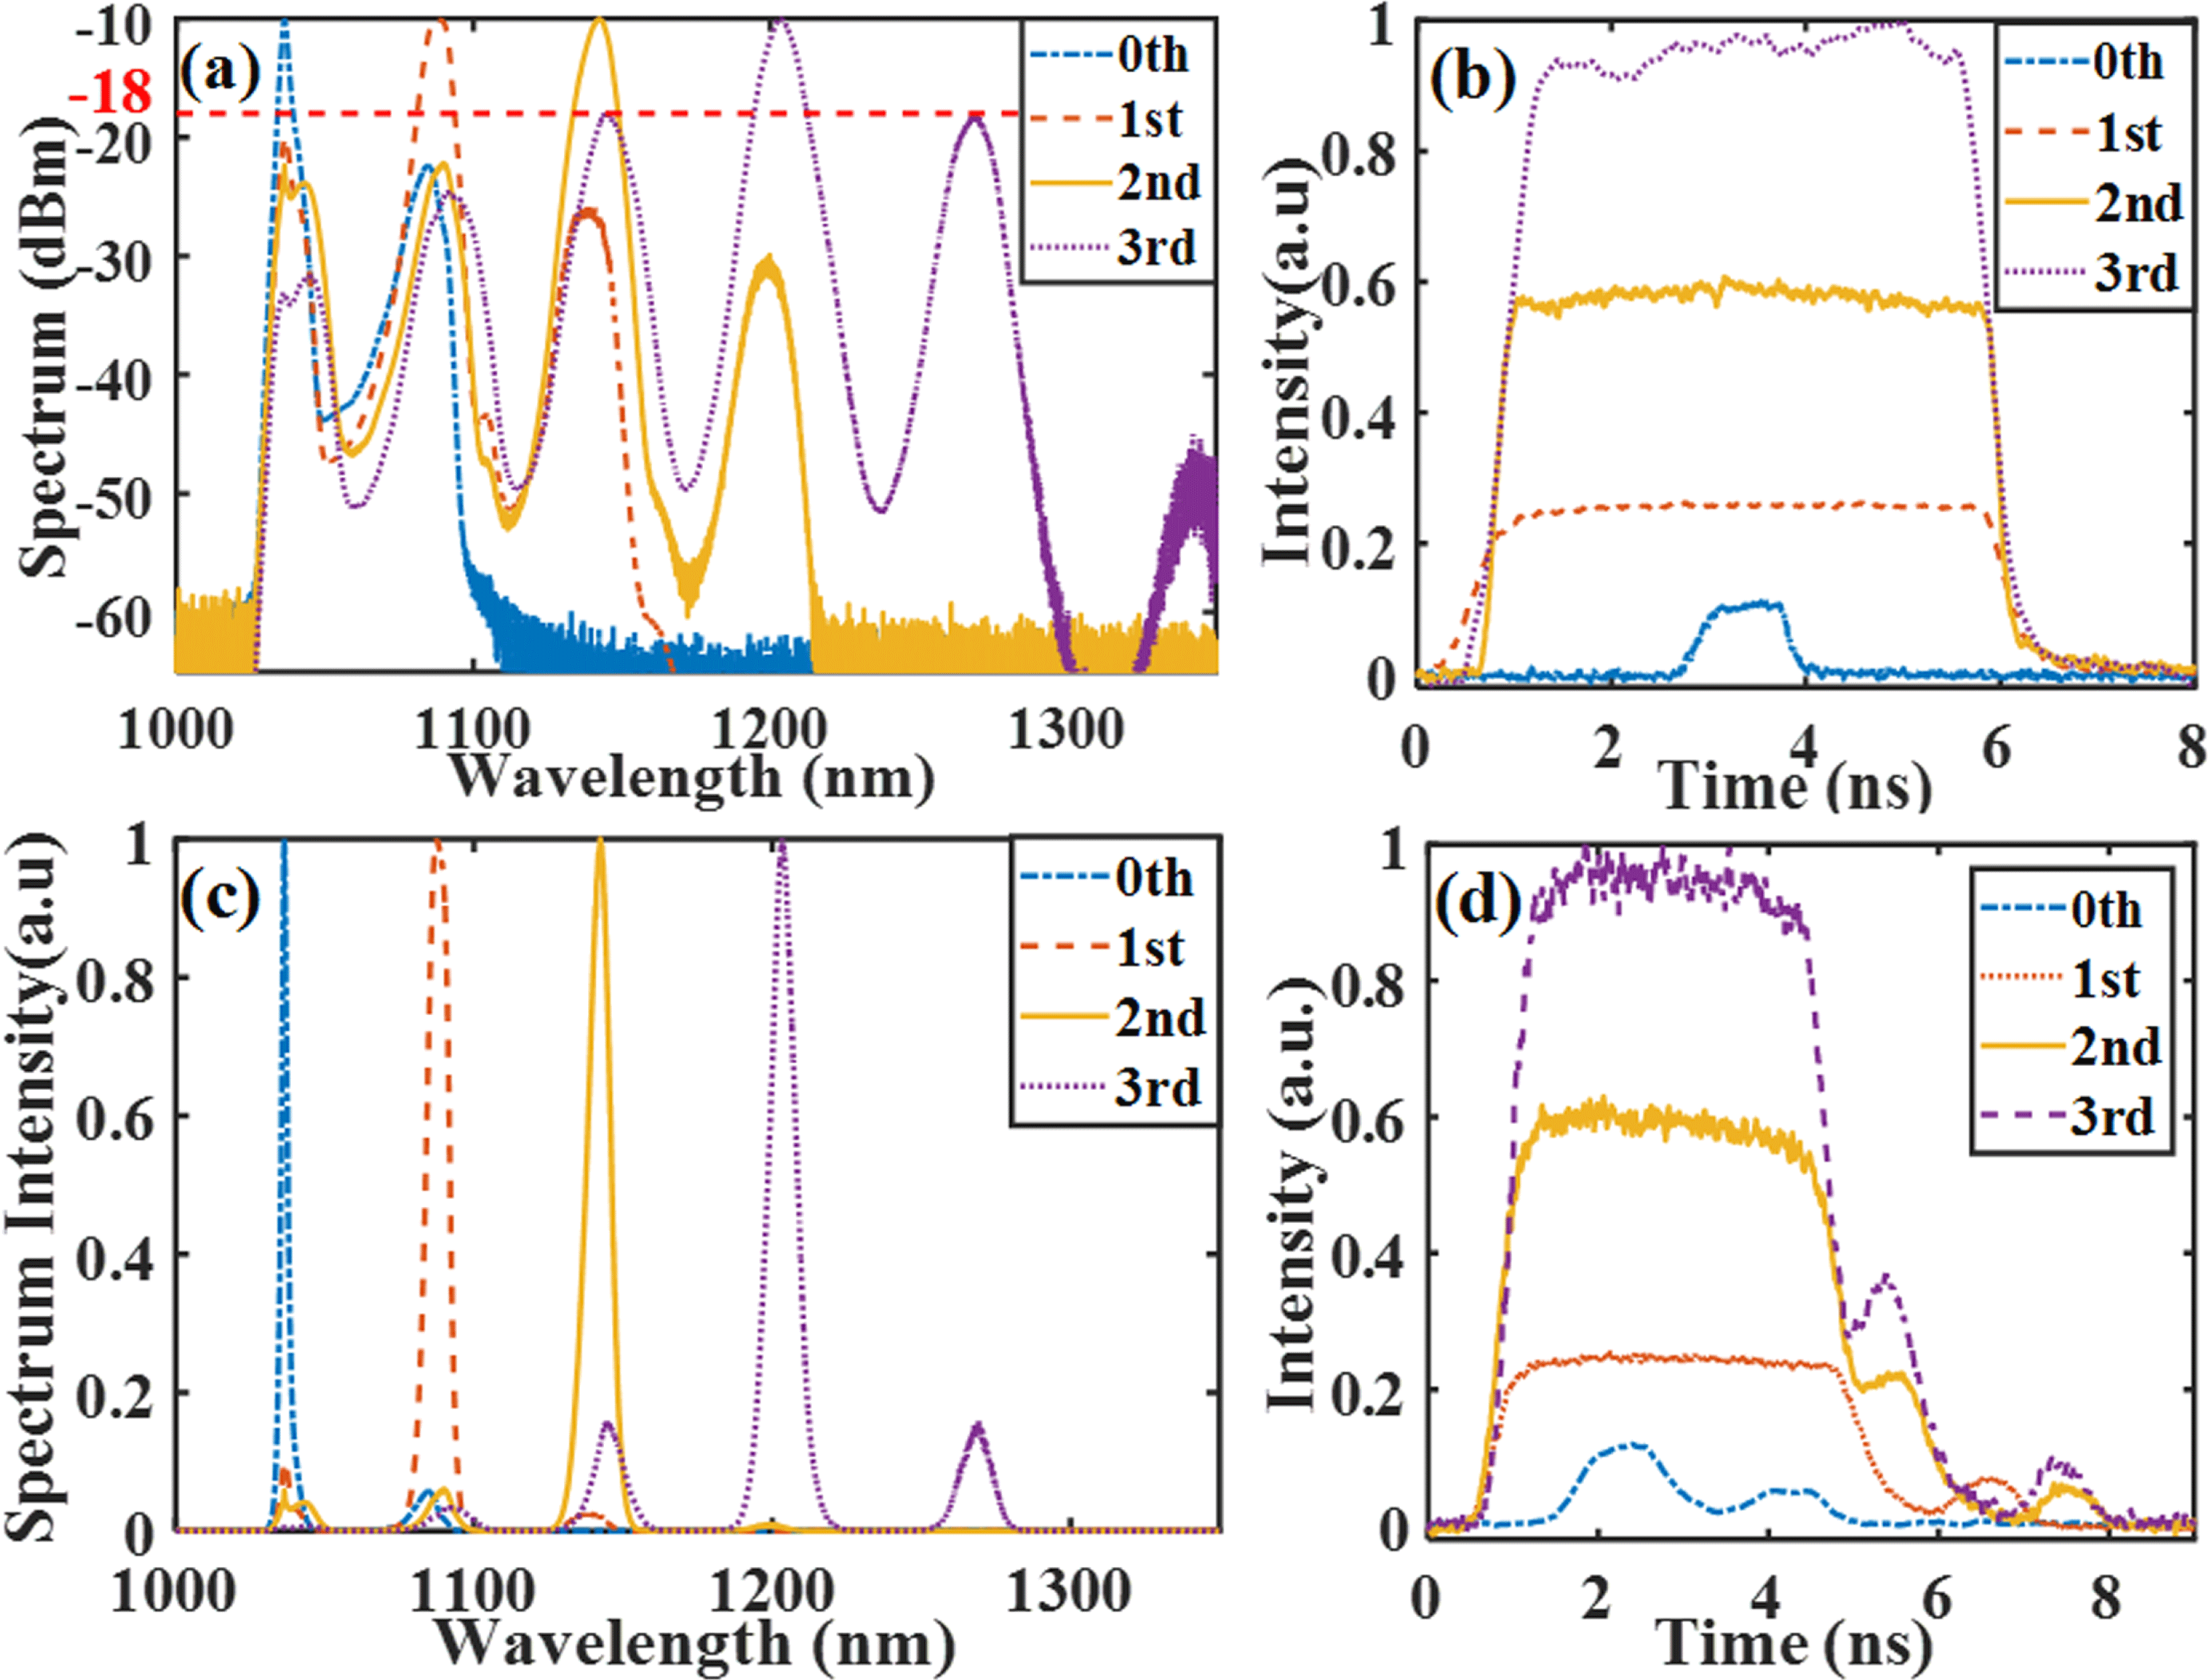
Figure 3. Spectra and temporal profiles of the Raman converted output pulses after propagating through 1-km-long HI1060 fiber pumped with DSR pulses at 5.65 MHz. Output spectra on (a) logarithmic and (c) linear scales. (b) Input DSR pulses. (d) Output pulses from the end of HI1060 fiber.
The pulse profiles drawn in time-domain figures are collected under the same conditions, only with a variation of the pump powers, which ensures the accuracy of the relative pulse power. Compared with the relative pulse peak power, two kinds of errors can occur in the calculated pulse peak power: the first is the measurement error in pulse width and average power induced by pump light instability together with the environmental background; the second is the error brought about by the calculating method considering an irregular pulse shape. Thus, the pulse peak power is not strictly accurate and may incur some errors when labeling the
![]() $y$
-axis, which is the reason for us to adopt relative coordinates. The spectra in linear coordinates in Figure 3(c) obviously indicate that the intensity of the selected Raman order is at least five times higher than the other order. By integrating the area of each Stokes line according to the spectral distribution, the zeroth-, first-, second- and third-order Stokes peaks have 84%, 76%, 89% and 63% of the total transferred power. After propagating through the 1-km-long fiber, seen from Figure 3(d), there are parasitic pulses appearing in the trailing edge, which are the Raman Stokes components excited by the signal. Along with a higher pump pulse peak power that excites the third Raman line, the strength of parasitic pulses increases and the number of parasitic pulses grows to two. They walk away from the signal pulse under the influence of normal dispersion. The corresponding output power from the 1-km-long HI1060 fiber when it excites the third-order Raman lines is 1.63 W, which is about 58% of the input power of the DSR seed. It can be inferred that the splice loss (around 0.71 dB) and propagation attenuation (around 1.5 dB) together limit the power conversion efficiency.
$y$
-axis, which is the reason for us to adopt relative coordinates. The spectra in linear coordinates in Figure 3(c) obviously indicate that the intensity of the selected Raman order is at least five times higher than the other order. By integrating the area of each Stokes line according to the spectral distribution, the zeroth-, first-, second- and third-order Stokes peaks have 84%, 76%, 89% and 63% of the total transferred power. After propagating through the 1-km-long fiber, seen from Figure 3(d), there are parasitic pulses appearing in the trailing edge, which are the Raman Stokes components excited by the signal. Along with a higher pump pulse peak power that excites the third Raman line, the strength of parasitic pulses increases and the number of parasitic pulses grows to two. They walk away from the signal pulse under the influence of normal dispersion. The corresponding output power from the 1-km-long HI1060 fiber when it excites the third-order Raman lines is 1.63 W, which is about 58% of the input power of the DSR seed. It can be inferred that the splice loss (around 0.71 dB) and propagation attenuation (around 1.5 dB) together limit the power conversion efficiency.
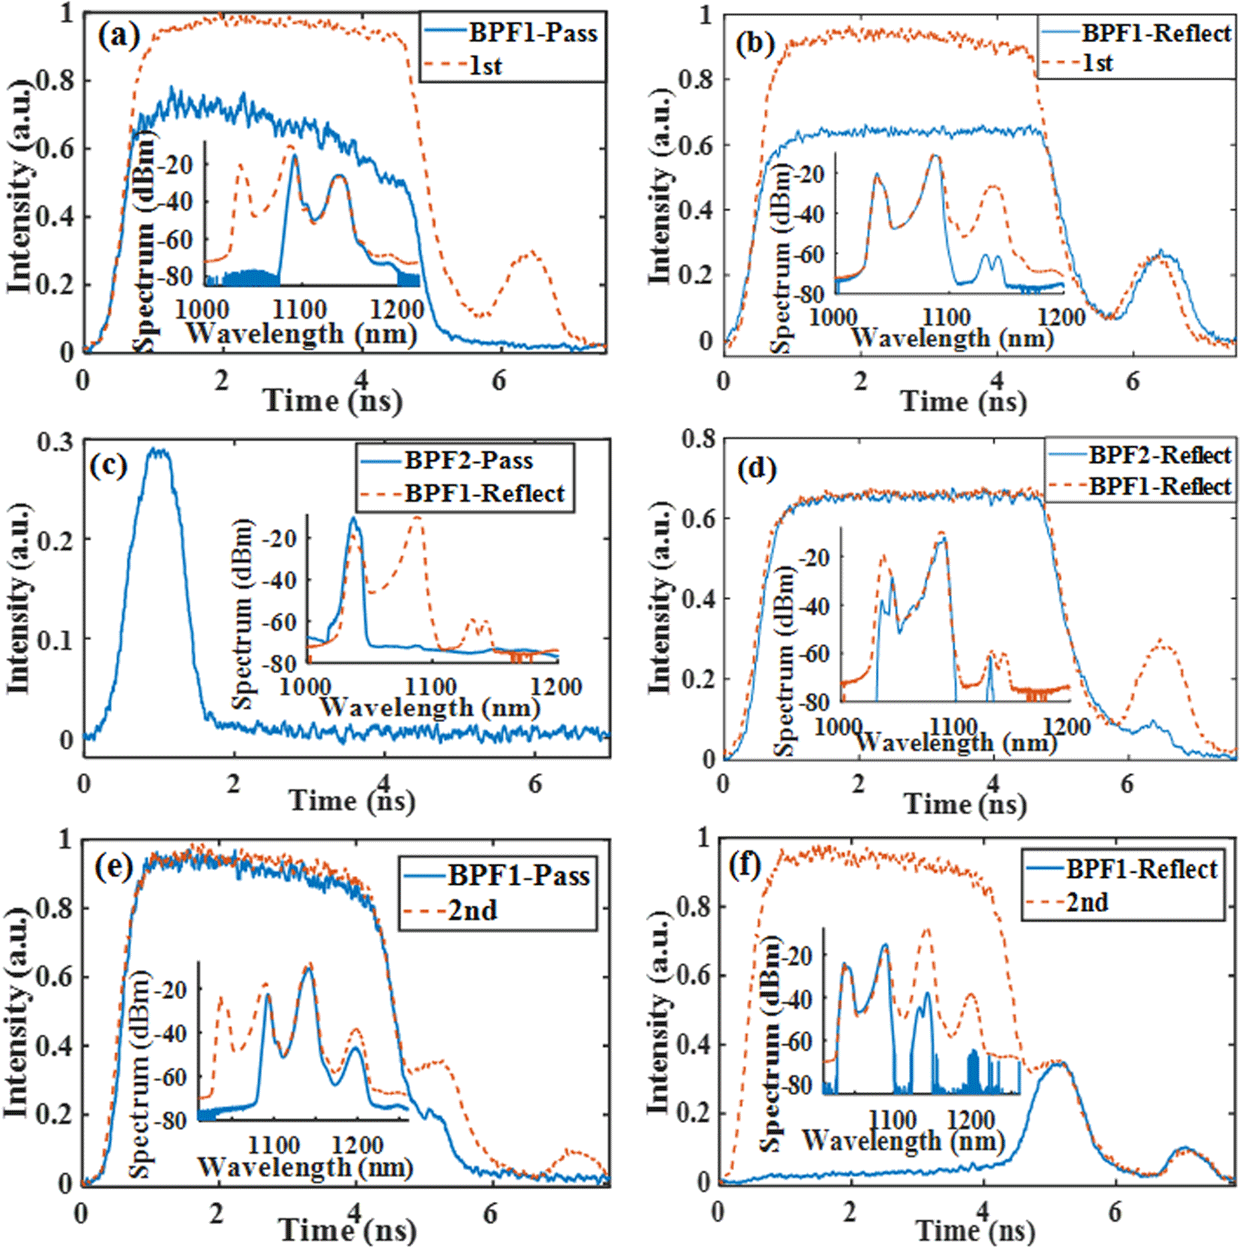
To separate different spectral components, two BPFs are connected to the end of the HI1060 fiber in succession, as shown in Figure 1. When the input pulse is able to excite the first-order Raman line, shown as the dashed line in Figure 4(a), the parasitic part of the output pulse is lost and the upper part close to the trailing edge is weakened after passing through BPF1. The corresponding reflecting pulse shown in Figure 4(b) contains the parasitic pulse, and the power ratio of the parasitic part to the main square pulse increases.
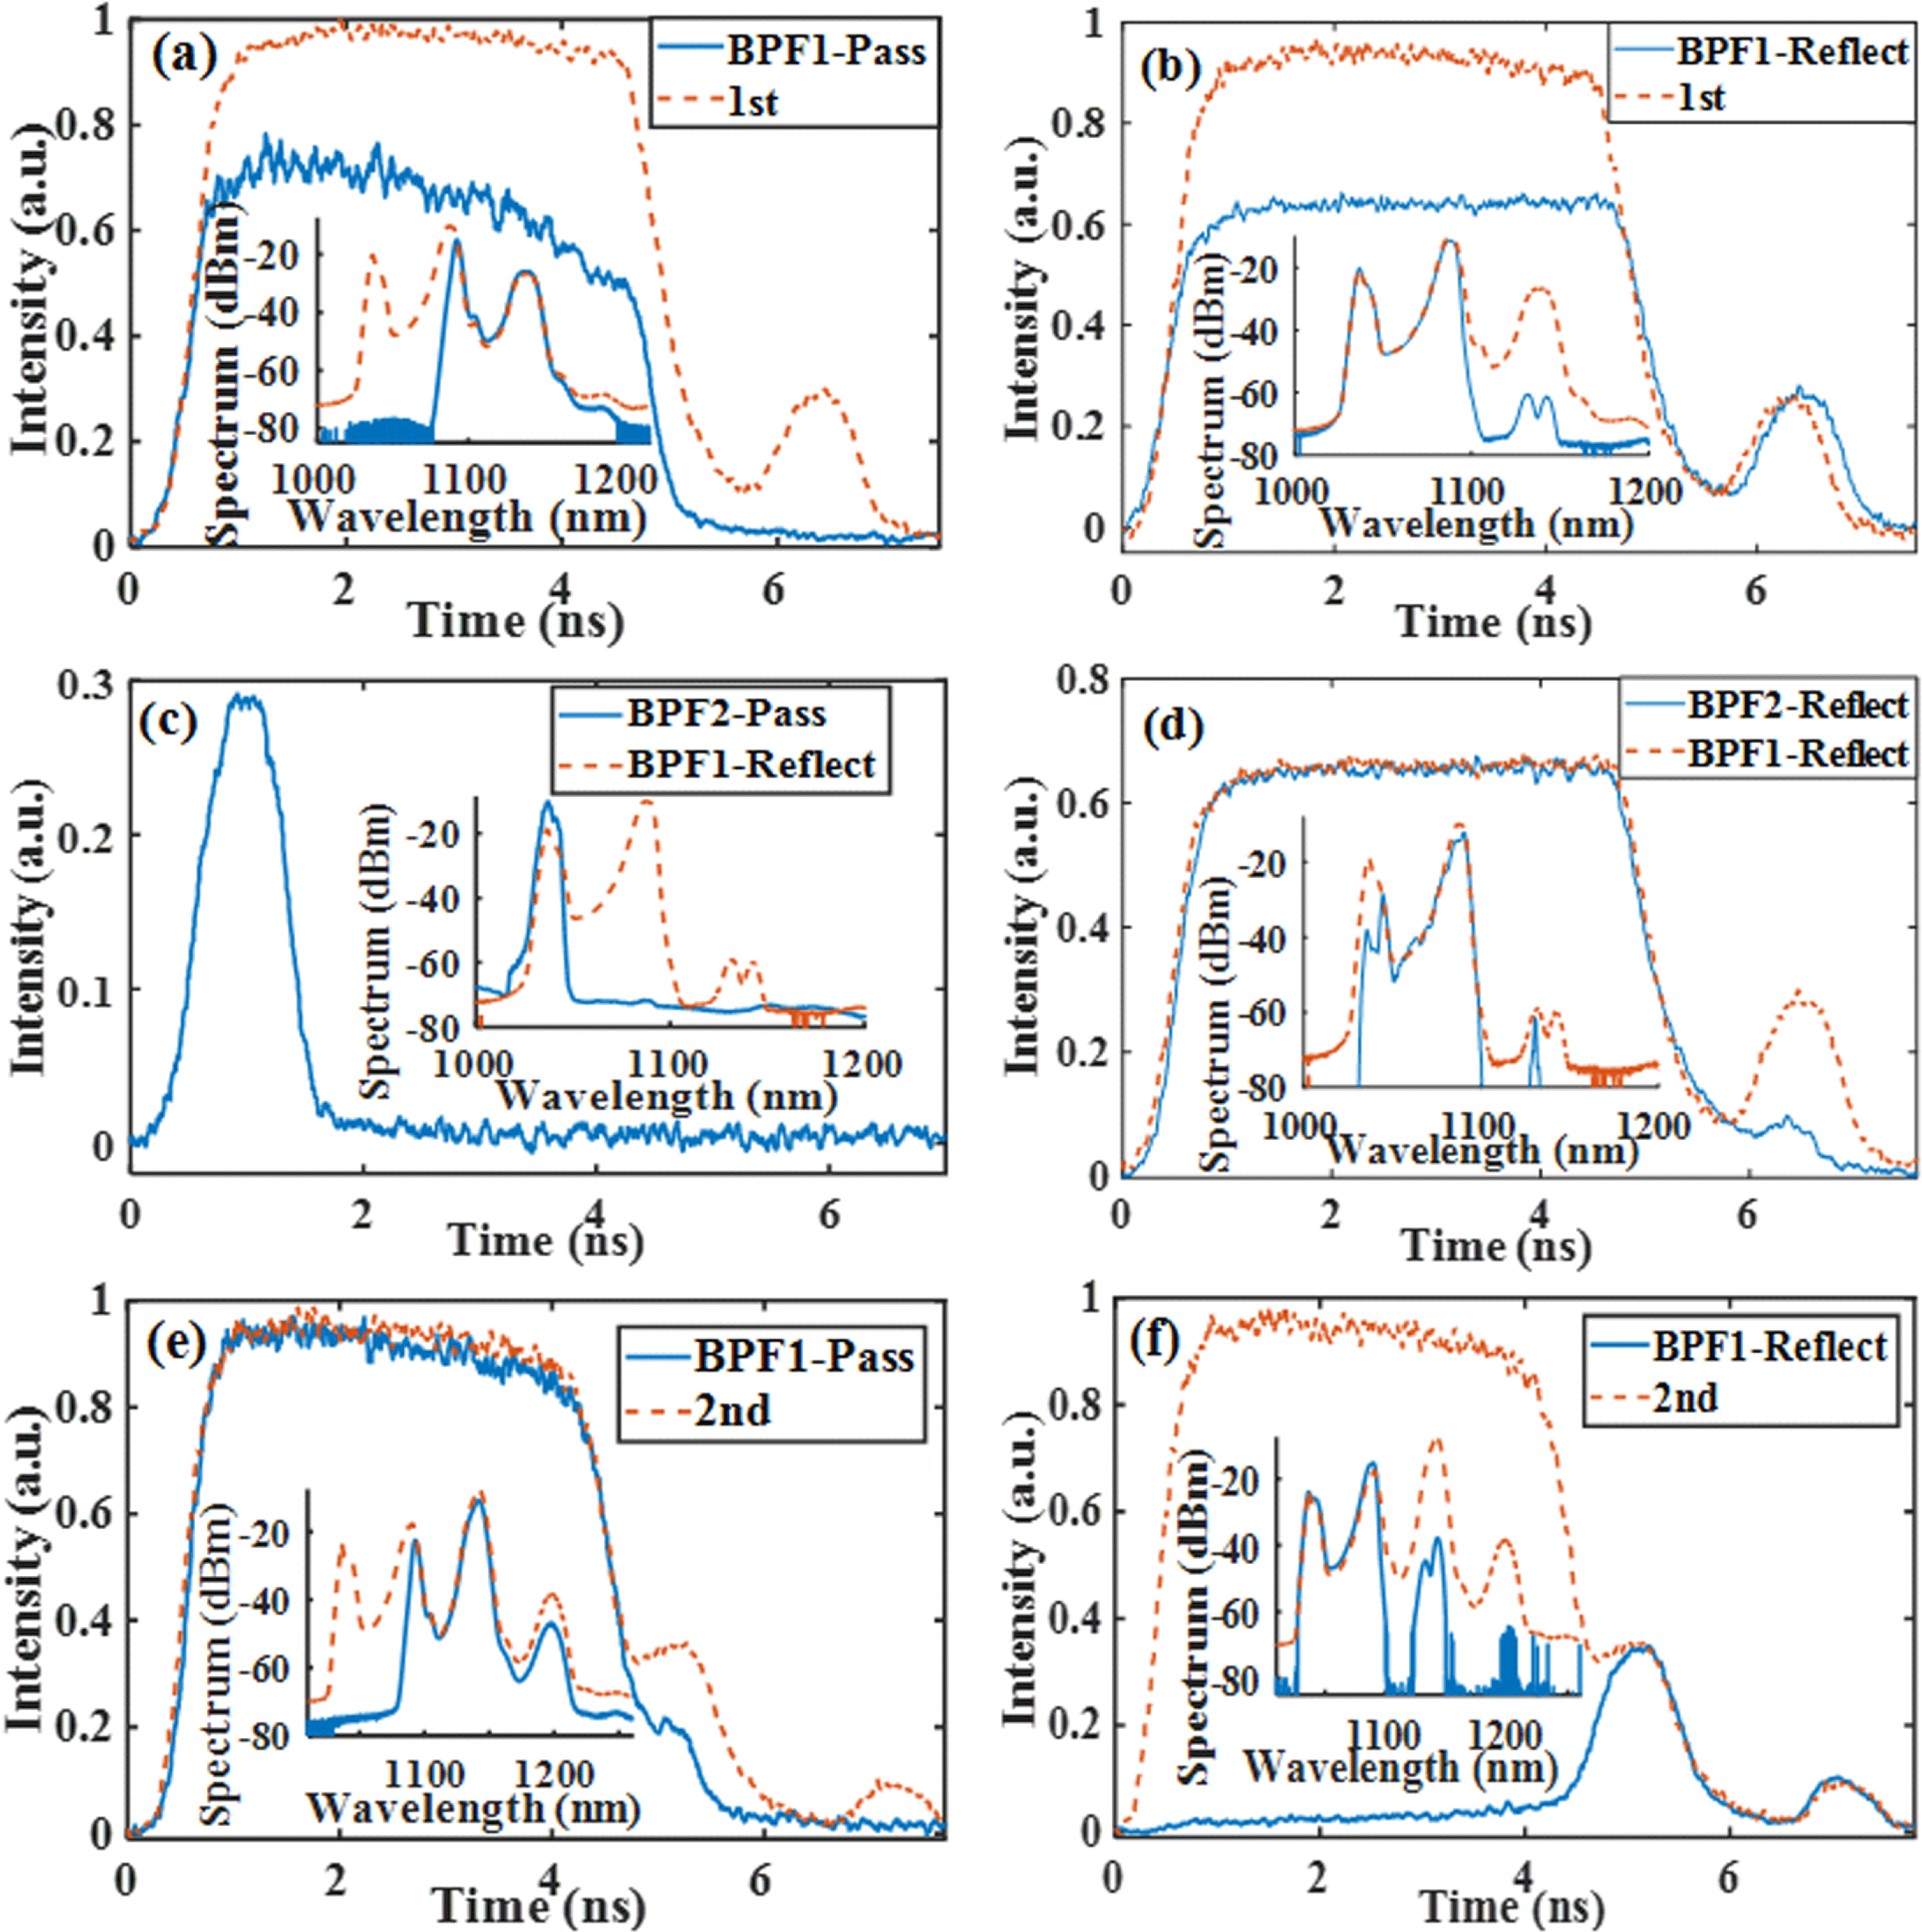
Figure 4. Output pulse characteristics after bandpass filtering. Temporal profiles and spectra of the (a), (e) passing and (b), (f) reflecting pulses from BPF1. Temporal profiles and spectra of the (c) passing and (d) reflecting pulses from BPF2. (a)–(d) are collected for pulses exciting the first-order Raman line while (e) and (f) are for pulses exciting the second-order Raman line.
Combining Figures 4(a) and 4(b), it is clear that the upper part close to the leading edge of the output pulse corresponds to a long-wave component of more than 1100 nm while the parasitic pulse in the trailing edge belongs to the short-wave component. The passing and reflecting beams filtered by BPF2 are presented in Figures 4(c) and 4(d), originating from the reflecting pulse of BPF1. The reflecting beam excludes most of the parasitic part, which indicates that the parasitic pulse is exactly the narrow passing pulse centered at 1030 nm. For the output pulse exciting the second-order Raman line with two parasitic pulses, the passing beam from BPF1 retains a small parasitic part adjacent to main pulse, as seen in Figure 4(e). Seen in Figure 4(f), the reflecting pulse almost contains two parasitic pulses, corresponding to the spectra of the first two Raman peaks. Based on that, it can be inferred that shorter spectral components are located in the pulse trailing edge after propagating, which is consistent with the theory that high-frequency (blue-shifted) components travel more slowly than low-frequency (red-shifted) components of the same pulse in the normal dispersion regime[Reference Agrawal11].
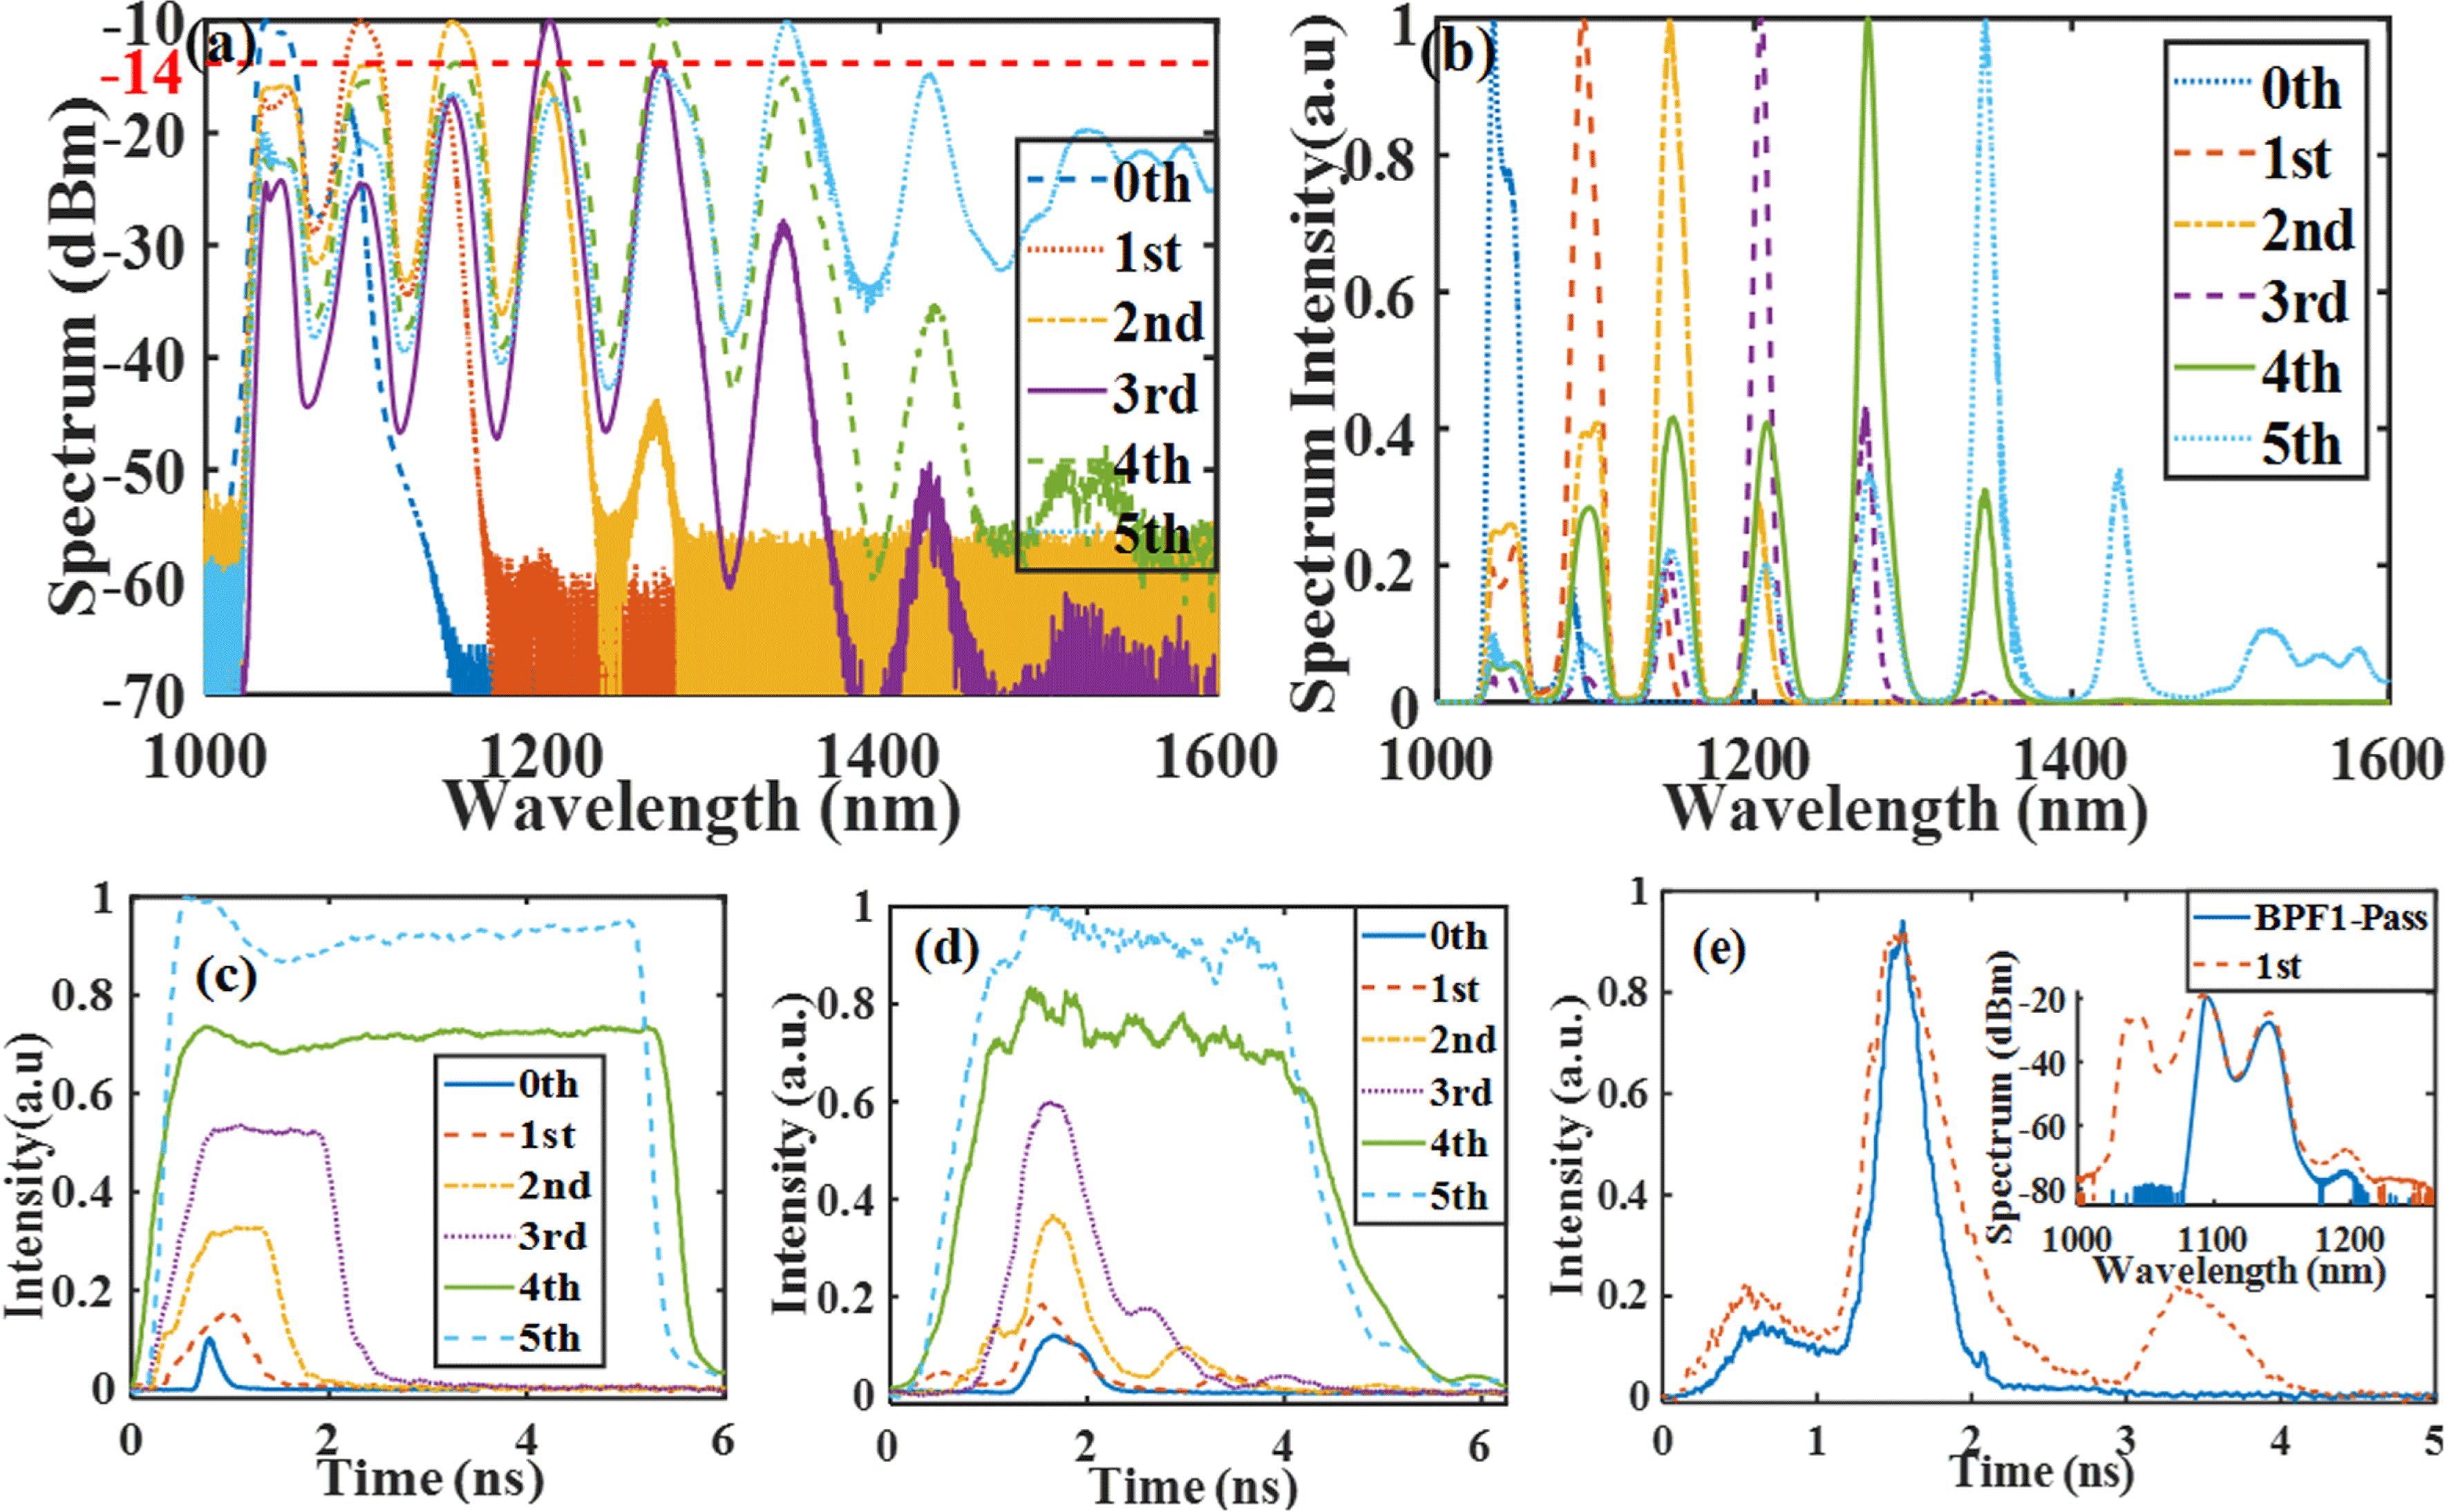
Figure 5. Spectra and temporal profiles of the Raman-converted output pulses after propagating through 1-km-long HI1060 fiber pumped with DSR pulses at 6.3 MHz. Output spectra on (a) logarithmic and (b) linear scales. (c) Input DSR pulses at 6.3 MHz. (d) Output pulses from the end of the HI1060 fiber. (e) Temporal profiles and spectra of output pulses after filtering of BPF1.
Due to the limited maximum pulse peak power of DSR, only three orders of Stokes lines are excited by adopting the aforementioned cavity parameters. Then the length of NALM is decreased to 11.5 m to increase the clamped DSR peak power to
![]() ${\sim}$
200 W. Figure 5(a) shows the spectra of the zeroth-, first-, second-, third-, fourth- and fifth-order Raman Stokes lines at incident peak powers of 12 W, 26 W, 58 W, 103 W, 142 W and 194 W, respectively. The linear spectral intensity distribution in Figure 5(b) shows that the selected Raman peak exceeds the others by about 2.5 times. Input and output pulse waveforms are demonstrated in Figures 5(c) and 5(d). Corresponding input pulses exciting the zeroth and first-order Raman lines exhibit sharp edges accompanied with narrow widths. Pulses that exciting the second and third-order Raman lines show a trapezium-like waveform, while those exciting the fourth and fifth-order Raman lines seem more square-like despite the bump at the top. After propagation, all the output pulses tend to be more triangular and are narrower in width compared with the input pulses. Since the leading edge of the input pulse transfers energy to the Raman pulse and the group-velocity mismatch physically separates them, the two pulses both appear narrower.
${\sim}$
200 W. Figure 5(a) shows the spectra of the zeroth-, first-, second-, third-, fourth- and fifth-order Raman Stokes lines at incident peak powers of 12 W, 26 W, 58 W, 103 W, 142 W and 194 W, respectively. The linear spectral intensity distribution in Figure 5(b) shows that the selected Raman peak exceeds the others by about 2.5 times. Input and output pulse waveforms are demonstrated in Figures 5(c) and 5(d). Corresponding input pulses exciting the zeroth and first-order Raman lines exhibit sharp edges accompanied with narrow widths. Pulses that exciting the second and third-order Raman lines show a trapezium-like waveform, while those exciting the fourth and fifth-order Raman lines seem more square-like despite the bump at the top. After propagation, all the output pulses tend to be more triangular and are narrower in width compared with the input pulses. Since the leading edge of the input pulse transfers energy to the Raman pulse and the group-velocity mismatch physically separates them, the two pulses both appear narrower.
The side-mode suppression becomes larger than 4 dB when the pulse shape is not exactly rectangular. This can be understood as the different instantaneous power in the rising and falling edges of the incident DSR pulse having more energy at this time, which could contribute to the decline in the energy proportion of the selected Raman lines. It is noteworthy that in the propagation of short optical pulses such as the first and second-order Raman lines, parasitic pulses appear in both the trailing and leading edges. Passing through BPF1, spectral components of shorter than 1100 nm are filtered while the parasitic pulse in the trailing edge disappears. Combining Figure 5(e) and the above analysis around Figure 4, it seems that short-wave and long-wave components walk away from the narrow main pulse to the trailing and leading edges, respectively. However, for the pulse exciting the fourth and fifth-order Raman lines, the parasitic pulses in the pulse trailing edge is difficult to see due to the high peak power of the main pulse.
It is noteworthy that, with a higher incident DSR peak power, the number of Stokes orders is limited to six, beyond which a continuum starts to develop due to the overlap of the Stokes line with the anomalous dispersion regime of the Raman gain medium.
5 Conclusion
In conclusion, we have demonstrated the use of DSR pulses for the controllable transfer of pulse energy between sequential Raman orders, showing that highly efficient conversion between orders can be achieved by controlling the pulse peak power in excess of the fiber saturation energy. The Raman conversion results of DSR pulses generated from two lengths of cavity indicate that more exact flat-topped pulses facilitate more complete conversion. Standard square pulses possess a lower energy ratio of the rising and falling edges, which increases the extinction ratio of the Raman Stokes lines. After separating the propagating pulse by BPFs, shorter spectral components are confirmed to be located in the pulse trailing edge after propagating, consistent with the theory. We consider this to be an interesting application of a dual-pump NALM-based figure-of-eight cavity generating square-shaped DSR pulses with tunable peak power and width. It is also a convenient approach to the frequency conversion of high-power pulsed fiber laser systems.
Acknowledgements
This work was supported by the National Natural Science Foundation of China (NSFC) (No. 61235008) and the National High Technology Research and Development Program of China (No. 2015AA021101).


