safefood displays the Food Standards Agency (FSA) Front of Pack (FoP) nutrition label(1) on all its website recipes. This aims to guide consumers in making more informed dietary choices(Reference Van den Wijngaart2). With 59% of consumers interested in information about diet and health(Reference Douglas and Matthews3) and 55% trusting government websites as a source of such information(Reference Douglas and Matthews3) it is imperative that a public body like safefood ensures that information is up-to-date and reliable. Previously, safefood used NetWISP to analyse recipes but this platform is no longer updated or supported. Migration to a new software was imperative and Nutritics was identified as being most suitable. The aim of this analysis was to identify variability in nutrition information when using different software programmes.
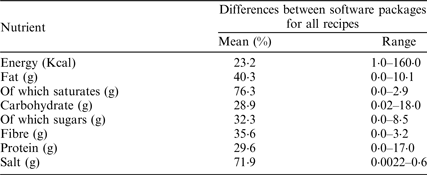
In September 2017, recipes (n = 35) from the safefood website were selected for re-analysis using both NetWISP and Nutritics. A selection of breakfast (n = 10), lunch (n = 10), dinner (n = 10) and dessert (n = 5) recipes were chosen. The mean difference (%) and minimum and maximum difference were identified for all recipes (Table 1).
Table 1 Mean percentage difference and range observed for recipes analysed (n = 35) on NetWISP and Nutritics nutritional analysis software packages

All recipes displayed variance of greater than 20% in at least one or more of the components analysed. Saturated fat and salt showed the greatest mean differences of 76·3% and 71·9% respectively. A total of thirty-two recipes had a lower salt (g) content when analysed with Nutritics. Values for saturated fat (g) were higher in 21 recipes following analysis on Nutritics.
Variations in salt can be attributed to the fact that NetWISP used an older food composition database(4) which didn't reflect recent product reformulation programmes. A salt reduction programme(5) has been in place since 2003 and this has brought about significant reductions in the salt content of many processed meats, breads, breakfast cereals and spreadable fats(5). There is a need to differentiate between food composition data and food label data when comparing two datasets. Nutritics presents labelling data which incorporates fat absorption, thus, explaining the higher fat content observed. The introduction of new foods, raw materials, farming and fortification practices and methods of preparation and cooking(6, Reference Williamson7) can also cause alterations in nutritional composition.
This quality control exercise highlights the importance of understanding differences between nutrition analysis programmes and using an up-to-date software in an environment of product reformulation.


