1. Introduction
Rapid decay of the Arctic sea-ice cover in recent years has been a major focus for climate change scientists (Reference ComisoComiso, 2012; Reference Liu, Song, Horton and HuLiu and others, 2013). Compared with the observable decreases in sea-ice extent, changes in sea-ice volume are surprisingly large. For the period 1979–2012, Reference Overland and WangOverland and Wang (2013) found a declining trend of –27.8% (10 a )–1 in ice volume compared to a trend of –14.2% (10 a)–1 in ice extent, indicating the importance of accessing large-scale ice thickness in Arctic sea-ice studies.
ICESat (Ice, Cloud and land Elevation Satellite) and CryoSat-2 are powerful instruments for accessing such information. They measure the sea-ice freeboard using lidar or radar altimetry, and then determine the total ice thickness assuming hydrostatic equilibrium (Reference KwokKwok, 2010). However, a difficulty in retrieving ice thickness from freeboard is the predetermination of surface loading, which changes the equilibrium of ice floes. Snow cover is the primary surface loading and has attracted much attention (Reference GilesGiles and others, 2007; Reference Kwok and CunninghamKwok and Cunningham, 2008), but studies of the influence of melt ponds, another kind of surface loading on ice volume, are extremely few, mainly because of the absence of available freeboard measurements during melting seasons. ICESat meets difficulties in distinguishing laser pulses reflected by melt ponds from those reflected by leads (Reference Farrell, Laxon, McAdoo, Yi and ZwallyFarrell and others, 2009). CryoSat-2 works on the assumption that the radar pulse penetrates through the snow volume and reflects at the snow/ice interface (Reference Laxon, Peacock and SmithLaxon and others, 2003), but this is only theoretically true under dry conditions, and a very small amount of liquid water in the snowpack, due to melting, will make such an assumption ambiguous (Reference GilesGiles and others, 2007). However, this should not impede study of the influence of melt ponds, since some ICESat data are still available that were acquired during the spring campaigns (May–June data) when surface melting had started (Reference Kwok, Cunningham, Zwally and YiKwok and others, 2006). Moreover, ice-thickness changes during melt seasons are more useful than those in frozen seasons for studying the response of Arctic sea ice to global warming, and we cannot be sure that there will be no effective instruments or algorithms in future to resolve the problems of present satellite altimetry when it comes to accessing a melting ice surface. For example, Reference Farrell, Laxon, McAdoo, Yi and ZwallyFarrell and others (2009) employed near-coincident, cloud-free Moderate Resolution Imaging Spectroradiometer (MODIS) images to detect open leads within the ice pack when analyzing ICESat profiles. Observations on melt ponds using satellite sensors (e.g. synthetic aperture radar (SAR), Enhanced Thematic Mapper Plus (ETM+) and MODIS) are already possible (Reference Tschudi, Maslanik and PerovichTschudi and others, 2008; Reference Rösel and KaleschkeRösel and Kaleschke, 2011; Reference Kim, Hwang, Chung, Lee, Jung and MoonKim and others, 2013), and a similar combination with satellite altimetry would provide a means to access the thickness of ponded ice if coincident measurements are possible.
In the present study, a theoretical model of sea-ice hydrostatic equilibrium during the melting season is developed, and an algorithm for retrieving ice thickness from freeboard is developed by including two features of melt ponds: pond depth and areal fraction. A sensitivity analysis is conducted to investigate influences from snow depth, pond size and densities of snow and ice. The ratio of ice draft to freeboard is also discussed to compare with field observations.
2. Model Description
A schematic diagram illustrating the hydrostatic equilibrium of sea ice with melt ponds is provided in Figure 1, where all geometric parameters of snow, ice and pond are defined. f i and fs are the thicknesses of ice and snow layers above the sea surface, respectively. The freeboard, f, is the sum of these two terms, f=fi + fs. Snow-induced surface flooding is not considered because of the relatively small summer snow depth in the Arctic (Reference WarrenWarren and others, 1999). dp is the pond depth and di is the thickness of underlying ice, i.e. the ponded ice thickness. For mature melt ponds which cover the Arctic sea-ice surface for the longest part of the melting season, the pond water level is hydraulically equal to the sea-water surface due to the high porosity and permeability of melting ice (Reference Eicken, Krouse, Kadko and PerovichEicken and others, 2002). The ice draft is d= dp + d i, and the unponded ice thickness is h = fi + d.

Fig. 1. Schematic diagram showing the hydrostatic equilibrium of an ice floe with snow cover and melt pond on surface.
To compare with floes without surface melting, parts of the ice and snow are removed from above the pond level and another part of ice below the pond level is replaced by meltwater (Fig. 1), thus forming a new hydrostatic equilibrium different to the no-melting case. This is accurately described by the Archimedes principle,
and a simplified equation can be obtained after some algebraic operations:
where a is the pond areal fraction, α = s p/si βiw, is the ratio of ice density ρi to sea-water density ρw, βsw is the ratio of snow density ρPs to sea-water density ρw, and βpw is the ratio of melting water density ρp to sea-water density ρw. The difference between ρp and ρw arises from the fact that ponds are nearly free of salt during most of the melting season (Reference Fetterer and UntersteinerFetterer and Untersteiner, 1998).
In accessing large-scale information on ice thickness, mean values are more important than just the unponded ice thickness for both remote sensing and numerical simulation, so the mean ice thickness is deduced as a weighted average of the ponded and unponded ice thickness:

where f is the remotely sensed freeboard, consistent with that of the lidar altimetry on ICESat and in contrast to the radar altimetry on CryoSat-2, where f i is theoretically measured but the penetration depth of the radar pulse through the snow volume decreases when snow is wet (Reference Alexandrov, Sandven, Wahlin and JohannessenAlexandrov and others, 2010). For the no-melting case, a = 0, and Eqn (3) reduces to a simpler form as
which is exactly the same as the formula used in ICESat data retrieval (Reference KwokKwok, 2010).
3. Sensitivity Analysis
Pond water density ρp and sea-water density ρw vary much less than all the other parameters determining the hydrostatic equilibrium of melting ice (Reference Fetterer and UntersteinerFetterer and Untersteiner, 1998; Reference Spreen, Kern, Stammer, Forsberg and HaarpaintnerSpreen and others, 2006). We therefore treat these two parameters as constants ρ(p = 1000 kg m–3, ρw = 1024 kg m–3), and the mean ice thickness h is associated with six other variables (f, fs, dp, α, βiw, βsw) according to Eqn (3). Assuming the variables are uncorrelated as in previous studies (Reference GilesGiles and others, 2007; Reference Kwok and CunninghamKwok and Cunningham, 2008; Forsstrom and others, 2011), uncertainties in mean ice thickness can be evaluated using the error propagation law:

The first three terms on the right-hand side denote the influences from the vertical scale, the fourth term is the influence from the horizontal scale, the last two terms are from medium densities, and

Typical values and uncertainties of the six variables are summarized in Table 1. Conditions of first-year ice (FYI) and multi-year ice (MYI) are separated because of the significant differences between them during melting seasons. To preserve the applicability of this study to the whole Arctic, the values in Table 1 are taken from large-scale investigations or reviews of previous measurements to ensure they represent the status of the whole Arctic.
Table 1. Typical values and uncertainties of snow, ice and pond properties during melting seasons

The total freeboards for both FYI and MYI are taken from one of the ICESat datasets presented by Reference Kwok, Cunningham, Zwally and YiKwok and others (2007). Snow depth is from the review by Reference Radionov, Bryazgin and AlexandrovRadionov and others (1997). Pond depth is taken from a summary of in situ pond measurements by Reference Morassutti and LeDrewMorassutti and LeDrew (1996), while pond fraction is from the review by Reference Fetterer and UntersteinerFetterer and Untersteiner (1998). Snow density is 330 kg m–3 for both FYI and MYI according to Reference WarrenWarren and others (1999), and ice density is assigned 920 kg m–3 for FYI and 880 kg m–3 for MYI based on a collection of ice density measurements presented by Reference Alexandrov, Sandven, Wahlin and JohannessenAlexandrov and others (2010).
Assigning uncertainties to each variable is more challenging. Reference Kwok and CunninghamKwok and Cunningham (2008) discussed the uncertainty in freeboard measurement by ICESat lidar altimetry and suggested a f = 5 cm. They also gave a fs the same value, which, though arbitrary, is consistent with the estimated uncertainty in snow depth retrievals using a snow radar (Reference KwokKwok and others, 2011), and also very close to the standard deviations of the large-scale snow depth measurements by Reference Kurtz and FarrellKurtz and Farrell (2011). To place this value in context, it represents almost 71% of the snow depth over FYI and 39% over MYI, perhaps an over-optimistic estimate. Better quantification of this value awaits a comprehensive assessment of the climatological, observational and modeling datasets of snow depth whose errors are presently not well constrained (Reference Kurtz and FarrellKurtz and Farrell, 2011). Uncertainty in pond depth can be estimated based on the standard deviations of in situ measurements (Reference Morassutti and LeDrewMorassutti and LeDrew, 1996), while uncertainty in pond fraction is assigned a value of 10% according to evaluations of retrieval techniques for melt ponds from satellite imagery (Reference Rösel and KaleschkeRösel and Kaleschke, 2011). Snow density shows a large spatial and temporal variability, so a value of 100 kgm–3 is assigned for ps (Reference WarrenWarren and others, 1999). Reference Timco and FrederkingTimco and Frederking (1996) reported the density of FYI is typically 840-940 kg m–3, while that of MYI is 720-940 kgm–3. Thus, uncertainties of 50 and 110kg m–3 are assigned for the densities of FYI and MYI respectively, to cover such a large range of variability.
4. Influence of Melt Ponds on Ice Thickness
An investigation of how the size of melt ponds (α and dp) affects the retrieved mean ice thickness is straightforward according to Eqns (3) and (4). The relative errors in mean ice thickness ![]() along with the varying pond size (α <50%, d
p<0.5 m), are shown in Figure 2 based on the typical values in Table 1.
along with the varying pond size (α <50%, d
p<0.5 m), are shown in Figure 2 based on the typical values in Table 1.
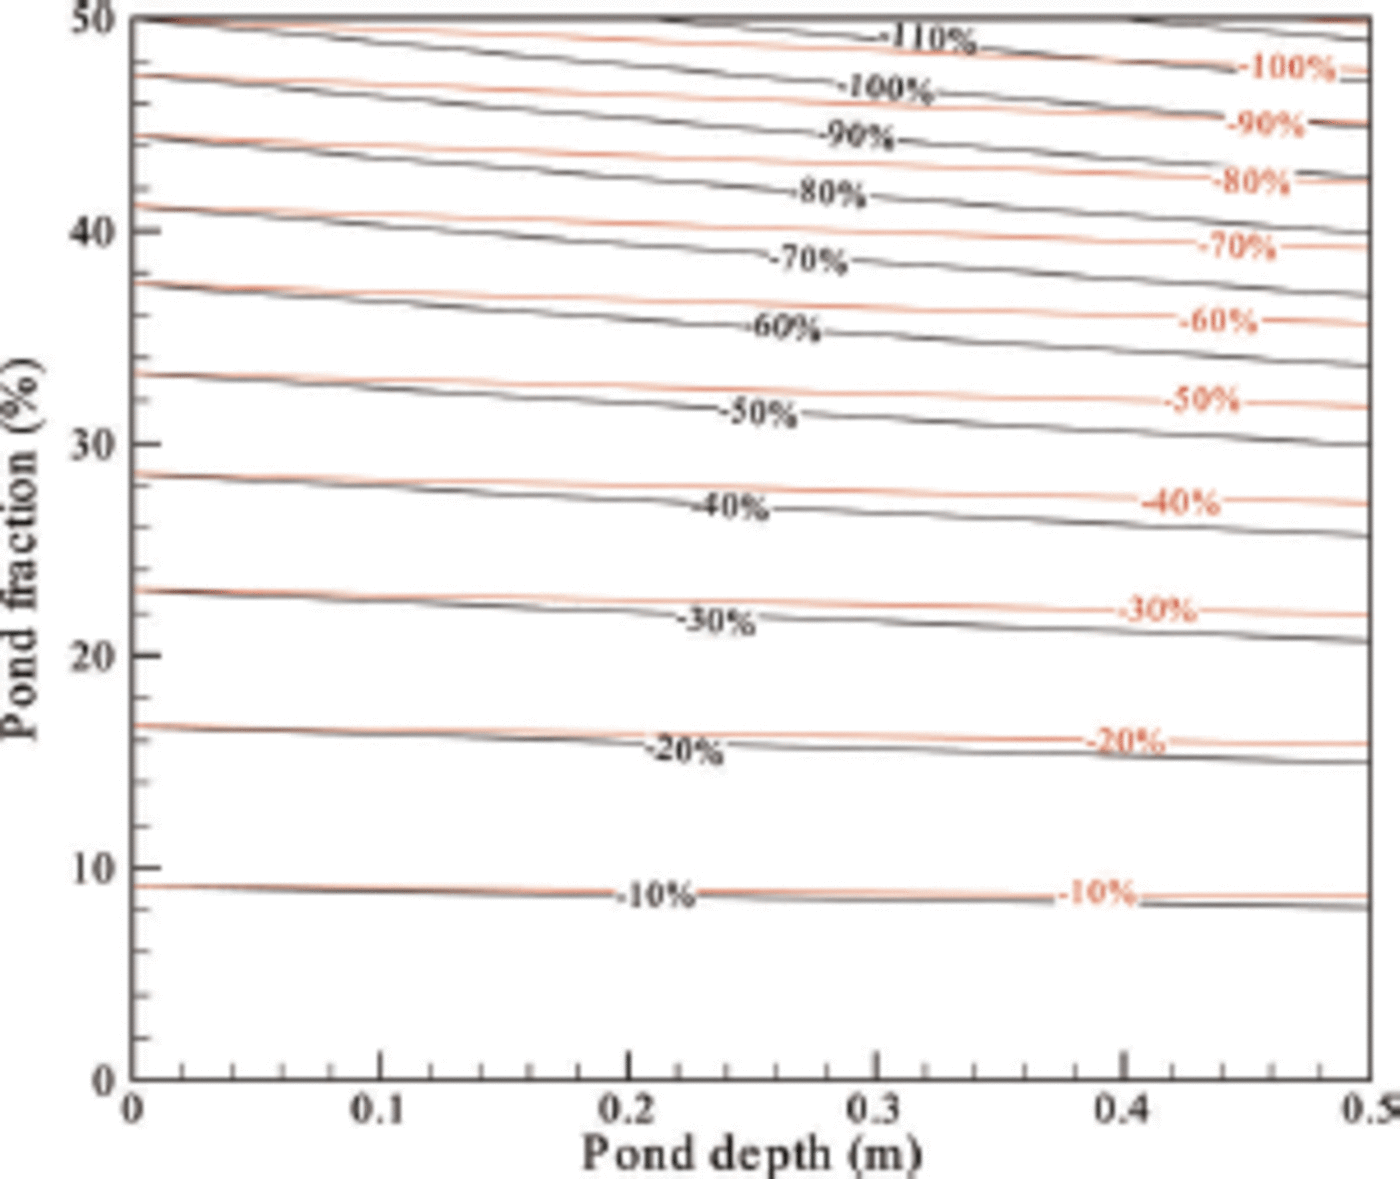
Fig. 2. The relative error in the retrieved mean ice thickness with varying surface melt pond size. Black lines are for FYI and red for MYI.
It is clear from Figure 2 that trends and values of the relative error are similar, although the inputs for FYI and MYI are different (h = 1.01 m and 1.62 m for the typical values of FYI and MYI in Table 1, respectively). All values of are negative, and the minimum of is less than -120% for FYI and less than -110% for MYI, indicating that the thickness of melting ice is much lower than that of ice without a melting surface although their freeboards are the same. Equation (4) cannot be applied to the case of melting ice, because a significant error will make the retrieval unreliable. Actually, such a difference between ![]() and h' can be explained by considering the change in the weight of ice floe before and after melting. According to Figure 1, a mass of spfsρs + s
p(d
p + f
i)pi is replaced by another mass of spdpρp
during the melting event, and then the change in floe weight is
and h' can be explained by considering the change in the weight of ice floe before and after melting. According to Figure 1, a mass of spfsρs + s
p(d
p + f
i)pi is replaced by another mass of spdpρp
during the melting event, and then the change in floe weight is
For typical Arctic sea ice (values in Table 1), undoubtedly m 1 <0. That is, the floe loses weight during melting, and less buoyancy is then necessary to achieve a new hydrostatic equilibrium compared with that before melting. As a result, the draft decreases, as does the total ice thickness.
The relative error in Figure 2 increases with increasing pond fraction and depth, showing that the mean ice thickness ![]() decreases if a pond extends its range in either the horizontal or vertical direction. Since
decreases if a pond extends its range in either the horizontal or vertical direction. Since ![]() is a weighted average of unponded ice thickness h and ponded ice thickness d
i, it is interesting to see how these two change with pond size (Fig. 3). It is surprising that the unponded ice thickness h increases with increasing pond depth but decreasing pond fraction (Fig. 3a), while the ponded ice thickness di
increases with both decreasing pond depth and fraction (Fig. 3b). To explain this, we must also consider the changes in floe weight as a surface pond extends its range (Fig. 4).
is a weighted average of unponded ice thickness h and ponded ice thickness d
i, it is interesting to see how these two change with pond size (Fig. 3). It is surprising that the unponded ice thickness h increases with increasing pond depth but decreasing pond fraction (Fig. 3a), while the ponded ice thickness di
increases with both decreasing pond depth and fraction (Fig. 3b). To explain this, we must also consider the changes in floe weight as a surface pond extends its range (Fig. 4).
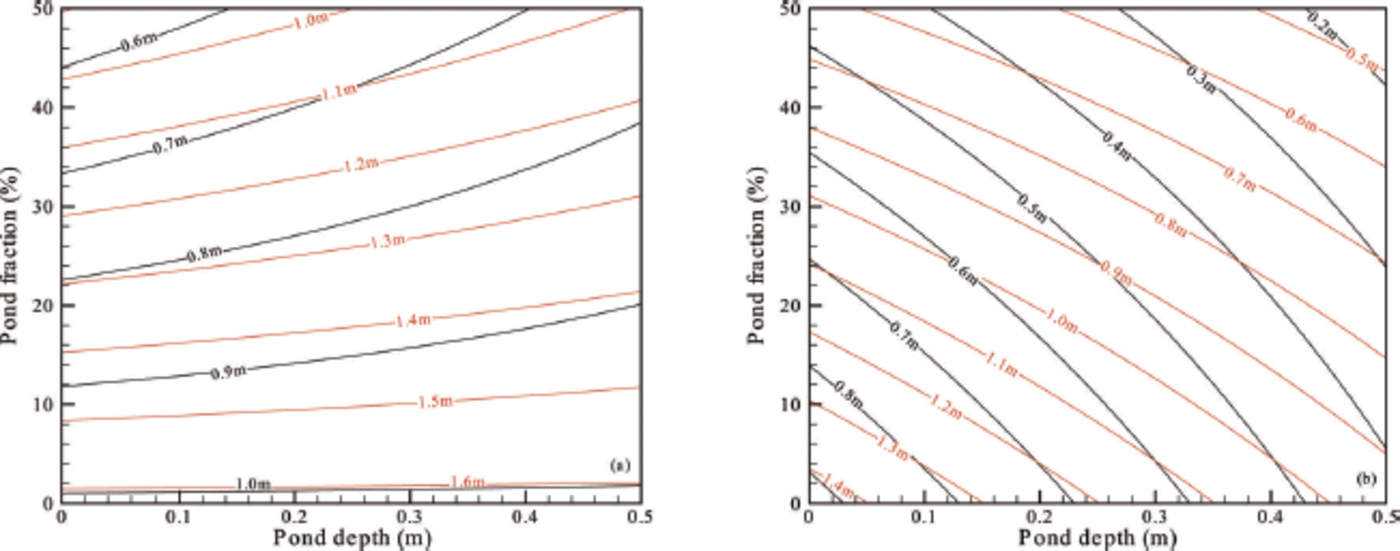
Fig. 3. Variations in (a) unponded ice thickness h and (b) ponded ice thickness d i for difference pond sizes. Black lines are for FYI and red forMYI.
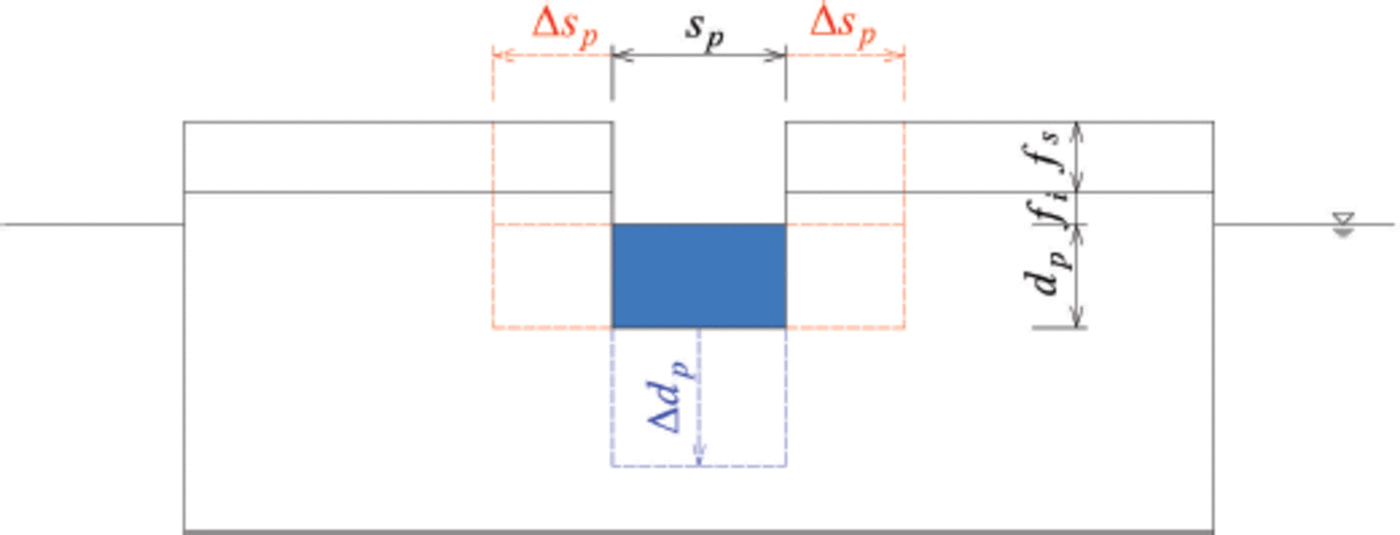
Fig. 4. Illustrations of melt pond deepening in vertical scale and extending in horizontal scale, to explain changes in floe weight during pond evolution.
If the pond depth increases by △dp, an ice volume with mass of sp △dpPi is replaced by a water volume with mass of sp dppp, resulting in a change in floe weight by
Similarly, if the pond widens its coverage by s p, an ice and snow volume fs spPs + (dp + f i) spPi is replaced by another water volume of d p s ppp, resulting in a change in floe weight by
For typical Arctic sea ice, ![]() and This means the floe gains weight when the pond extends on the vertical scale, while losing weight when the pond extends on the horizontal scale. As a result, the draft d increases with increasing pond depth but decreasing pond fraction, as does the unponded ice thickness h (Fig. 3a) because h=d+f-fs, where f and fs
are constants.
and This means the floe gains weight when the pond extends on the vertical scale, while losing weight when the pond extends on the horizontal scale. As a result, the draft d increases with increasing pond depth but decreasing pond fraction, as does the unponded ice thickness h (Fig. 3a) because h=d+f-fs, where f and fs
are constants.
To explain the behavior of di (Fig. 3b), variations in the draft as a response to the changes in floe weight must be further quantitatively investigated. For a positive ![]() Thus,
Thus,
Because ![]() will be negative for a positive △dp, i.e. a decrease in di
for an increase in dp
. Similarly, for a positive
will be negative for a positive △dp, i.e. a decrease in di
for an increase in dp
. Similarly, for a positive ![]() so
so
Because ![]() (according to △m3<0 in Eqn (9)), △di will also be negative for a positive △α, i.e. a decrease in di for an increase in a (Fig. 3b).
(according to △m3<0 in Eqn (9)), △di will also be negative for a positive △α, i.e. a decrease in di for an increase in a (Fig. 3b).
Overall, for an increase in pond fraction, both h and di
decrease, resulting in an enhanced decrease in the weighted-average ![]() while for an increase in pond depth, h increases but di
decreases, resulting in a weakened increase in
while for an increase in pond depth, h increases but di
decreases, resulting in a weakened increase in ![]() This is also why
This is also why ![]() and ε depend much more strongly on pond fraction than on pond depth (Fig. 2).
and ε depend much more strongly on pond fraction than on pond depth (Fig. 2).
5. Contributions to Uncertainty in Ice Thickness Retrieval
To study the uncertainty in retrieved ice thickness and contributions from different variables (f, fs, dp, α, βiw, βsw), all derivatives in Eqn (5) are calculated using the typical values in Table 1, and the results for FYI and MYI are presented in Figure 5. The contribution from a variable x is defined as the absolute value of ![]()
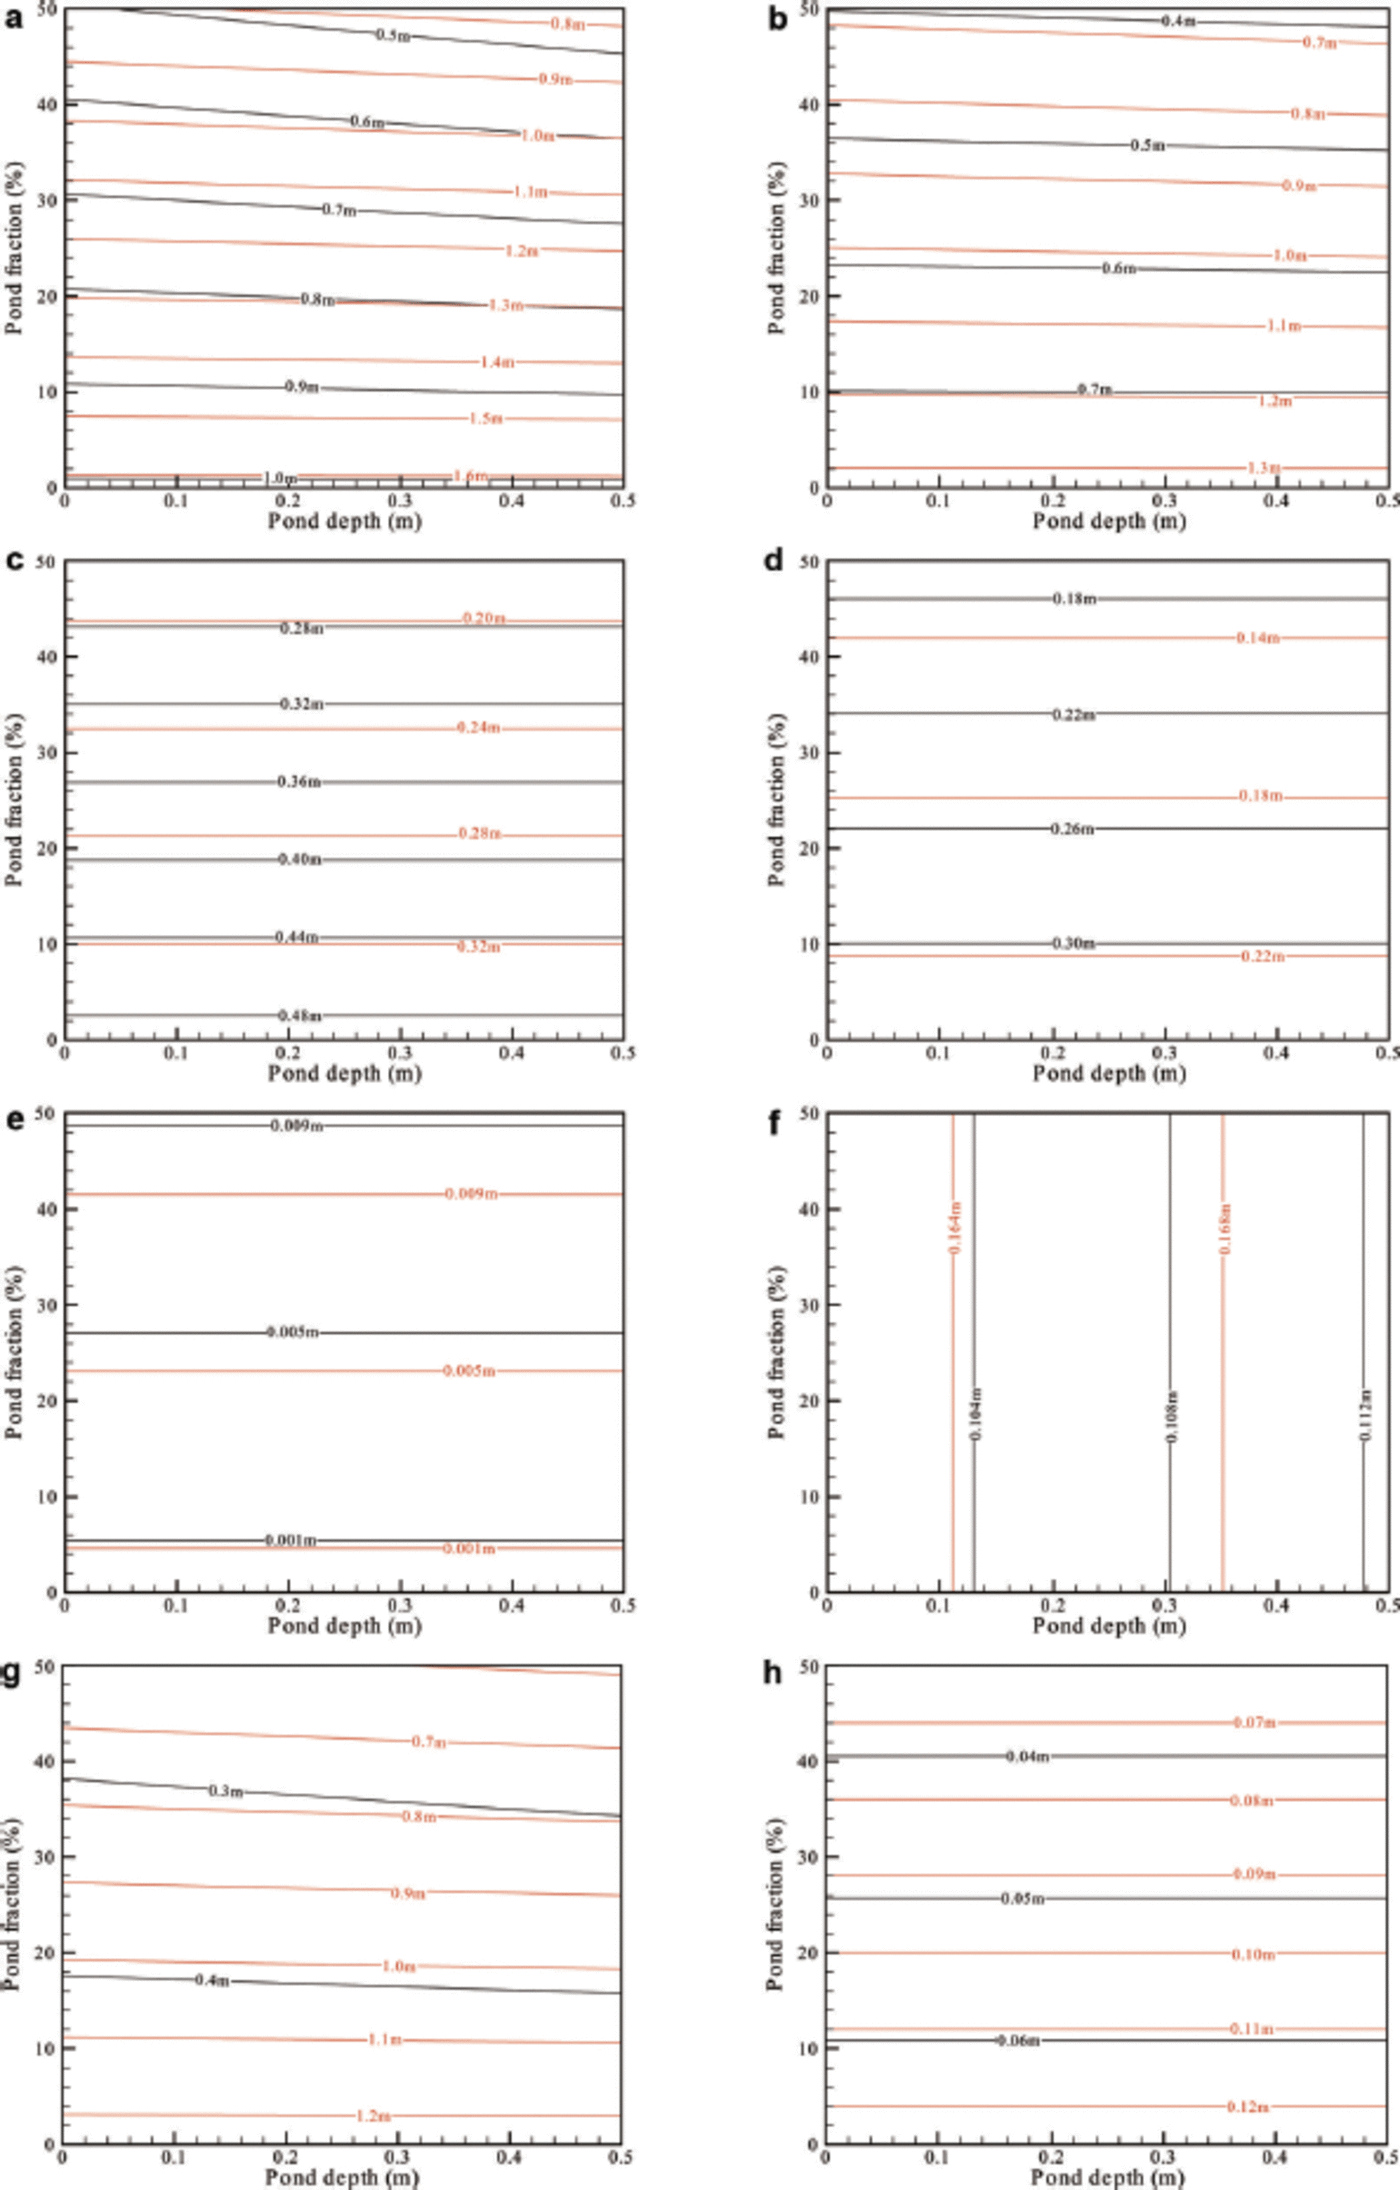
Fig. 5. (a) Retrieved mean ice thickness and (b) uncertainty in ice thickness, together with contributions from (c) freeboard, (d) snow depth, (e) pond depth, (f) pond fraction, (g) ice density and (h) snow density. Black lines are for FYI and red for MYI.
The first impression of Figure 5 is that the uncertainty contributions from all the variables depend mainly on pond fraction (Fig. 5c-e and h), except for that from pond fraction which depends exclusively on pond depth (Fig. 5f), and that from ice density which depends highly on pond fraction and slightly on pond depth (Fig. 5g). This is easily explained by Eqn (6) since the value of dp
only affects ![]() and
and ![]() As a result, the retrieved ice thickness (Fig. 5a) and total uncertainty (Fig. 5b) also depend highly on pond fraction and slightly on pond depth, indicating that information on pond fraction is more important than that on pond depth for accurately retrieving thickness of ice with surface melting. This is fortunate because with the present measurement technology, large-scale access to pond coverage using airborne or satellite sensors (Reference Lu, Li, Cheng, Lei and ZhangLu and others, 2010; Rosel and Kaleschke, 2011; Reference Kim, Hwang, Chung, Lee, Jung and MoonKim and others, 2013) is much easier than pond depth observations.
As a result, the retrieved ice thickness (Fig. 5a) and total uncertainty (Fig. 5b) also depend highly on pond fraction and slightly on pond depth, indicating that information on pond fraction is more important than that on pond depth for accurately retrieving thickness of ice with surface melting. This is fortunate because with the present measurement technology, large-scale access to pond coverage using airborne or satellite sensors (Reference Lu, Li, Cheng, Lei and ZhangLu and others, 2010; Rosel and Kaleschke, 2011; Reference Kim, Hwang, Chung, Lee, Jung and MoonKim and others, 2013) is much easier than pond depth observations.
Concerning the contributions from different variables, the freeboard (Fig. 5c), snow depth (Fig. 5d) and ice density (Fig. 5g) are the three main sources of the total uncertainty ![]() for both FYI and MYI. However, a difference is that for FYI the primary term is the contribution from freeboard, explaining nearly 40% of
for both FYI and MYI. However, a difference is that for FYI the primary term is the contribution from freeboard, explaining nearly 40% of ![]() while for MYI it is that from ice density, explaining nearly 80% of
while for MYI it is that from ice density, explaining nearly 80% of ![]() This agrees well with the result of Reference Alexandrov, Sandven, Wahlin and JohannessenAlexandrov and others (2010), in which ice density is always the primary source while contributions from freeboard and snow depth are relatively small for both FYI and MYI, but only for FYI with small freeboard (<0.07 m) does the freeboard contribution dominate the uncertainty in retrieved ice thickness. This implies that the accuracy of freeboard measurements is more important for FYI than for MYI in retrieving ice thickness during the melting season. As for pond size, the pond depth contribution is negligible compared with that from other variables (Fig. 5e), and the pond fraction contribution is also small though very stable (0.10-0.11 m for FYI and 0.16-0.17 m for MYI) (Fig. 5f). The snow density contribution is also small, although the uncertainty in snow density (30% of
ρs) is large (Fig. 5h).
This agrees well with the result of Reference Alexandrov, Sandven, Wahlin and JohannessenAlexandrov and others (2010), in which ice density is always the primary source while contributions from freeboard and snow depth are relatively small for both FYI and MYI, but only for FYI with small freeboard (<0.07 m) does the freeboard contribution dominate the uncertainty in retrieved ice thickness. This implies that the accuracy of freeboard measurements is more important for FYI than for MYI in retrieving ice thickness during the melting season. As for pond size, the pond depth contribution is negligible compared with that from other variables (Fig. 5e), and the pond fraction contribution is also small though very stable (0.10-0.11 m for FYI and 0.16-0.17 m for MYI) (Fig. 5f). The snow density contribution is also small, although the uncertainty in snow density (30% of
ρs) is large (Fig. 5h).
Among the contributions from variables, the difference between FYI and MYI results is not so obvious, except for the ice density contribution (Fig. 5g), in which the MYI result is 0.6-1.2 m and accounts for nearly 80% of the total uncertainty, compared with 0.2-0.5 m and 30% for FYI. This is attributed to the larger variability in the density of MYI than that of FYI (Reference Timco and FrederkingTimco and Frederking, 1996), again indicating the importance of ice density in ice thickness retrieval, especially for MYI.
The contributions from variables decrease with increasing pond fraction (Fig. 5c, d, g and h), except for the contributions from pond depth, which is opposite to the others, though the value is negligible (Fig. 5e), and pond fraction which depends exclusively on pond depth (Fig. 5f). Thus, the total uncertainty in ice thickness retrieval also decreases with increasing pond fraction (Fig. 5b). This shows that a small pond fraction will not only produce a large mean ice thickness but also result in a large uncertainty in ice thickness. However, the mean FYI thickness is 0.90 ± 0.70 m (1.45 ±1.20 for MYI) for a 10% pond coverage, whereas a 40% fraction gives a thickness of 0.56± 0.46 m (0.96 ±0.80 for MYI), indicating a relatively stable ratio of uncertainty to mean ice thickness, -0.8 for both FYI and MYI.
6. Comparison with Field Observations
To compare our study with the abundant field observations on ice thickness, the ratio of draft to freeboard, R=d/f, is deduced based on Eqn (2), because this value has often been reported to provide bases for the retrieval of altimetry data (e.g. Reference Doble, Skouroup, Wadhams and GeigerDoble and others, 2011):

The results of calculations based on Eqn (12) and Table 1 are shown in Figure 6. The R values increase with increasing pond depth but decreasing pond fraction, which is explained by the discussion of the behavior of ice draft d in Section 4, because R=d/f and the freeboard f is a constant. The ratio R for FYI, ranging from 3.0 to 6.2, is overall higher than that for MYI which is within the range 2.0-4.1. The upper limits of both FYI and MYI correspond to the no-melting case, a = 0, because a freeboard always produces a smaller draft for melting ice than for ice without a melting surface (see Section 4). Many field observations on ice thickness have also reported this value and are summarized in Table 2. It is clear that the reported values are scattering, but the derivations under different ice conditions are difficult to explain because of the absence of many important in situ parameters (e.g. surface loading). However, observations conducted during summer and fall, when surface melting occurs, are close to our calculations (Forsstrom and others, 2011; Reference Huang, Lei, Ilkka, Li, Wang and LiHuang and others, 2013), which supports the feasibility of the present model. The larger R value for FYI than for MYI is also consistent with field observations despite the different observation seasons (Reference Haas, Hendriks and DobleHaas and others, 2006; Reference Huang, Lei, Ilkka, Li, Wang and LiHuang and others, 2013).
Table 2. Summary of field observations on the ratio of ice draft to freeboard
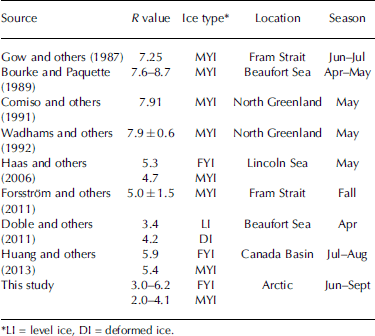
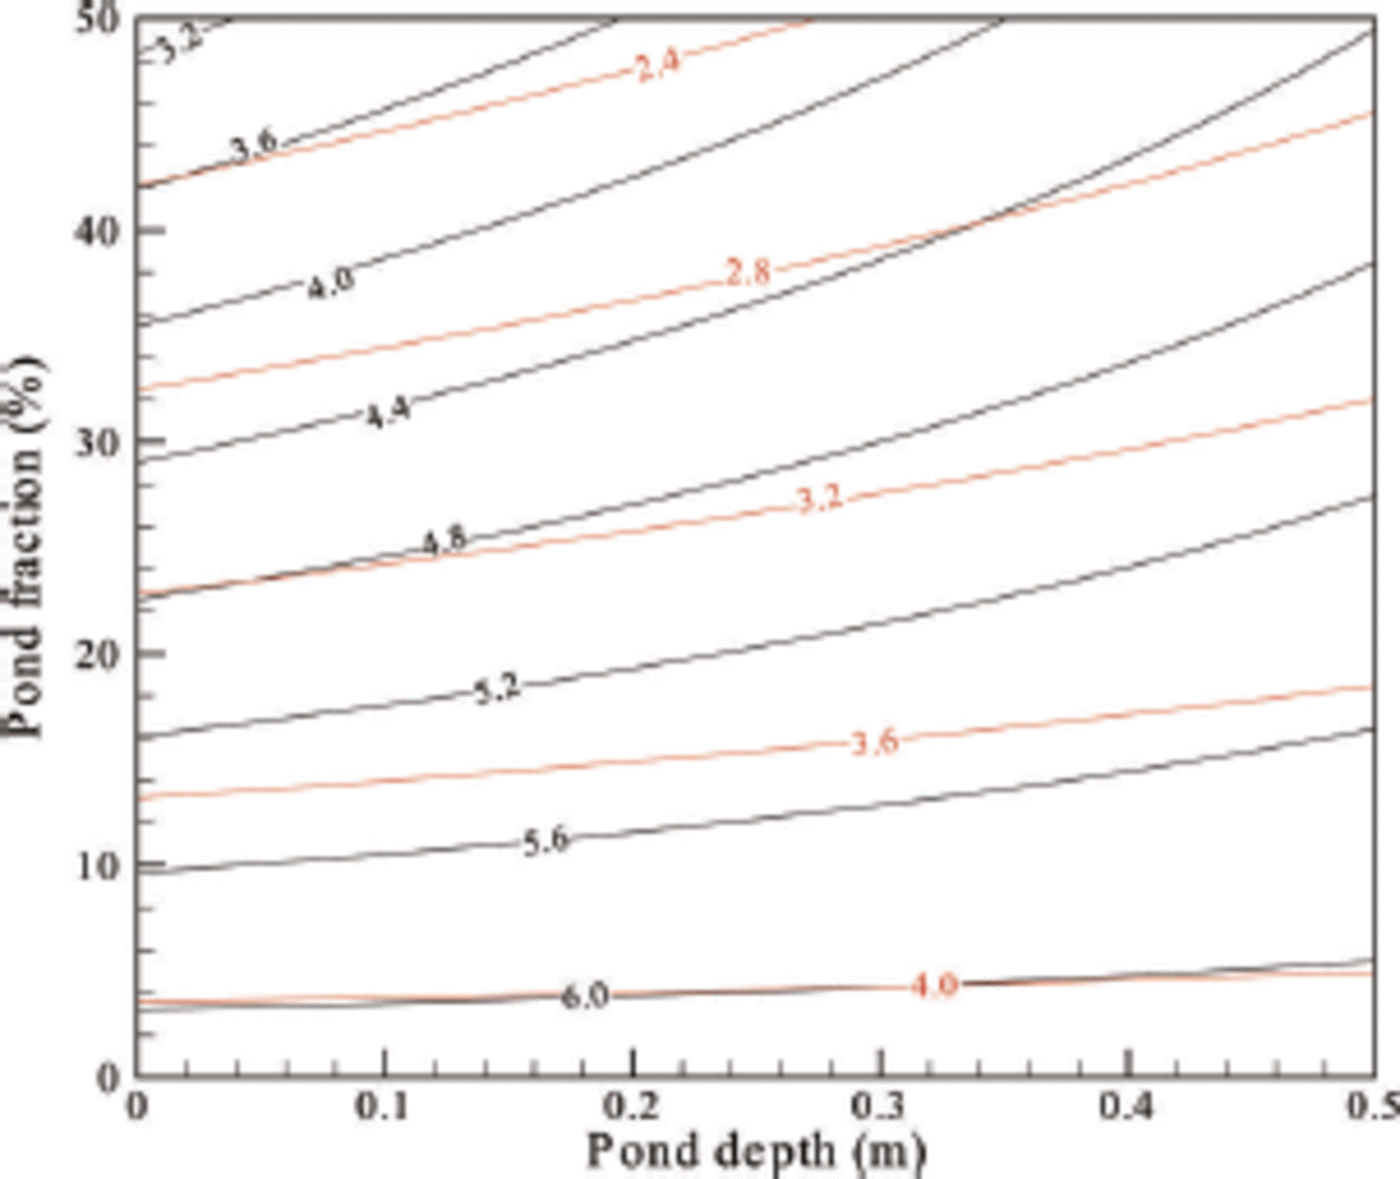
Fig. 6. Variations in the ratio of ice draft to freeboard R for different pond sizes. Black lines are for FYI and red for MYI.
7. Conclusions
To investigate the uncertainty in ice thickness retrieval from freeboard measurements using satellite altimetry during melting seasons in the Arctic, a theoretical model of the hydrostatic equilibrium of ice with surface melt ponds was developed, and a relationship between the mean ice thickness and freeboard, snow depth, pond depth, pond fraction, and densities of snow, ice, melting water and sea water was obtained.
Comparisons with the no-melting case indicate that the retrieved mean thickness of melting ice is much lower than that of ice without a melting surface although with the same freeboard, and the relative error is less than -120% for FYI and less than -110% for MYI. A loss of floe weight due to melting of snow and ice above the pond bottom causes this difference. However, things are more interesting during the melt pond evolution. A floe always gains weight when the surface pond extends on the vertical scale, but loses weight when the pond extends on the horizontal scale. As a result, both the draft d and the unponded ice thickness h increase with increasing pond depth but decreasing pond fraction, while the ponded ice thickness di increases with decreasing pond depth and fraction. As the weighted average of h and di, the mean ice thickness h increases with decreasing pond depth and fraction, but the dependence on pond fraction is much stronger than on pond depth.
The results of a sensitivity study show that uncertainty in retrieved ice thickness decreases with increasing pond fraction, while the dependence on pond depth is negligible, because contributions from variables are also mostly dependent on pond fraction. Freeboard is the major contributor to the uncertainty in retrieved ice thickness for FYI, explaining 40% of ![]() while ice density is the major source of uncertainty for MYI, explaining 80% of
while ice density is the major source of uncertainty for MYI, explaining 80% of ![]() demonstrating the importance of measurements of the freeboard of FYI and ice density of MYI in ice thickness retrieval during melting seasons. To compare with previous field observations, the ratio (R) of ice draft to freeboard was calculated. This value also increases markedly with decreasing pond fraction but slightly with increasing pond depth, similar to the behavior of ice draft d. The R values are higher for FYI (3.0-6.2) than for MYI (2.0-4.1), consistent with the results of field observations.
demonstrating the importance of measurements of the freeboard of FYI and ice density of MYI in ice thickness retrieval during melting seasons. To compare with previous field observations, the ratio (R) of ice draft to freeboard was calculated. This value also increases markedly with decreasing pond fraction but slightly with increasing pond depth, similar to the behavior of ice draft d. The R values are higher for FYI (3.0-6.2) than for MYI (2.0-4.1), consistent with the results of field observations.
This study provides a basis for retrieving ice thickness from possible freeboard measurements during melting seasons in future, but more validations from in situ Arctic ice thickness observations in summertime, such as that conducted during the 2010 Chinese National Arctic Research Expedition (CHINARE-2010) (Reference Huang, Lei, Ilkka, Li, Wang and LiHuang and others, 2013), are still necessary.
Acknowledgements
This research was supported by the National Natural Science Foundation of China (41276191 and 40930848), and the International Science and Technology Cooperation Projects of China (2011DFA22260). We thank all crew on R/V Xuelong for their help during CHINARE-2010 which was organized by the Chinese Arctic and Antarctic Administration. Special thanks go to Christian Haas of York University, Canada, for help with satellite altimetry interpretation. We also thank two anonymous reviewers for constructive comments and recommendations.


