


1. Introduction
In recent years, cooperative robotic systems have spread not only in industrialized environments, such as in Industry 4.0 [Reference Ronzoni, Accorsi, Botti and Manzini1–Reference Ribeiro, Lima, Eckhardt and Paiva4] but in everyday life. Automated machines have become more compact and affordable to the general end-user, encouraging a renewed trust towards robotics in business [Reference Wellmann, Stierle, Dunzer and Matzner5], automotive [Reference Clement, Veledar, Könczöl, Danzinger, Posch, Eichberger and Macher6], home care [Reference Park, Lee, Kim and Bien7], and healthcare [Reference Kyrarini, Lygerakis, Rajavenkatanarayanan, Sevastopoulos, Nambiappan, Chaitanya, Babu, Mathew and Makedon8, Reference Guang, Ji, Shi and Misgeld9]. In addition, more dedicated design choices enable efficient yet intuitive physical human-machine interaction (pHMI) [Reference Cherubini, Passama, Crosnier, Lasnier and Fraisse10–Reference She, Song, Su and Wang13]. pHMI-based technologies should consider additional uncertainties which can result from dissimilar behavioral attitudes due to psychological, sociological, or cultural differences or involve different physical-physiological characteristics [Reference Lalanne, Kanade and Kohlas14]. A well-posed pHMI-based technology should adjust to or dampen out these uncertainties, assuring safe operational conditions [Reference She, Song, Su and Wang13, Reference Pervez and Ryu15], satisfy appropriate efficiency, and avoid possible execution and evaluation errors, providing accurate and intuitive feedback responses [Reference Norman16]. The real-time control and monitoring of the contact forces are one of the main design specifications for pHMI applications. For this reason, the impact phenomenon can be managed by control logic architectures able to dampen out the non-linearities involved [Reference Flores and Lankarani17] and the variability of unknown parameters related to human reaction.
Control strategies are crucial to achieve maximum performance and confidence and improving ergonomics [Reference Bligård and Osvalder18], flexibility [Reference Laouenan, Dossou and Delahousse19], accuracy, and repeatability [Reference Kirschner, Schlotzhauer, Brandstötter and Hofbaur20]. pHMI-based technologies often focus on force control methods such as admittance control [Reference Keemink, van der Kooij and Stienen21–Reference Wang and Zhao23], impedance control [Reference Guang, Ji, Shi and Misgeld9, Reference Kana, Tee and Campolo24, Reference Choi, Gu, Lee and Lee25], and direct force control [Reference Yu, Zheng, Wang, Zhan and Song26]. Simpler design choices could be discarded over more complex control strategies involving adaptiveness [Reference Bower, Taheri and Wolbrecht27, Reference Li, Liu, Huang, Peng, Pu and Ding28], robustness [Reference Guo, Li, Jiang and Migorski29–Reference Alevizos, Bechlioulis and Kyriakopoulos31], and predictiveness. Among the different approaches available, MPC can be selected due to its internal robustness, dynamic performance, and capabilities to avoid constraint violations dictated by the plant and the actuation system [Reference dos Santos and Siqueira32–Reference Okada and Taneichi35]. In the MPC strategy, the system to be controlled is totally or partially known a priori, not only through a state space quadruplet representation but also in possible constraint equations involving both the plant and the actuation parts. The MPC can thus compute online the best control action by selecting it through a prediction of the gray-box model of the system. The MPC can be tuned through testing procedures such as Model-in-the-loop (MIL), Hardware-in-the-loop (HIL), and Human-in-the-loop (HuIL) [Reference Chipalkatty, Daepp, Egerstedt and Book36]. MPC-based techniques have a considerable range of applications. For example, while in dos Santos et al. [Reference dos Santos and Siqueira32] an MPC loop is used to find optimal stiffness parameters for a lower limb-rehabilitation exoskeleton impedance controller, Erickson et al. [Reference Erickson, Clever, Turk, Liu and Kemp33] couples the MPC with a learning-based model for pHMI-assisted dressing. Moreover, Teramae et al. [Reference Teramae, Noda and Morimoto34] and Okada et al. [Reference Okada and Taneichi35] exploit MPC online calculations to adapt the control algorithm, respectively, to assist a patient rehabilitative movement only when needed or to comply with various pHMI proficiency levels during limb motion training and rehabilitation.
In previous works from the authors [Reference Pacheco Quiñones, Paterna and De Benedictis37, Reference Paterna, Pacheco Quiñones, De Benedictis, Maffiodo, Franco and Ferraresi38], an MPC algorithm is developed to impress on a target human body a well-defined and tunable force impulse during posturography trials, in which human balance is assessed for clinical purposes. The system consists of an electric actuator and a hybrid force/speed control architecture. Previous MIL and HIL tests highlighted the adequate dynamic performance of the perturbation device, with some limitations in the accuracy of impulse and force profile tracking [Reference Pacheco Quiñones, Paterna and De Benedictis37]. The switching behavior of the proposed control logic led to an undesired delay between human-device contact and the actual control of the force signal. A renewed control logic able to bypass the issue is preliminarily presented in Paterna et al. [Reference Paterna, Pacheco Quiñones, De Benedictis, Maffiodo, Franco and Ferraresi38], of which the present paper represents an extended version. The proposed solution’s control performance, flexibility, and robustness are verified in a wider scenario, including HIL and HuIL trials.
2. Model predictive control to manage human-machine interaction
2.1. General description of the plant and the control problem
The objective of control design is the regulation of the contact force in the impact between the body of a human subject and an external automatic perturbation device. In the following, a brief presentation of the control logic formulation is reported, with additional details included in Pacheco et al. [Reference Pacheco Quiñones, Paterna and De Benedictis37]. The control input (u) and the output (y) of the plant model, sketched in Fig. 1, are the device force control signal and the contact force at the pHMI interface, respectively. The plant lumped-parameter model treats the device and the human target as 1 degree of freedom (dof) point masses connected to the environment through springs and dampers. Each connection represents a physical constraint to the oscillation of the corresponding mass. Thus, spring and dampers characteristics can be appropriately modulated to exhibit the desired behavior. Although this approach greatly simplifies any human-machine interaction, which generally is multidimensional (up to 6 dof), it enables the modeling of several pHMI scenarios with different dynamics. During the impact, a viscoelastic element connects the device and the target, so the contact force is modeled as an internal force, and contact loss is unmodeled.

Figure 1. A sketch of the 1 degree of freedom plant model.
More accurate models of impact phenomena are possible but require information about the bodies’ relative penetration, speed, and damping [Reference Flores and Lankarani17]. These parameters are difficult to measure or estimate, so it is necessary to introduce dedicated sensors, which increase the bulkiness and system complexity. Although the gap between the model and the reality directly impacts the control performance, a simplified model is preferred to find a tradeoff between algorithm performance, simplicity, and computational cost.
The MPC bases its action on minimizing a customizable cost function through quadratic program optimization [Reference Rawlings, Mayne and Diehl39]. The cost function is a weighted quadratic sum over H p (i.e., prediction horizon) time steps of the following control parameters: the tracking error ey with respect to the reference signal, the control input u, and its rate du. These three parameters are tuned through the weights Q, Ru, and Rdu, respectively. Other weights considered for the cost function optimization are the terminal cost Sy over the output (i.e., contact force)
 $\boldsymbol{y}$
and slack variable soft constraint violation weight
$\boldsymbol{y}$
and slack variable soft constraint violation weight
 $\boldsymbol{\rho}_{\boldsymbol{\epsilon}}$
. All weights are usually diagonal matrices. Among different strategies, this cost function structure is selected due to its overall composition and software implementation simplicity.
$\boldsymbol{\rho}_{\boldsymbol{\epsilon}}$
. All weights are usually diagonal matrices. Among different strategies, this cost function structure is selected due to its overall composition and software implementation simplicity.
The higher the tunable weight, the greater the minimization of the respective parameter during the optimization process. In other words, increasing Q leads the algorithm to focus on minimizing the output tracking error while increasing Ru or Rdu reduces, respectively, the control input value and its speed. However, as the cost function is a sum of intercurrent addenda, the optimization of one of the three parameters (ey, u, du) occurs at the expense of the other two. Therefore, increasing Q reduces the output tracking error but at the same time increases the ringing due to higher control input and control input speed [Reference Rawlings, Mayne and Diehl39].
The quadratic program optimization is subject to the state space representation quadruplet, actuation, and plant parameter constraints, such as the maximum permissible contact force (u max). At the beginning of the impact, the control input can be saturated to a predefined value (u sat) for a predefined time interval (Sdt) to compensate for the impact phase non-linearities unmodeled in the plant model due to the reasons mentioned above. u sat and sat must be set accordingly to the desired contact force magnitude.
The control input can be further enriched by varying tunable weights during the MPC action, that is, the time interval from the end of the Sdt to the end of the perturbation. As the cost function is updated online step-by-step, an interpolating behavior between initial and final generalized weight values W 0 and W end is expected. In this solution, weights are time-dependent and made to follow the ramp expression, which has been arbitrarily chosen:
 \begin{align} W\left(t\right)=W_{0}+\frac{W_{\mathrm{end}}-W_{0}}{dt_{\mathrm{strike}}-Sdt}t \end{align}
where dt strike is the perturbation onset.
2.2. MPC application to dynamic posturography
The presented MPC algorithm can be used to control the mechanical disturbances (i.e., perturbations) provided to a patient’s body [Reference Pacheco Quiñones, Paterna and De Benedictis37, Reference Paterna, Pacheco Quiñones, De Benedictis, Maffiodo, Franco and Ferraresi38, Reference Ferraresi, Maffiodo, Franco, Muscolo, De Benedictis, Paterna, Pica, Genovese, Pacheco Quiñones, Roatta and Dvir40] to investigate balance and posture issues. Preliminary studies highlighted that the force impulse (force-time integral, FI) resulting from the contact should range within 2–10 Ns to elicit a detectable postural response and, at the same time, to keep the subject in the standing position without any risk of falling [Reference Paterna, Dvir, De Benedictis, Maffiodo, Franco, Ferraresi and Roatta41, Reference Dvir, Paterna, Quargnenti, De Benedictis, Maffiodo, Franco, Ferraresi, Manca, Deriu and Roatta42]. To obtain the desired FI in a brief time, comparable with the neuromuscular response time, a rectangular force profile of 250 ms and a magnitude between 20 N and 50 N was chosen as the reference force profile.
The application of the mechanical disturbances is performed by means of the perturbation device, as shown in Fig. 2a, whose architecture has already been outlined in previous works [Reference Pacheco Quiñones, Paterna and De Benedictis37, Reference Paterna, Pacheco Quiñones, De Benedictis, Maffiodo, Franco and Ferraresi38]. It includes a tubular electric linear motor (1) (GD160Q, NiLAB GmbH, Klagenfurt am Woörthersee, Austria), allowing accurate rod motion control while developing the high acceleration necessary to meet the specifications of the contact force profile. The stroke of the actuator (100 mm) has been selected to compensate for relative motion between the device and the patient’s body. The actuator is controlled by a Simulink® (MathWorks Inc., Natick, MA, USA) operated real-time target machine (Speedgoat Inc., Natick, MA, USA) and a single-axis servo controller (SLVD1N, Parker Hannifin Corp., Cleveland, OH, USA), and triggered through a pushbutton (5). The contact force is monitored by a calibrated load-cell sensor (2). At the end of the rod, the striking interface is adequately covered by an expanded polyethylene layer (4), and its displacement is monitored by the motor’s embedded encoder and a laser sensor (3), serving for limit-switch purposes.

Figure 2. Perturbation device’s rendering (a); perturbation system (b).
A trained operator must place the device about 10–20 mm away from the patient’s body before perturbation generation, as shown in Fig. 2b. The flexibility introduced by an operator directly maneuvering the device enables the customization of several perturbation features, namely the point of application, the direction, and the reference contact force profile through a dedicated interface. Although the unknown compliance of the operator represents a challenge to system robustness and repeatability, the handheld configuration is advantageous because it reduces the implementation cost, the bulkiness and ensures the system’s portability. The control action should produce repeatable contact force and dampen out all the uncertainties coming from the non-linearities of the impact and the physiological and behavioral changes in both the patient and the operator.
2.3. Control logic of the perturbation device
The control of the perturbation device is based on the finite state machine criterium. The device’s states are as follows:
-
1. Idle: the perturbator’s rod is fully retracted. During this state, the operator may issue sensor calibrations or tune the control action;
-
2. Operational: issued by a trigger signal from the operator by the hardware pushbutton or via the user interface. The operational state includes the following phases:
-
3. Approach: in which the motor’s rod is moved forward with a predefined approaching speed (v a);
-
4. Strike: in which the rod end reaches the target, and the control algorithm manages to impress a predefined FI stimulus. The strike phase is triggered once the load-cell measurement overcomes a threshold value (3 N) over three consecutive time steps (3 ms). Otherwise, upon reaching a threshold displacement detected by the optical sensor, the rod automatically moves to the retraction phase;
-
5. Retraction: in which the motor’s rod is moved backward with a predefined retraction speed (v r) and stopped with a limit switch detected by the optical sensor;
-
6. Emergency: triggered by pressing again the pushbutton, the motor immediately stops working.
2.4. Control logic implementation
The motor’s driver software is of paramount importance as an intermediary between the Simulink environment and the linear electric motor. The driver can work with several operating modes and implements a pico-PLC for logical operations. The one selected is the speed control mode. As in Fig. 3, the speed control mode can be divided into the following main blocks:

Figure 3. Overall control scheme, with the SLVD1N driver in speed control operating mode.
-
• Speed closed-loop control: involving as reference an analog input coming from the real-time target machine and the speed measured by the motor’s embedded encoder as feedback. Before entering the loop, the driver modulates the reference speed through accelerations and deceleration ramps (1). An integrative controller on the speed tracking error performs the control action. A first-order low pass filter (2) (cutting frequency f c = 248 Hz) was selected as a tradeoff between the introduced delay (≅ 4 ms) and noise dampening.
-
• Current saturation block (3): limiting the actuation force by saturating the control input. The threshold value is the minimum among various inputs, such as peak current, nominal current (only when thermal protection is active), and the auxiliary analog input, which is a voltage signal (gain equal to 5.79 N/V) meant for possible online operation on force thres holding.
The approach and retraction phases are performed through the speed closed-loop control by imposing proper and constant reference speed values via Simulink. The strike phase is actuated by increasing the reference speed (v s = 0.6 m/s), selected high enough to saturate the speed control loop in a few milliseconds. With the speed control loop saturated, the force control loop is closed by employing the MPC controller, acting through the auxiliary analog input, and having as feedback the contact force registered by the load cell, as shown in Fig. 3. Acting on the force loop only, all MPC tunable weight matrices presented in Section 2.2 are scalar quantities. In addition, the toggling between the speed and force control modes, which negatively affected the results presented in Pacheco et al. [Reference Pacheco Quiñones, Paterna and De Benedictis37], is avoided.
3. Hardware and human-in-the-loop testing and discussion
3.1. Testing setup and evaluation criteria
Two different testing setups have been considered and analyzed:
-
• Hardware-in-the-loop (HIL), in which a dedicated test bench, presented in [Reference Pacheco Quiñones, Paterna and De Benedictis37] and depicted in Fig. 4, is employed to assess the performance of the perturbation device in a controlled environment.
-
• Human-in-the-loop (HuIL), in which one or more operator handheld the device to hit a rigid fixed target or a healthy subject’s back (Fig. 2). HuIL tests are needed to evaluate the performance of the device in a more realistic scenario.

Figure 4. Test bench configuration for HIL. A detailed description of all elements is reported in [Reference Pacheco Quiñones, Paterna and De Benedictis37].
In both working configurations, experimental tests aim to optimize the device’s performance and evaluate its accuracy, robustness, and flexibility. To this end, four trial sessions were held:
-
A. Parameters tuning. Firstly, the control action parameters Q, R u, R du, H p, Sdt, u sat, and v a are tuned in the HIL configuration, (Q, R du) additionally varying linearly according to (Eq. (1)). Then some of them (Q, R u, H p, Sdt) are adjusted through an experimental series carried out by a trained operator on a fixed rigid target, with R du additionally varying linearly according to (Eq. (1)). HuIL tests are needed due to differences between the test bench and the operative condition and to set additional parameters, such as modeled operator stiffness ka . In all these tests, a rectangular pulse of 40 N and 250 ms is selected as the reference force signal in the strike phase. Five consecutive stimuli are performed for each parameter configuration.
-
B. Control accuracy. The device performance in HIL configuration is compared to the result obtained with the hybrid force/speed control architecture [Reference Pacheco Quiñones, Paterna and De Benedictis37] to highlight the force-tracking improvement. Rectangular pulses of 50 N lasting [50, 100, 150, 250] ms are selected as force reference profiles. Five perturbations are performed for each force profile.
-
C. Control robustness test. The control robustness is verified by recruiting 10 untrained operators (7 males; 3 females; 24–52 years) to hit a fixed rigid target. In this series, the perturbations had the same duration (250 ms) but different force magnitudes [20, 30, 40, 50] N. Each operator provided 22 perturbations, the first two to familiarize with the device and then five perturbations for each force level in random order.
-
D. Control flexibility test. Finally, the control flexibility is verified by evaluating the device performance for different perturbation magnitudes (rectangular pulses of [20, 30, 40, 50] N and 250 ms) in both HIL and HuIL configurations. The latter involved only one operator using the device against a fixed target and on a healthy subject. Five perturbations are performed for each profile and working configuration.
In all the tests, the device performance is evaluated by the following two percentual indices: the Tracking Accuracy Error (TAE) (Eq. (2)) and the Force Impulse Deviation (FID, calculated when the contact force is higher than 3 N) (Eq. (3)).
 \begin{align} \mathrm{TAE}=100\frac{\int _{{\triangle} t}\left| f_{m}-f_{r}\right| }{FI_{r}}\% \end{align}
 \begin{align} \mathrm{FID}=100\frac{\text{FI}_{m}-\text{FI}_{r}}{\text{FI}_{r}}\% \end{align}
where Δt is the contact time interval; f r and f m are the reference and measured force values; FIr and FIm are the reference and measured impulse values. FID and TAE in the text are expressed as mean ± standard deviation values.
3.2. A: Tuning results
3.2.1. HIL parameters optimization
The results of the HIL tests that consider only constant weights for the MPC algorithm are shown in Fig. 5 and summarized in Table A1 in Appendix A:
-
• High Q values minimize the control output error; hence, the force signal rapidly reaches the reference value. On the other hand, increasing Q reduces du optimization. The resulting quick control input variation leads to increased ringing, especially in the second part of the perturbation (see Fig. 5a). The lower value (Q = 1) is chosen.
-
• As R u increases, the control input decreases to balance the initial overshoot at the expense of tracking error minimization. Consequently, the average force magnitude is lower than the reference value. On the other hand, decreasing R u means higher control input values during the whole strike time interval, increasing the tracking error in the last steps. R u has been selected as a tradeoff value between the two behaviors (R u = 0.2, see Fig. 5b).
-
• Increasing R du leads to longer settling time due to the control input speed reduction; however, a low value of R du causes a greater undershoot due to the sharp decrease of the control input. R du has been selected as a tradeoff between the two behaviors (R du = 5, see Fig. 5c).
-
• Compared to the previous parameters, the variation of the power of prediction of the controller H p has less effect on the system output, maybe due to the simplified assumptions of the model. Therefore, the lowest H p value (H p = 10) has been set to avoid high computational costs (see Fig. 5d).
-
• Finally, Sdt, u sat, and v a should be appropriately set (Sdt = 10 ms, u sat = 45 N, v a = 0.25 m/s) and adapted to the magnitude of the reference force value to reduce the initial overshoot (equal to about 16% of the force reference value) by maintaining a limited rising time (4.4 ± 0.55 ms) (see Fig. 5e, f, g).

Figure 5. HIL force tracking for different values of the tuning parameters. Reference force signal are black, and each colored line is the measured contact force profile averaged over five consecutive stimuli. Profiles, tuning parameters, and their respective performance indices are reported in Appendix A, Table A1.
The final configuration of the parameters (Fig. 5h, continuous red line) highlights good performance: the contact force is almost constant and close to the reference throughout the considered time interval. Moreover, FID and TAE are (1.39 ± 0.44)% and (11.6 ± 0.44)%, respectively.
At this point, the tuning is finished through the time-varying control weights. To rapidly reach the force reference value while maintaining a stable force profile in the last part of the strike phase, the effect of a decreasing linear pattern of Q is investigated (Q 0 = 10; Q end = 1). As expected, the new force profile (Fig. 6, red dotted lines) oscillates around the reference force value earlier. However, due to the increased
 $R_{du}$
weight, the control input does not decrease fast enough to follow the reference value stably, showing worse performance than the optimized constant parameters setup (Fig. 5h, Table A1, g row).
$R_{du}$
weight, the control input does not decrease fast enough to follow the reference value stably, showing worse performance than the optimized constant parameters setup (Fig. 5h, Table A1, g row).

Figure 6. Force tracking (left) and control input (right) of the HIL test by imposing Q equal to constant 1 (blue dash-dot lines), constant 10 (green lines), and a linear function from 10 to 1 (red dotted lines). Each colored line represents the experimental result averaged over five consecutive stimuli. The reference force signal is black. The bottom plots show details of the two graphs on top.
The increasing linear pattern of R du (R du,0 = 5; R du,end = 10) is also tested. Increasing R
du
makes control input less sensitive to
 $e_{y}$
and reduces ringing at the end of the strike. The control input and force profiles are shown in Fig. 7. FID and TAE of the force profile obtained with the non-constant R du value are respectively equal to (0.42 ± 0.34)% and (11.4 ± 0.24)%, showing slightly better performance than the optimized constant parameters setup (Fig. 5h).
$e_{y}$
and reduces ringing at the end of the strike. The control input and force profiles are shown in Fig. 7. FID and TAE of the force profile obtained with the non-constant R du value are respectively equal to (0.42 ± 0.34)% and (11.4 ± 0.24)%, showing slightly better performance than the optimized constant parameters setup (Fig. 5h).

Figure 7. Force tracking (left) and control input (right) of the HIL test by imposing Rdu equal to constant 5 (dash-dot lines), constant 10 (green lines), and a linear function from 5 to 10 (red dotted lines). Each colored line represents the experimental result averaged over five consecutive stimuli. The black lines are the reference force signals. The bottom plots show details of the two graphs on top.
3.2.2. Human-in-the-loop-optimization result
A previous work [Reference Paterna, Pacheco Quiñones, De Benedictis, Maffiodo, Franco and Ferraresi38] focused on the identification of the best set of parameters for the handheld configuration. The tuning parameters were Ru, Q, Hp, Sdt, and ka as the operator stiffness ka is not known a priori. R du, u sat, and v a were kept constant and equal to 10, 52 N, and 0.3 m/s, respectively. The most accurate force profile (Q = 3, R u = 0.2, k a = 15,000 N/m, H p = 20, Sdt = 15 ms) is shown in Fig. 8a, with FI = 10.4 ± 0.56 Ns, FID = −3.68 ± 5.61%, TAE = 13.6 ± 2.30%. Although increased with respect to the best profile presented in the HIL test (Fig. 8b, c), the variability of the perturbation magnitude is comparable with that observed in previous experimental studies [Reference Paterna, Dvir, De Benedictis, Maffiodo, Franco, Ferraresi and Roatta41–Reference Chen, Lee and Aruin44]. Moreover, FID and TAE mean values are, respectively, still less than 5% and 15%. Finally, the initial undershoot is due to the dynamics occurring after the impact, involving the rebound between the motor end and the target. Indeed, a partial loss of contact occurs, and it is quickly balanced by the controller.
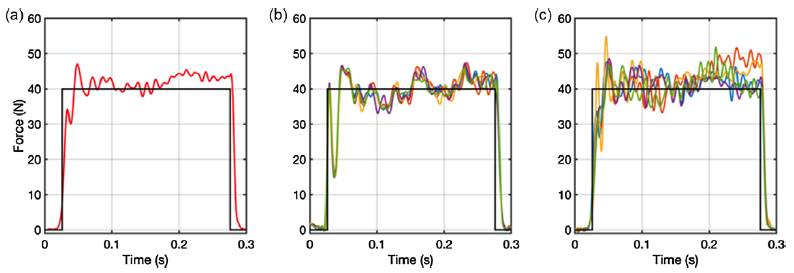
Figure 8. HuIL force tracking averaged over 5 consecutive stimuli (a). Five stimuli registered with the optimal parameter configuration in HIL (b) and HuIL (c) tests. The reference force signal is black.
For the same reason explained in Section 3.2.1, the non-constant Rdu trend is tested (Rdu,0 = 5; Rdu,end = 10). However, as shown in Fig. 9, introducing the time-varying control weight (red dotted lines) does not significantly improve the tracking performance. TAE of the force profile obtained with the non-constant R du value is equal to 13.05 ± 0.85%, and does not differ significantly from the TAE value obtained with constant R du = 10 (Fig. 9, green lines). The non-constant weight control is no longer successful, perhaps due to the increased data variability due to the operator handling the device.

Figure 9. Force tracking (left) and control input (right) of the HuIL test by imposing Rdu equal to constant 5 (blue dash-dot lines), constant 10 (green lines), and a linear function from 5 to 10 (red dotted lines). Each line is averaged over five consecutive stimuli, black lines being the reference signal. The bottom plots show details of the two graphs on top.
3.3. B: Control accuracy
The achieved HIL results can be compared to the force profile (rectangular wave of 50 N, 250 ms) obtained with the previous version of the control logic based on a hybrid force/speed control architecture tested in HIL [Reference Pacheco Quiñones, Paterna and De Benedictis37]. As highlighted in Fig. 10 (dotted blue line), the toggling between the speed and force loops introduces a delay between the initial actuator-target contact and the actual stimulus. The toggling, in fact, is operated by the pico-PLC embedded into the driver, which has a finite update rate. This introduces unwanted transient dynamics to the contact phenomenon, with losses in terms of raising time and overall tracking error. The present control logic, based on the modulation of the saturation current, allows to overcome the toggling and significantly improves the device performance (see Fig. 10, continuous red line). The HIL’s FID and TAE of the most accurate force profile obtained in Pacheco et al. [Reference Pacheco Quiñones, Paterna and De Benedictis37] are about [−15; 24]%, compared to this paper in which they are about [−0.56; 12]%. In the latter, the apparent high value of TAE is mainly due to the non-instantaneous falling edge of the perturbations.

Figure 10. Comparison between the hybrid force/position control logic architecture (dotted blue line) in HIL [Reference Pacheco Quiñones, Paterna and De Benedictis37] and the current control logic in HIL (continuous red line). The force profiles are averaged over five stimuli. The black line is the reference force signal.
Thanks to the elimination of the initial delay, good results are also obtained for less-lasting perturbations without changing the optimization parameter, as shown in Fig. 11. Short-lasting perturbations are generally less accurate than longer ones due to the greater influences of the impact’s non-linearities and the initial kickback. Therefore, by reducing the duration, the FID increases from 0.19% (150 ms) to −1.3% (100 ms) to 5.2% (50 ms), while TAE increases from 15% (150 ms) to 19% (100 ms) to 31% (50 ms). However, maintaining the same optimized tuning parameters avoids the large overshoot highlighted in the short-lasting force profile in Pacheco et al. [Reference Pacheco Quiñones, Paterna and De Benedictis37], which could be unsafe for the patient.

Figure 11. Force tracking of 50 ms (a), 100 ms (b), 150 ms (c) perturbation profile in HIL configuration. Each line is averaged over five consecutive stimuli, black continuous lines being the reference signal.
3.4. C: Control robustness
Ten different operators are recruited. Each of them handles the prototype to hit a fixed target to assess the effect of operator behavior on device performance. Posing the same reference duration of 250 ms, reference magnitudes f r and force impulses FIr are, respectively, equal to (20,30,40,50) N and (5.0,7.5,10.0,12.5) Ns. The 10 averaged contact force profiles, shown in Fig. 12 and Table A2, reported in Appendix A, show similar behaviors per reference force profile. With a coefficient of variation less than 5% on average per reference profile, the test demonstrates that the device performance is not strongly affected by the variability introduced by the operator. This result confirms the control system’s robustness regardless of the subject’s characteristics handling the perturbation device. In addition, the results emphasize the feasibility of the handheld configuration, which represents a compact and easy-to-use solution.

Figure 12. Force profiles by 10 operators. Each curve is the mean over five consecutive stimuli.
3.5. D: Control flexibility
The device flexibility is evaluated by testing different magnitudes reference force profiles in both testing setups (HIL, HuIL). Only one operator is recruited for HuIL tests. The operator first hit a rigidly fixed target and then a healthy subject. The reference force profiles are selected equal to Section 3.4. The results, shown in Fig. 13 and Table A3, reported in Appendix A, highlight that the data variability increases in the handheld condition. Despite this, the performance is still satisfactory, and the FI coefficient of variation is equal to 2.51% on average. Although the increasing variability, only slight differences are evident among HIL and HuIL average force profiles; hence, the device performance is not significantly affected by the subject’s and the operator’s mechanical impedances.

Figure 13. HIL (top row), HuIL with fixed target (middle row), and HuIL with human target (bottom row) results for four reference force profiles superimposed on the respective reference profile (in black).
4. Discussion and conclusion
An MPC-based control algorithm and a case study device to manage the force control loop in pHMI were presented in Section 2. The results, shown in Section 3, highlight that, with the adequate tuning of the control parameters, the proposed architecture can provide sufficiently accurate impulsive contact force. The high dynamic behavior shown in HIL results, that is the fast onset of the perturbation signaled by a first steep peak, seems to be related to the approach velocity only (Fig. 5g). Control parameters tuning effects only appear in the force trend shown after the first peak, in which impact physics is no longer predominant and the current saturation block, detailed in Section 2.4, gains control. Applying the MPC action to the current saturation block of the driver allows substantial dynamic performance improvements compared to the previous version of the control design described in Pacheco et al. [Reference Pacheco Quiñones, Paterna and De Benedictis37].
On the other hand, performance does not seem to benefit from a linear variation of the tunable weights during the strike. As expected, it brings an interpolated behavior between generalized weights W 0 and W end during the HIL test. Nonetheless, performance is not always improved (as for varying Q, Fig. 6), and slight enhancements (varying R du, Fig. 7) do not likely justify the added complexity of the control logic. Future improvements concerning weight variations could involve different interpolating profiles with respect to the linear one presented in (Eq. (1)). Furthermore, as ringing is predominant after the first peak, a tuning action on the derivative of the tracking error e y could be implemented.
The difference between the test bench and the handheld setup of the device made it necessary to set a different control parameters configuration during the HuIL test. Despite the refined tuning optimization, HuIL results show a performance loss and increased variability compared with HIL results (Fig. 13, Table A3) due to the added uncertainties introduced in the systems. Nonetheless, the HuIL optimization output exhibits acceptable FI variability (i.e., standard deviation) for the application considered. Moreover, the results are not affected by the operator’s and the target’s characteristics regardless of the force amplitude (Fig. 12, Table A2, Fig. 13, Table A3). These results support the design decision to develop a handheld prototype that should help reduce the system’s bulkiness, complexity, cost, and improve transportability. Finally, the possibility of applying contact forces with different magnitudes without performance loss improves the flexibility of the device and extends its range of applications.
In conclusion, the results demonstrated that, with the appropriate tuning of the control parameters, accurate and robust tracking of the reference contact force could be obtained despite the uncertainties introduced in the system by unpredictable human behavior.
Author contributions
Conceptualization, C.F., D.P.Q., and D.M.; methodology, W.F., C.F., and D.M.; software, D.P.Q. and M.P.; validation, C.D.B., W.F., and M.P.; data gathering, M.P., D.P.Q., and C.D.B.; writing – original draft preparation, D.P.Q., and M.P.; writing – review and editing, C.D.B., D.M., W.F., and C.F.; visualization, W.F.; supervision, C.F. All authors have read and agreed to the published version of the manuscript.
Financial support
This research was partially funded by Politecnico di Torino (Italy), “Proof of Concept” Project 2018.
Competing interests
The authors declare no conflicts of interest exist.
Ethical approval
The authors assert that all procedures contributing to this work comply with the ethical standards of the relevant national and institutional committees on human experimentation and with the Helsinki Declaration of 1975, as revised in 2008.
Appendix A
In this section, the parameters used for tuning of the MPC algorithm in the several conditions tested, as well as the resulting performance indices obtained, are shown for the sake of clarity.
Table A1. HIL parameters tuning.

Letters refer to Fig. 5. FI, FID, and TAE values are reported in mean ± standard deviation format. Colored cells correspond to the parameters optimized in each optimization round, the highlighted one being the best.
Table A2. Device robustness HuIL performance with fixed target for different force amplitudes.

FI, FID, and TAE values are reported in mean ± standard deviation format. FICoV is the averaged coefficient of variation of the FI per reference profile. Data refer to Fig. 12.
Table A3. Device performance for different force amplitudes and testing configurations.

FI, FID, and TAE values are reported in mean ± standard deviation format. HuIL optimization parameters are the same regardless of the target. Data refer to Fig. 13.


