


INTRODUCTION
Bedrock channel incision drives the topographic evolution of landscapes, often preserving geomorphic markers in the form of strath terraces that represent interruptions in continuous river-downcutting processes. Strath terrace formation requires a period of sustained lateral erosion of valley walls at a higher rate than channel bed incision, followed by a period of rapid incision that results in the abandonment of a strath surface (Gilbert, Reference Gilbert1877; Merritts et al., Reference Merritts, Vincent and Wohl1994; Hancock and Anderson, Reference Hancock and Anderson2002; Montgomery, Reference Montgomery2004; Bufe et al., Reference Bufe, Paola and Burbank2016). The formation and preservation of strath terraces often have been associated with climate change that supports variability in the ratio of transport capacity to sediment flux (Bull, Reference Bull1991; Personius et al., Reference Personius, Kelsey and Grabau1993; Wegmann and Pazzaglia, Reference Wegmann and Pazzaglia2009). Strath terraces may also form in response to base level change arising from tectonic uplift or a change in sea level (Lavé and Avouac, Reference Lavé and Avouac2001; Van Der Woerd et al., Reference Van Der Woerd, Xu, Li, Tapponnier, Meyer, Ryerson, Meriaux and Xu2001; Harkins et al., Reference Harkins, Anastasio and Pazzaglia2005), or, in some cases, in the absence of any external forcing by way of autogenic processes (Finnegan and Dietrich, Reference Finnegan and Dietrich2011; Limaye and Lamb, Reference Limaye and Lamb2014, Reference Limaye and Lamb2016; Scheingross et al., Reference Scheingross, Limaye, McCoy and Whittaker2020).
It has been surmised that lithology plays a strong role in governing the rate of bedrock channel incision (Howard, Reference Howard1994; Whipple and Tucker, Reference Whipple and Tucker1999; Cook et al., Reference Cook, Whipple, Heimsath and Hanks2009; Bishop and Goldrick, Reference Bishop and Goldrick2010; Forte et al., Reference Forte, Yanites and Whipple2016), but supporting quantitative evidence for this assumption is largely lacking. In rivers with heterogenous lithologies, variation in lithologic resistance is expected to result in variable bedrock erosion rates. Processes originating upstream (discharge and sediment supply) and downstream (base level) can affect the rate of landscape down-wearing and both upstream and downstream processes are influenced by lithologic heterogeneity across catchments. Gilbert (Reference Gilbert1877) suggested that asymmetry between the erosional resistance of the bedload and the stream bed and banks controls the distribution of lateral and vertical erosion. In more resistant reaches, vertical processes form steep canyons, and in reaches with weak lithology, where bank resistance is lower than the bedload supplied from upstream, lateral processes form wide floodplains (Gilbert, Reference Gilbert1877). Previous studies have suggested that lateral processes are prevalent in lithologies susceptible to rapid subaerial mechanical weathering (e.g., in shales or siltstones) (Montgomery, Reference Montgomery2004; Schanz and Montgomery, Reference Schanz and Montgomery2016; Marcotte et al., Reference Marcotte, Neudorf and Langston2021). In these lithologies, valleys can widen faster than they incise vertically, leading to wide, beveled bedrock surfaces. An influx of sediment that protects the bed followed by rapid incision preserves terraces in the landscape. With few exceptions, however, little work has been done to substantiate field observations of valley width and terrace preservation with geochronologic measurements across a variety of rock types, geological settings, and timescales (Wegmann and Pazzaglia, Reference Wegmann and Pazzaglia2009; Schanz and Montgomery, Reference Schanz and Montgomery2016).
In this study, we apply optically stimulated luminescence (OSL) dating to strath and fill terraces preserved along the Buffalo National River (otherwise referred to as the Buffalo River), building upon a body of work that has shown that valley width is narrower where the river incises more resistant bedrock lithologies relative to less-resistant bedrock lithologies (Keen-Zebert et al., Reference Keen-Zebert, Hudson, Shepherd and Thaler2017). The OSL ages of strath terraces preserved along the Buffalo River are used to quantify rates of vertical channel incision and test the hypothesis that vertical incision rates are statistically different between bedrock lithologies. By refining the Buffalo River terrace chronology, we also seek to address questions concerning the timescales over which terraces form and the relationship between terrace preservation and regional paleoclimate patterns.
STUDY AREA
The Buffalo River drains a ~3480 km2 catchment situated within the Ozark dome—a late Paleozoic uplift that developed in response to the Ouachita orogenic belt impinging from the south. Since its uplift in the Paleozoic, the Ozark dome has remained tectonically quiescent (Croneis, Reference Croneis1930; Hudson et al., Reference Hudson, Turner, Bitting and Kuniansky2011; Keen-Zebert et al., Reference Keen-Zebert, Hudson, Shepherd and Thaler2017; Fig. 1). The catchment is characterized by gently dipping sedimentary rocks interrupted by a succession of monoclinal folds and closely associated faults (Croneis, Reference Croneis1930; Hudson et al., Reference Hudson, Turner, Bitting and Kuniansky2011; Keen-Zebert et al., Reference Keen-Zebert, Hudson, Shepherd and Thaler2017; Hudson and Turner, Reference Hudson and Turner2022). The Buffalo River is a meandering, gravel-mantled, bedrock river that empties into the White River, which likely controls the Buffalo River's base level. The Buffalo River has spatially variable channel and valley width, flowing through wide unconfined reaches where broad floodplains form and through confined narrower reaches where the channel flow is laterally restricted, and floodplains form only on the inside of ingrown meander bends that are cut into bluffs that are as tall as 168 m.

Figure 1. The Buffalo National River watershed with 5-m DEM hillshade and mapped geological units. The inset shows the location of the Buffalo River watershed in northwest Arkansas. The river flows from west to east. OSL sample locations are listed as letters: (A) Boxley; (B) Steel Creek; (C) Ozark; (D) Blue Hole; (E) Margaret White; (F) Tyler Bend; (G) South Maumee. Geological units for the Buffalo River watershed include the Quaternary deposits including the terraces studied here (Q); Pennsylvanian Atoka Formation (![]() a); Pennsylvanian Bloyd Formation and Prairie Grove Member of the Hale Formation (
a); Pennsylvanian Bloyd Formation and Prairie Grove Member of the Hale Formation (![]() bh); Pennsylvanian Cane Hill Member of Hale Formation (
bh); Pennsylvanian Cane Hill Member of Hale Formation (![]() hc), Mississippian Pitkin Limestone, Fayetteville Shale, Batesville Sandstone (Mpfb), Mississippian Boone Formation (Mb), Silurian Lafferty, St. Clair, and Brassfield limestones (Slsb); Ordovician Carson Shale, Fernvale Limestone, Plattin Limestone, and Kimmswick Limestone, and Joachim Dolomite (Ocj); Ordovician St. Peter Sandstone and Everton Formation (Ose); and Ordovician Powell Dolomite (Op). Refer to Keen-Zebert et al. (Reference Keen-Zebert, Hudson, Shepherd and Thaler2017) and references therein for complete lithologic descriptions. Figure adapted from Zunka (Reference Zunka2018).
hc), Mississippian Pitkin Limestone, Fayetteville Shale, Batesville Sandstone (Mpfb), Mississippian Boone Formation (Mb), Silurian Lafferty, St. Clair, and Brassfield limestones (Slsb); Ordovician Carson Shale, Fernvale Limestone, Plattin Limestone, and Kimmswick Limestone, and Joachim Dolomite (Ocj); Ordovician St. Peter Sandstone and Everton Formation (Ose); and Ordovician Powell Dolomite (Op). Refer to Keen-Zebert et al. (Reference Keen-Zebert, Hudson, Shepherd and Thaler2017) and references therein for complete lithologic descriptions. Figure adapted from Zunka (Reference Zunka2018).
The Buffalo River cuts through Ordovician, Mississippian, and Pennsylvanian carbonate and clastic sedimentary rocks that are subject to both physical and chemical (karstic) weathering (Keen-Zebert et al., Reference Keen-Zebert, Hudson, Shepherd and Thaler2017; Fig. 2A). There are four main lithologic reaches in the Buffalo River made up of two dominant lithologies: the Boone and Everton Formations. The upstream reach of the main stem of the Buffalo River is incised into the Boone Formation limestone and characterized by wide valleys. Farther downstream at approximately river km 30, the channel incises the Everton Formation sandstone and the valley narrows. At river km 114, faulting has returned the Boone Formation to the surface and the pattern is repeated; the valley widens just downstream of the contact with the Boone Formation and then narrows where down-cutting has exposed the Everton Formation to the surface (Keen-Zebert et al., Reference Keen-Zebert, Hudson, Shepherd and Thaler2017; Fig. 2B).

Figure 2. (A) Changes in valley lithology and Qtm strath terrace tread elevations over downstream distance. Lithological reaches are subdivided based on the lithology exposed at modern river level. Qtm terraces dated in this study are highlighted in white boxes; circles correspond to their tread elevations; dashes (within the white boxes) refer to their buried straths. (B) Buffalo River longitudinal profile and valley width over downstream distance; MSL = mean sea level. (C) Simplified stratigraphic columns from each sampled Qty and Qtm terrace showing OSL ages and major changes in sedimentology with depth. (A) and (B) are adapted from Keen-Zebert et al. (Reference Keen-Zebert, Hudson, Shepherd and Thaler2017).
The Boone Formation consists of limestone with interbedded chert. Where the channel occupies the Boone Formation, fluviokarst processes and factors, including the elevation of the water table, chemical weathering, dissolution of the channel bed, and ground water-surface water interaction, play a large role in channel incision (Anthony and Granger, Reference Anthony and Granger2007). Evidence of phased incision is preserved in fluvial terraces and in a series of horizontal cave passages that are now perched above the water table. Where the channel occupies the Boone Formation, it meanders across a wide continuous floodplain and is characterized by a bedrock-floored channel with a boulder, cobble, coarse gravel, and sand bedload that is deposited in point and lateral bars.
The Everton Formation, which underlies the Boone Formation, is composed of interbedded dolostone, limestone, and sandstone. The middle part of the Everton is dominated in the upper reaches (upstream of river km ~75) by a thick sandstone sequence known as the Newton Sandstone Member, which thins significantly toward the lower reaches (Fig. 2A; Keen-Zebert et al., Reference Keen-Zebert, Hudson, Shepherd and Thaler2017). There is less ground water-surface water interaction in the Everton Formation than in the Boone Formation, and thus the effect of fluviokarst processes is reduced. The Boone and Everton Formations have statistically equivalent mechanical resistance, but the Everton Formation has significantly higher chemical resistance owing to both its higher content of insoluble material and the lower dissolution rate of dolomite versus limestone (Keen-Zebert et al., Reference Keen-Zebert, Hudson, Shepherd and Thaler2017). Where the channel occupies the Everton Formation, it is characteristic of ingrown meandering bedrock channels with a bedrock channel bed, high bedrock bluffs on the outsides of meanders, with high amplitude, narrow valleys, and floodplains formed on the insides of meanders. The contrasting valley characteristics have been taken to suggest that vertical channel processes are more prevalent in the Everton Formation reaches relative to the Boone Formation reaches (Keen-Zebert et al., Reference Keen-Zebert, Hudson, Shepherd and Thaler2017).
Geomorphic evidence of phased incision is preserved in both the Boone and Everton Formation reaches of the river. Geologic mapping (1:24,000) of the Buffalo River conducted by the United States Geological Survey and the Arkansas Geological Survey (see references in Keen-Zebert et al., Reference Keen-Zebert, Hudson, Shepherd and Thaler2017) documents flights of successive, stepped, terraces adjacent to the river, which are designated as Qty (young), Qtm (medial), and Qto (old) based on their elevation above the modern channel. Qty denotes Holocene fill terraces with treads <12 m above the modern channel. Qty terraces preserve basal coarse gravel and boulders and are overlain by ~3–9 m of finer-grained sediments typically dominated by sand. Qtm indicates strath terraces capped by alluvial sediments ~5–10 m thick that include coarse channel-lag deposits at their base and are covered by a drape of overbank deposits dominated by sand. The Qtm terrace treads occur at ~12–16 m above the modern channel with elevations that are higher in the Everton Formation reaches relative to the Boone Formation reaches (ANOVA p-value <0.00001; Fig. 2A). The terraces indicated by Qto are very poorly preserved strath terraces ~16–90 m above the modern channel that are overlain by a thin veneer of sandy soil interspersed with gravel and cobbles. OSL dating of the Qto terrace deposits is hampered by the poor preservation and highly disturbed nature of the deposits. The fluvial sediments capping the Qtm and Qty terraces archive the aggradation and incision history of the Buffalo River over the late Quaternary and are the focus of this paper.
The modern climate of the Buffalo River watershed is temperate continental and characterized by long summers and short, relatively mild winters (Mott and Luraas, Reference Mott and Luraas2004). The average annual precipitation is ~117 cm with drier months in the summer and wetter months in the spring and fall. Occasional flooding occurs throughout the year with major events occurring more commonly after the dry season (Mott and Luraas, Reference Mott and Luraas2004).
METHODS
Field observations and sample collection
The elevations of previously mapped Qtm terraces were measured from a 1-m digital elevation model (DEM) acquired from the Buffalo River National Park Service. Mean tread elevations for all mapped Qtm terraces are shown in Figure 2A. Cross-sectional profiles for each of the three Qtm terraces selected in this study also were extracted from the 1-m DEM (Fig. 3). At Blue Hole, the subsurface stratigraphy was mapped at high resolution using boreholes drilled at horizontal intervals of ~20 m. At Margaret White and South Maumee, the subsurface stratigraphy was projected from exposures observed in the trenches and augur holes where OSL samples were collected, and from outcrops observable from the modern floodplain. The Qty fill terraces were similarly described in the field from trenches, augur holes, and bank exposures.

Figure 3. (A–C) Cross-sectional profiles of the three Qtm terrace study sites with mapped lithological contacts. Trenches where OSL samples were collected are labeled with a ‘T#’ corresponding to the data in Table 1. Dashed lines represent uncertainty in the position of lithological contacts. ‘SU’ refers to the strath unconformity used for vertical incision rate calculations. Inset figures show profile orientation on LiDAR images and sample numbers for each site. The mapped terrace boundaries refer to those provided in the geologic maps of Chandler and Ausbrooks (Reference Chandler and Ausbrooks2015a, Reference Chandler and Ausbrooksb) and Turner and Hudson (Reference Turner and Hudson2010).
To evaluate differences in terrace ages, timescales of terrace occupation, and incision rates across the Buffalo River, three Qtm and five Qty terraces were selected for OSL dating. OSL samples were collected by hammering stainless steel tubes horizontally into freshly cleaned trench faces or in some cases by vertical hand-augering (Fig. 4). The sampling strategy was designed to place chronological controls on the onset of aggradation and terrace abandonment by collecting samples from close to the strath unconformity and top of each terrace deposit. At some study sites, a higher density of samples was collected to evaluate possible changes in the rate of terrace aggradation. To assess the extent of partial bleaching in our ancient terrace samples, two modern samples also were collected from the modern floodplain: one sample from recent flood deposits on top of the floodplain (BR005) and the other sample from the floodplain bank, ~1.5 m below the surface of the top of the floodplain (BR002). In all cases, care was taken to ensure that samples were collected where alluvial sediment appeared to be in situ and not reworked by anthropogenic and/or hillslope processes.
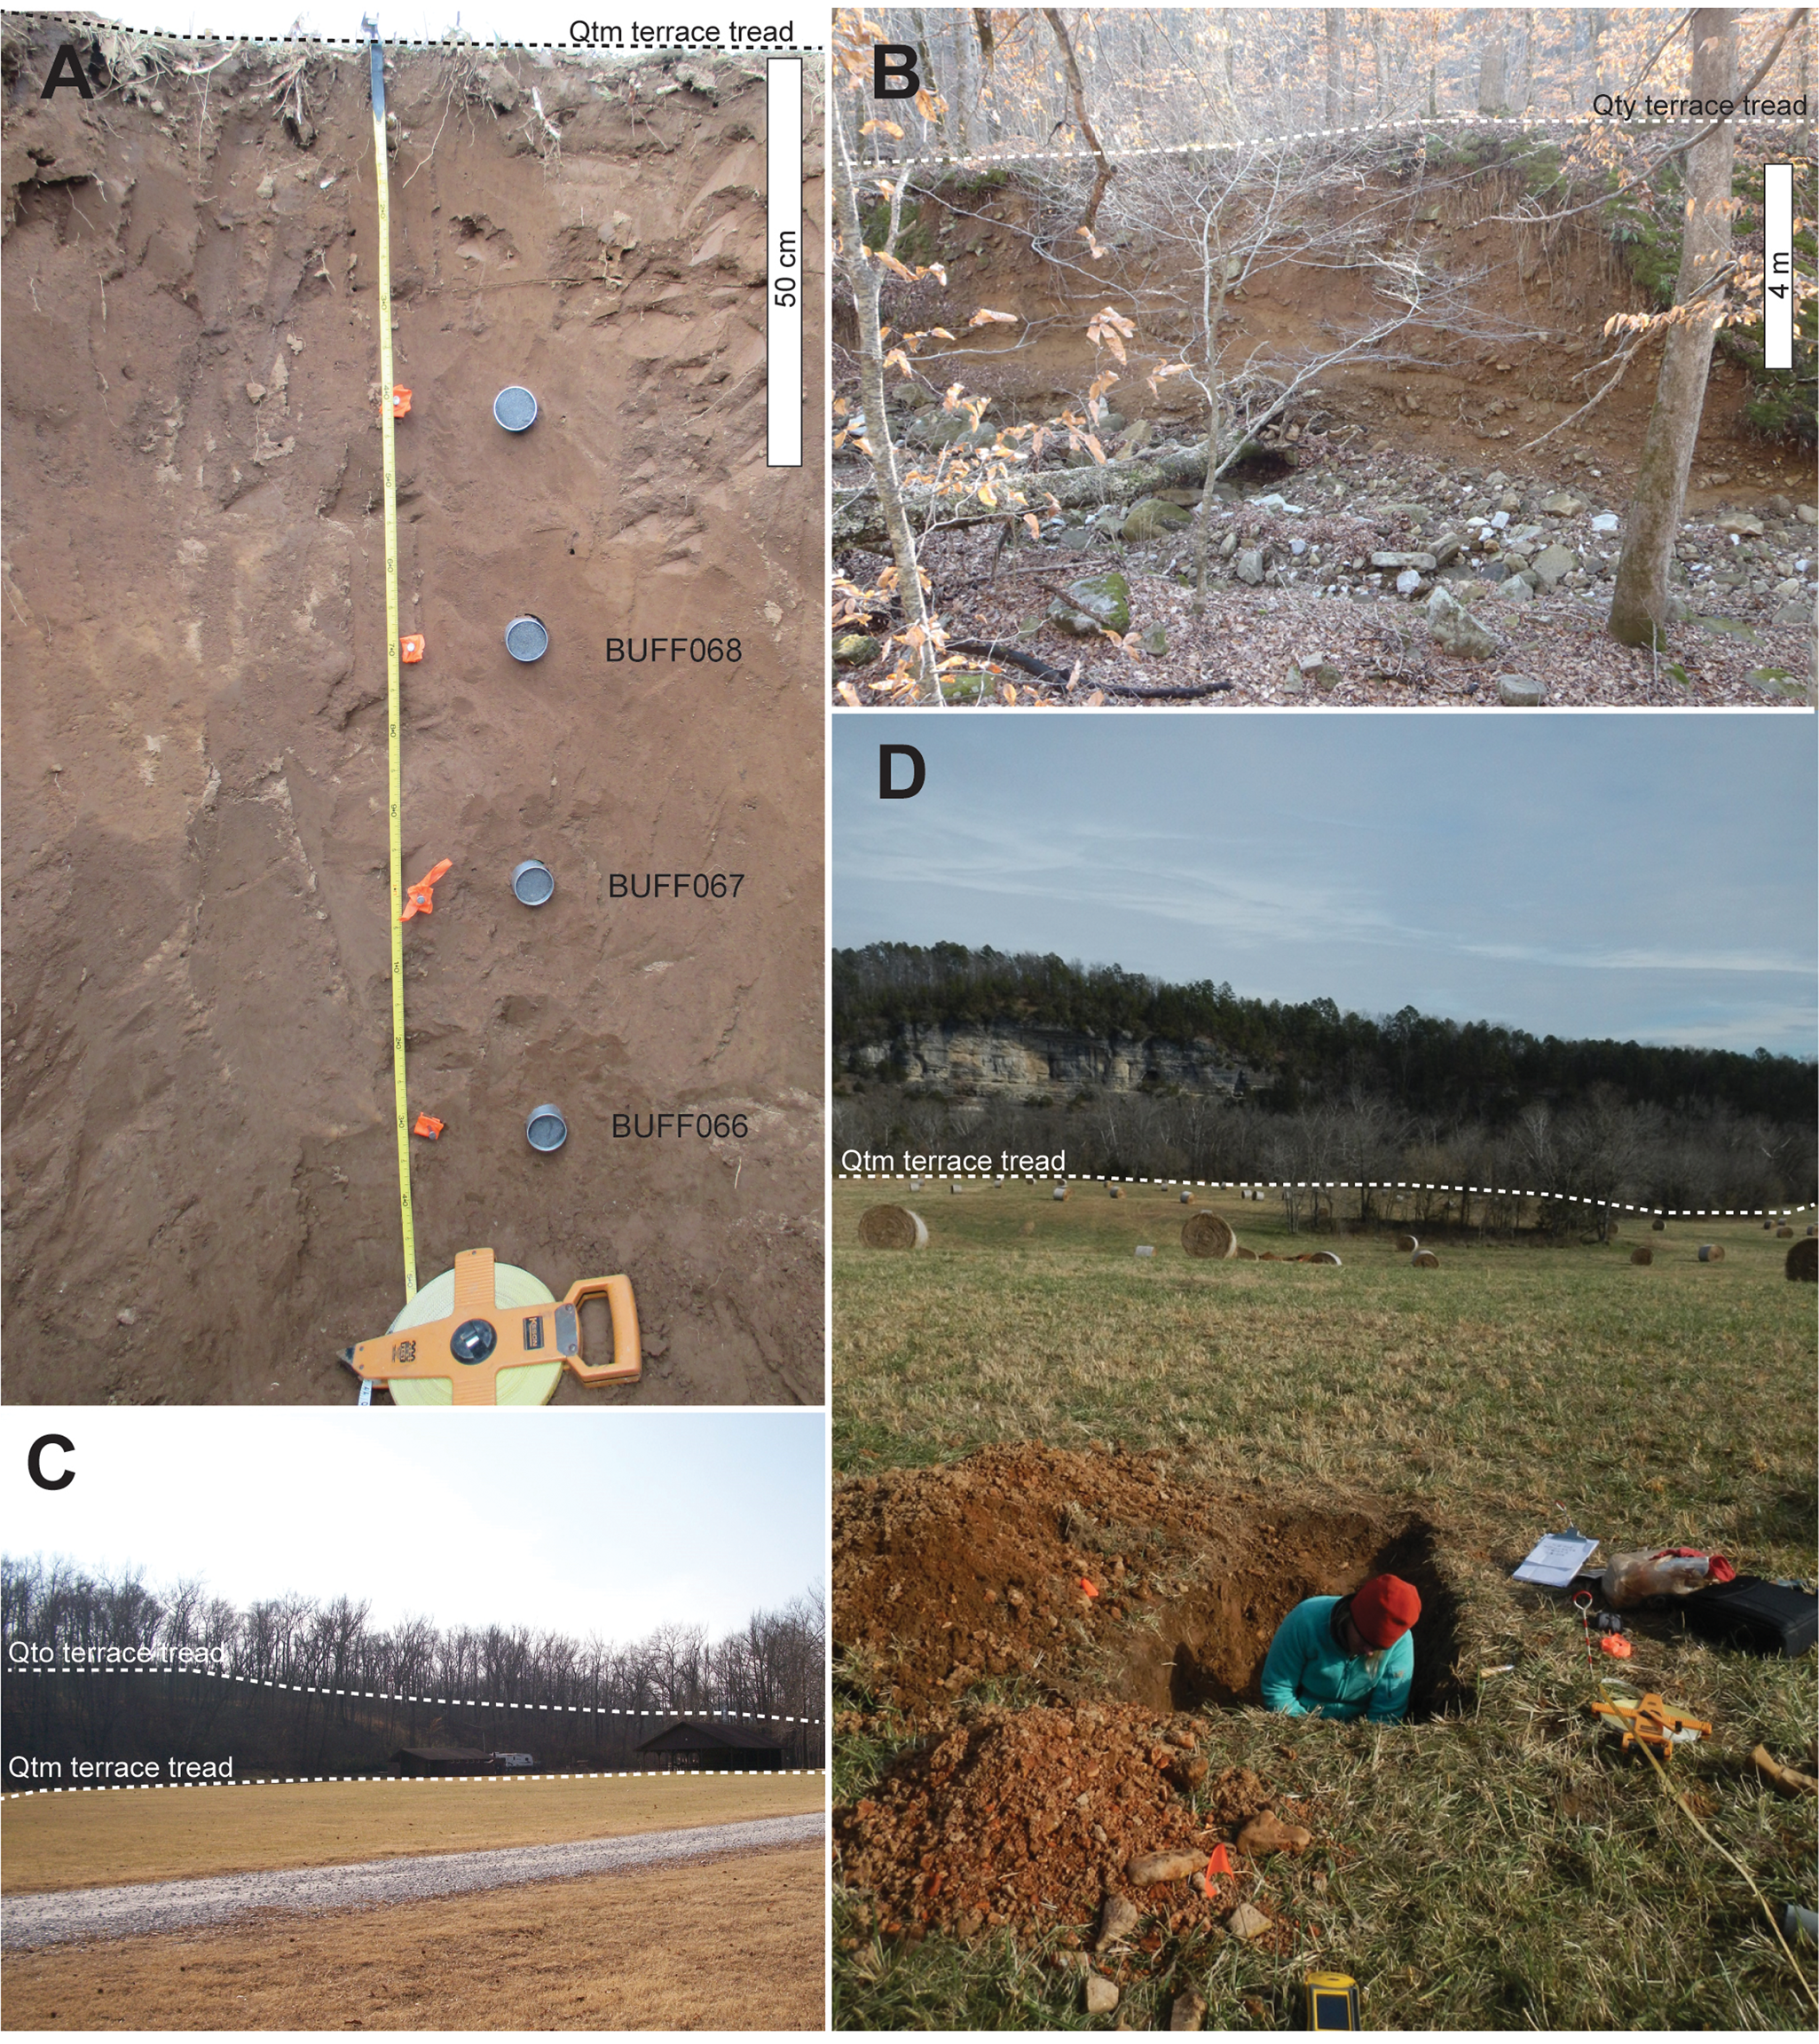
Figure 4. Field photos showing typical features of Qtm and Qty terraces preserved along the Buffalo River. (A) Margaret White Qty T2 terrace with OSL samples hammered into the trench wall; note the stratigraphic homogeneity, which is typical for the Buffalo River terrace deposits. (B) Boxley Qty terrace shown in profile from the perspective of the modern channel. (C) Qtm and Qto terraces preserved at Ozark. (D) Blue Hole Qtm T1 location with tall bluffs exposed in the background opposite the Buffalo River.
OSL dating
Sample preparation
Preparation and analysis of OSL samples was carried out at the Desert Research Institute Luminescence Laboratory (DRILL) in Reno, Nevada, under dim orange light. Sample tubes were opened and the sediment at either end of the tube was removed to prevent contamination of the working sample with light-exposed grains. Standard coarse-grain quartz preparation was carried out using methods described in Aitken (Reference Aitken1998). This included a 10% HCl and 30% H2O2 treatment to remove carbonates and organic material, respectively. Wet sieve methods were used to obtain the 180–250 μm grain size fraction and a heavy liquid separation using lithium heteropolytungstate (LST) was performed to isolate the quartz fraction. The remaining quartz grains were treated with 40% HF for 40 minutes to etch the alpha-irradiated surface of the quartz and remove any remaining feldspar from the samples.
Representative subsamples (~30 g) of dose rate sediment were analyzed for radioelemental concentrations of U, Th, and K using inductively coupled plasma-mass spectrometry (ICP-MS) and inductively coupled plasma-atomic emission spectrometry (ICP-AES) analyses at the ALS Geochemistry Facility in Reno, Nevada. Moisture content was measured for all samples. Dose rate calculations incorporated dose rate conversion factors from Guérin et al. (Reference Guérin, Mercier and Adamiec2011) and Liritzis et al. (Reference Liritzis, Stamoulis, Papachristodoulou and Ioannides2013), estimated moisture content over the burial period, and cosmic dose contribution following Prescott and Hutton (Reference Prescott and Hutton1994). All annual dose rates include an internal alpha and beta contribution of 10.5 μGy/a (Rink and Odom, Reference Rink and Odom1991).
Equivalent dose determination and age calculation
Single grain measurements were made using aluminum discs that contain 100 holes (each hole 300 μm in diameter and 300 μm in depth) arranged in a 10 × 10 grid. To ensure that only one grain occupied an individual hole, each disc was visually checked under a light microscope prior to measurement. Luminescence measurements were performed using an automated Risø TL-DA-20 luminescence reader using a focused green (532 nm) laser for stimulation (~45 mW/cm2) and detection through a 7-mm-thick Hoya U-340 UV transmitting filter. Laboratory irradiations were performed using a calibrated 90Sr/90Y beta radioactive source attached to the Risø luminescence reader and delivering ~0.13 Gy/s. OSL signals were measured after a one second period of stimulation, with the OSL signal being integrated from the first 0.06 s of the decay curve, and the subtracted background from the last 0.2 s. Equivalent dose measurements followed the SAR protocol with an embedded IR depletion test (Murray and Wintle, Reference Murray and Wintle2000, Reference Murray and Wintle2003; Duller, Reference Duller2003). Dose recovery tests (Murray and Wintle, Reference Murray and Wintle2003) applying different preheat temperatures (ranging from 160–280°C) were performed on 21 aliquots of sample BUFF036 in order to test the reliability of the SAR protocol and determine the optimal preheat temperature for single grain OSL measurement.
Owing to early signal saturation, the conventional OSL dating limit was reached at ages of ca. 125 ka. Feldspars, which typically saturate at higher De values, were effectively absent in the samples studied, and therefore a thermally transferred OSL (TT-OSL) SAR protocol following the methodology of Porat et al. (Reference Porat, Duller, Roberts and Wintle2009) was applied to the remaining older terrace deposits. Because TT-OSL signals saturate at much higher doses relative to conventional OSL, the dating range typically can be extended by a factor of 2–3 (e.g., Wang et al., Reference Wang, Lu and Wintle2006). Our TT-OSL measurements were carried out on 7 mm multigrain quartz aliquots (~650 grains) using the same Risø TL-DA-20 luminescence reader with blue LED stimulation (~45 mW/cm2). The 90Sr/90Y beta radioactive source delivered a calibrated dose rate of ~0.11 Gy/s to the stainless-steel discs used for TT-OSL analysis. The effectiveness of this TT-OSL protocol was tested using a dose recovery test on 20 aliquots of sample BUFF044. A residual dose of 28 ± 8 Gy (determined from the TT-OSL Central Age Model [CAM] [Galbraith et al., Reference Galbraith, Roberts, Laslett, Yoshida and Olley1999] De from modern sample BR002), was subtracted from all TT-OSL De values prior to age calculation (refer to Supplementary Tables 1 and 2 for details about the measurement protocols used in this study).
Table 1. OSL ages and inferred vertical bedrock incision rates for three Qtm terraces on different lithologically defined reaches of the Buffalo River. Vertical bedrock incision rates were calculated based on the OSL-derived ages from nearest the strath unconformity and the elevation of the underlying bedrock surface above the modern channel. Data in bold were used to calculate bedrock incision rates at each site. For a compilation of all data used for dose rate and age calculation see Supplementary Table 4.

1 Equivalent doses were calculated using the Average Dose Model (Guérin et al., Reference Guérin, Christophe, Philippe, Murray, Thomsen, Tribolo, Urbanová, Jain, Guibert and Mercier2017) and incorporate a σm of 0.12.
2 External dose rates are based on U, Th, and K2O measured by ICP-MS and ICP-AES. Dose rates were calculated using the conversion factors of Liritzis et al. (Reference Liritzis, Stamoulis, Papachristodoulou and Ioannides2013) and are shown rounded to one decimal place; ages were calculated using values prior to rounding. Dose rates were calculated assuming a water content of 10 ± 6%. External dose rates also include a cosmic dose component calculated according to Prescott and Hutton (Reference Prescott and Hutton1994). Total dose rates include an internal dose rate of 0.011 ± 0.001 Gy/ka, which was calculated based on assumed internal U and Th concentrations provided by Rink and Odom (Reference Rink and Odom1991).
* Equivalent doses were determined using a TT-OSL protocol on multigrain aliquots and incorporate a 28 ± 8 Gy residual subtraction.
Table 2. OSL ages for Qty terraces. For a compilation of all data used for dose rate and age calculation see Supplementary Table 5.

1 Equivalent doses were calculated using the Average Dose Model (Guérin et al., Reference Guérin, Christophe, Philippe, Murray, Thomsen, Tribolo, Urbanová, Jain, Guibert and Mercier2017) and incorporate a σ m of 0.12.
2 External dose rates are based on U, Th, and K2O measured by ICP-MS and ICP-AES. Dose rates were calculated using the conversion factors of Liritzis et al. (Reference Liritzis, Stamoulis, Papachristodoulou and Ioannides2013) and are shown rounded to one decimal place; ages were calculated using values prior to rounding. Dose rates were calculated assuming a water content of 10 ± 6%. External dose rates also include a cosmic dose component calculated according to Prescott and Hutton (Reference Prescott and Hutton1994). Total dose rates include an internal dose rate of 0.011 ± 0.001 Gy/ka, which was calculated based on assumed internal U and Th concentrations provided by Rink and Odom (Reference Rink and Odom1991).
All measurements were required to pass the following criteria for further analysis: <20% test dose error, <20% recycling ratio error, <5% recuperation, <20% equivalent dose error, and a signal >3σ above background. De values also were rejected if they were >2D0, following the recommendations of Wintle and Murray (Reference Wintle and Murray2006). All individual De values incorporate an instrumental error of 1.5%.
RESULTS
Terrace characteristics
Terrace elevations and general sediment characteristics are provided in Figure 2C. The three Qtm terraces selected for this study preserved morphologically similar alluvial deposits, with bedrock straths capped by a layer of coarse-grained sand, gravel, and cobbles ranging from ~2–4 m in thickness and immediately overlain by 2–4 m of loamy overbank deposits lacking any prominent stratigraphic features (Fig. 4A). The Qtm terrace treads were generally planar with the exception of Blue Hole, which featured dipping alluvium cover overlying a series of minor ‘complex-response’ strath terraces (sensu Bull, Reference Bull1990). The provenance for the cobbles and gravels overlying the straths at all sites had mixed non-local lithologies compared to the local bedrock lithology, confirming that the clasts were transported by fluvial rather than by hillslope processes. The Qty terraces similarly preserved ~1–4 m of basal cobbles and gravels and were overlain by 2–4 m thick loam deposits dominated by sand (Fig. 4B). Evidence for natural or anthropogenic sediment mixing or hillslope processes was isolated to the upper 40–70 cm of the deposits.
Single grain OSL characteristics
Preliminary OSL testing showed that samples consistently reproduced a given dose using the SAR protocol, yielding an average dose recovery ratio of 0.97 ± 0.08 (n = 21). Thermal transfer tests showed no significant evidence for thermal transfer over the range of preheat temperatures tested (<0.1 Gy). Quartz OSL signals were typically bright and dominated by the fast component (Fig. 5A). Growth curves were best described by the sum of two saturating exponential functions with D0 values for the early saturating component ranging from ~9–20 Gy and the slowly saturating component ranging from ~74–450 Gy (Figure 5A). Sensitivity changes monitored by administering a small test dose (~6.5 Gy) after each regenerative dose showed little (<20%) change over the course of the SAR cycle. Mean recuperation and recycling ratios of 1.4 ± 2.2% and 1.04 ± 0.03, respectively, further support the appropriateness of the SAR protocol applied to these samples.

Figure 5. Luminescence characteristics of Buffalo River quartz. (A) Representative dose response curve with inset decay curve for a single grain of BUFF035 quartz; (B) equivalent dose distribution for modern sample BR002 (see Supplementary Fig. 4 for De distribution from the additional modern sample, BR005); (C) single grain De distribution for sample BUFF035; (D) TT-OSL dose response curve with inset decay curve for a multigrain quartz aliquot of BUFF044; (E) TT-OSL De distribution for modern sample BR002; (F) TT-OSL De distribution for sample BUFF044.
Both modern floodplain samples (BR002 and BR005) carried no significant residual OSL signal (~0.2 Gy; Fig. 5B; Supplementary Table 1) suggesting that bleaching of the quartz OSL signal is sufficient for the fluvial sediments studied along the Buffalo River. In contrast, single grain De distributions for the majority of ancient samples were positively skewed and displayed overdispersion of >20% (Fig. 5C; Supplementary Table 3). Given that modern fluvial samples are expected to reflect worst-case bleaching scenarios owing to poor preservation potential (Jain et al., Reference Jain, Murray and Botter-Jensen2004), we suggest that the high overdispersion present in our ancient samples can be explained by some other unidentified external source of scatter (e.g., post-depositional mixing, beta microdosimetry, etc.). Most workers recommend against using the minimum age model (which is commonly applied to fluvial deposits; Galbraith et al., Reference Galbraith, Roberts, Laslett, Yoshida and Olley1999) in scenarios where either post-depositional mixing or beta microdosimetry are the dominant influencers on overdispersed De distributions (Galbraith et al., Reference Galbraith, Roberts, Laslett, Yoshida and Olley1999; Olley et al., Reference Olley, Pietsch and Roberts2004; Bateman et al., Reference Bateman, Boulter, Carr, Frederick, Peter and Wilder2007). We apply the Average Dose Model (ADM, Guérin et al., Reference Guérin, Christophe, Philippe, Murray, Thomsen, Tribolo, Urbanová, Jain, Guibert and Mercier2017), which is likely better suited to isolate the De mode in these scenarios (Guérin et al., Reference Guérin, Christophe, Philippe, Murray, Thomsen, Tribolo, Urbanová, Jain, Guibert and Mercier2017).
Multi-grain TT-OSL characteristics
TT-OSL dose response curves exhibited single saturating exponential behavior with D0 values ranging from 420–800 Gy (Fig. 5D). Dose recovery experiments on sample BUFF044 yielded a mean ratio of 0.95 ± 0.10 (n = 10), suggesting that the protocol was suitable for De determination. Relative to single grain measurements, TT-OSL De values from modern sample BR002 exhibited high overdispersion with De values ranging from ~0–106 Gy. The CAM TT-OSL De of 28 ± 8 Gy from modern sample BR002 was subtracted from each individual TT-OSL De prior to age calculation to account for the average residual signal that we observe. The residual-corrected TT-OSL ages from samples collected near the strath unconformity should be interpreted as minimum ages for strath planation.
OSL ages
Our OSL ages from sand collected near the Qtm strath surface at each of the three study sites suggest a minimum age of ca. 250 ka for the onset of strath planation and aggradation (Table 1). These basal ages were statistically indistinguishable within the reported uncertainties across the three study sites. All other samples collected from the Qtm terrace fill yielded depositional ages consistent with stratigraphic position, and in all cases span an order of magnitude. Vertical incision rates calculated using ages from nearest the Qtm strath surface and strath elevation above the modern channel range from ~16 mm/ka at our Boone Formation site, Margaret White, to ~35 mm/ka at our two Everton Formation sites.
OSL ages from the Qty terraces display a younging trend upstream, with the onset of Qty aggradation beginning ca. 14.5 ka at our farthest downstream Qty terrace site, Tyler Bend, and ca. 5.5 ka at our farthest upstream site, Boxley (Table 2). The depositional ages from each terrace are in stratigraphic order, with a range that in some cases spans nearly 10 ka for a given deposit (Table 2).
DISCUSSION
OSL and TT-OSL signal characteristics
TT-OSL signals are known to be significantly less sensitive to light exposure relative to conventional OSL signals, and commonly yield age overestimates for fluvial sediments (Duller and Wintle, Reference Duller and Wintle2012). TT-OSL signals from well-bleached aeolian deposits typically carry residual doses that range from 5–20 Gy and from 40–380 Gy for fluvial sediments (Hu et al., Reference Hu, Zhang, Qiu and Zhou2010; Demuro et al., Reference Demuro, Arnold, Parés and Sala2015). Based on the presence of significant residual signals, many practitioners have suggested that TT-OSL protocols should be applied only to well-bleached aeolian or shallow marine deposits (Duller and Wintle, Reference Duller and Wintle2012). Our OSL results from modern analogue samples suggest that contrary to many fluvial deposits, both the OSL and TT-OSL signals from Buffalo River quartz were relatively well bleached at deposition. TT-OSL results from our modern analogue sample carries an average weighted TT-OSL residual De of 28 ± 8 Gy (constituting 6–11% of the measured De), which is comparable to published residual doses from aeolian deposits. By subtracting this residual dose from our De estimates, we assume that bleaching conditions of the present are representative of those that existed in the past. However, the amount of sediment present in the water column (and thus the opacity and sediment-bleaching rate) was likely different during strath planation when the river was a net-aggradational system relative to its present-day net-incisional state. In spite of this uncertainty, with subtraction of a residual dose, our TT-OSL age estimates for strath planation are indistinguishable among the three Qtm terraces studied, suggesting that residual subtraction based on a modern analogue may be appropriate in this particular fluvial setting. Further work using natural and laboratory flume experiments would be helpful to understand how varying fluvial regimes (e.g., streamflow and sediment supply) influences luminescence bleachability.
A growing body of literature has documented apparent age underestimation of the TT-OSL signal relative to other independent chronometers, ostensibly owing to the thermal stability of the TT-OSL source trap (Shen et al., Reference Shen, Mauz and Lang2011; Thiel et al., Reference Thiel, Buylaert, Murray, Elmejdoub and Jedoui2012; Chapot et al., Reference Chapot, Roberts, Duller and Lai2016; Faershtein et al., Reference Faershtein, Guralnik, Lambert, Matmon and Porat2018). However, stability of the TT-OSL signal is still debated, with some workers reporting TT-OSL age underestimation beginning near ca. 200 ka (e.g., Thiel et al., Reference Thiel, Buylaert, Murray, Elmejdoub and Jedoui2012) and others finding no age underestimation relative to independent age control even beyond 800 ka (Arnold and Demuro, Reference Arnold and Demuro2015). Based on the model of Faershtein et al. (Reference Faershtein, Guralnik, Lambert, Matmon and Porat2018), the TT-OSL ages reported here for the Buffalo River may be underestimated by 5–10%. Nevertheless, this potential underestimation still falls within our reported age uncertainties and should therefore not have a significant effect on our interpretations. Future work performing pulse annealing experiments would help to determine the thermal lifetime of the TT-OSL traps from quartz along the Buffalo River.
Timescales of terrace occupation
Our results show that terrace ages can be highly variable depending on where in the alluvial fill an OSL sample is collected (Fig. 2). At the three Qtm study sites, samples collected from a single trench yield ages that span ca. 200 ka (Table 1). Similar observations of age variability in terraces have been made using a combination of OSL and cosmogenic nuclide surface exposure dating along Colorado's western High Plains (Foster et al., Reference Foster, Anderson, Gray and Mahan2017). Accumulation through overbank and overland flooding apparently can occur over hundreds of thousands of years, which is consistent with the work of Neely (Reference Neely1985) who demonstrated that 100-year floods along the Buffalo River can extend up to 12 m above the normal river level. However, the Qtm terraces studied here apparently do not preserve any sedimentological evidence for discrete episodes of floodplain deposition that would support the variability in ages that we observe. Any interpretations of bedrock incision rates that rely on age data collected from alluvium overlying a strath should be considered with extreme caution. As Pederson et al. (Reference Pederson, Anders, Rittenhour, Sharp, Gosse and Karlstrom2006) similarly argued, only ages collected near the strath unconformity can truly approximate the timing of strath planation, particularly where terrace fill is thick. In addition, where meandering channels preferentially migrate laterally and terrace elevations are lower, as in the lower resistance Boone Formation (Keen-Zebert et al., Reference Keen-Zebert, Hudson, Shepherd and Thaler2017), there may be a higher probability for channel reoccupation, reworking, or episodes of renewed aggradation of a strath terrace. We found no evidence for cut-in-fill sequences in our profiles, but that does not preclude the possibility that they exist elsewhere. To avoid erroneous age interpretation, we recommend that sampling strategy be determined only after careful mapping and evaluation of the subsurface has taken place.
Lithologic control on vertical bedrock incision rates
The results presented in this study show that significant differences in vertical bedrock incision rates exist between Buffalo River lithologies that feature variable chemical weathering characteristics. The differences in vertical incision rate closely mirror the differences in terrace tread elevation between lithological reaches; where the river incises the less-resistant Boone Formation reaches, Qtm terrace treads are lower in elevation and OSL-derived incision rates are lower than those obtained from the more-resistant Everton Formation reaches (Fig. 2). The OSL-derived bedrock incision rates presented in this study support the work of Keen-Zebert et al. (Reference Keen-Zebert, Hudson, Shepherd and Thaler2017) who established a relationship between lithology and valley width and terrace distribution along the Buffalo River. Where the river incises the more-resistant Everton Formation, valleys are narrower and preserve a greater number of Qto terraces in the landscape compared to reaches where the channel incises the less-resistant Boone Formation. These characteristics were attributed to variations in the style and rates of vertical versus lateral processes in the different lithologic reaches of the Buffalo River (Keen-Zebert et al., Reference Keen-Zebert, Hudson, Shepherd and Thaler2017). Our OSL results support these observations and suggest that vertical bedrock incision is statistically higher in the more-resistant Everton Formation reaches relative to the Boone Formation reaches (~35 mm/ka vs. ~16 mm/ka, respectively).
The timescales of vertical versus lateral processes at each of the three study sites are further supported by Zunka (Reference Zunka2018) who report lateral migration rates using in-situ produced 10Be concentrations from bluff-derived chert for various locations along the Buffalo River (see Fig. 1 for sample locations). A relationship between lateral migration rate and changes in bluff lithology was observed; meanders in the Boone Formation reach yielded faster average lateral migration rates relative to those where sandstone units were present (5 mm/ka relative to 109 mm/ka). Even though these rates integrate over shorter timescales relative to the OSL-derived vertical incision rates that we report, together they still support the observations of Keen-Zebert et al. (Reference Keen-Zebert, Hudson, Shepherd and Thaler2017) and suggest that over both shorter and longer timescales the rates of vertical and lateral processes vary as a function of lithologic resistance.
Timescales of channel incision and landscape lowering
Along the Buffalo River, we calculate OSL-derived vertical incision rates for Qtm strath terraces ranging from ~16 mm/ka in the Boone Formation hosted straths to ~35 mm/ka where the channel has incised the Everton Formation. These rates are both faster and slower than previously reported estimates of landscape lowering along the Buffalo River based on different geochronometers. Hudson et al. (Reference Hudson, Paces, Turner, Kuniansky and Spangler2017) used U/Th ages from tufa preserved at Big Bluff ~120 m above the Buffalo River to estimate a maximum incision rate of 740 mm/ka, which is a significantly higher rate than our estimates (Fig. 1).
Previous studies of modern in-channel calcite dissolution rates have been reported as 1.06 mm/yr at Boxley (Boone Formation; Covington et al., Reference Covington, Gulley and Gabrovšek2015), and since revised with the new methodology of Covington and Vaughn (Reference Covington and Vaughn2019) to reflect rates that are likely 30–50% of that value (0.3–0.5 mm/yr or 300–500 mm/ka) (Fig. 1). Even with updated estimates, the calcite dissolution rates are significantly higher than our vertical incision rates of ~16 mm/ka at Margaret White where the channel has incised the Boone Formation limestone. Plausible explanations for the discrepancy include: (a) the modeled dissolution rates assume pure carbonate and may not accurately reflect dissolution of Boone Formation limestone, which is up to 70% chert in some locations (Keen-Zebert et al., Reference Keen-Zebert, Hudson, Shepherd and Thaler2017); or (b) the primary controllers of dissolution rate (PCO2, temperature, and discharge; Covington et al., Reference Covington, Gulley and Gabrovšek2015) have not been constant through time. Moreover, in contrast to modern estimates of in-channel dissolution, OSL-derived incision rates integrate lateral and vertical processes over timescales ranging from thousands to hundreds of thousands of years.
Zunka (Reference Zunka2018) reported catchment-averaged denudation rates derived from in-situ produced terrestrial cosmogenic nuclide (10Be) concentrations that range from 16–18 mm/ka (averaged over ca. 35 ka), which are rates that are slightly higher than the estimates of Beeson et al. (Reference Beeson, McCoy and Keen-Zebert2017) who report an average of 8 mm/ka for the broader Ozark Plateaus region. Our calculated vertical bedrock incision rates that average over the last ca. 250 ka are of the same order of magnitude as Zunka's catchment-averaged denudation rates. Zunka (Reference Zunka2018) also measured lateral bluff erosion rates from 10Be and used slip-off slope geometry to estimate ratios of lateral to vertical erosion to infer longer term average vertical incision rates of ~2 m/Ma (2 mm/ka). Together with the presence of prominent river bluffs, local catchment averaged denudation rates (Zunka, Reference Zunka2018), and our OSL-derived vertical bedrock incision rates, these results imply that most of the vertical incision along the Buffalo River was completed prior to the last ca. 250 ka.
Most landscape evolution models assume that landscapes evolve through time toward dynamic equilibrium conditions where the rates of hillslope and channel processes are coupled (e.g., Hack, Reference Hack1960; Kirkby, Reference Kirkby and Abrahams1986; Howard, Reference Howard1994). However, evidence for transient evolution is not uncommon in natural landscapes (e.g., Beeson et al., Reference Beeson, McCoy and Keen-Zebert2017; Mudd, Reference Mudd2017). Discrepancies in short term versus long term rates of incision are possible if there are significant hiatuses in channel incision (i.e., the Sadler effect) (Finnegan et al., Reference Finnegan, Schumer and Finnegan2014). This phenomenon could explain both the higher bedrock incision rates captured by OSL, catchment-averaged denudation rates (Zunka Reference Zunka2018), and calcite dissolution (Covington et al., Reference Covington, Gulley and Gabrovšek2015), which average over significantly shorter timescales relative to the vertical incision rate estimates using 10Be and slip-off geometry provided by Zunka (Reference Zunka2018). In landscapes with heterogeneous lithology, deviation from steady state conditions may be especially likely because variability in bedrock resistance to erosion can amplify or mitigate topographic responses to forcings (Cook et al., Reference Cook, Whipple, Heimsath and Hanks2009; Forte et al., Reference Forte, Yanites and Whipple2016; DiBiase et al., Reference DiBiase, Denn, Bierman, Kirby, West and Hidy2018). Our work builds upon the growing body of literature that suggests that decoupling of hillslope-channel processes over millennial timescales is not uncommon in natural environments.
Controls on the timing of terrace aggradation, incision, and abandonment
A variety of processes may have led to the formation and preservation of the terraces along the Buffalo River. The terraces may indicate local or regional base level change (e.g., Gran et al., Reference Gran, Finnegan, Johnson, Belmont, Wittkop and Rittenour2013) or fluctuations in sediment supply and/or hydrologic conditions driven by climate change (e.g., Wegmann and Pazzaglia, Reference Wegmann and Pazzaglia2002). It is also possible that the terraces formed from autocyclic forces independent of external forcing (Bull, Reference Bull1990) or from bedrock meandering cutoff dynamics (Finnegan and Dietrich, Reference Finnegan and Dietrich2011). In the following section, we discuss the timing of terrace formation along the Buffalo River in the context of known sea level and regional paleoclimatic events.
Our OSL dating results suggest that strath planation was complete by ca. 250 ka, near the Marine Isotope Stage (MIS) 8/MIS 7 boundary (Fig. 6). Strath planation in temperate regions is most commonly associated with periods of increased sediment supply and/or decreases in discharge that most commonly occur during glacial periods (Pazzaglia and Brandon, Reference Pazzaglia and Brandon2001; Wegmann and Pazzaglia, Reference Wegmann and Pazzaglia2009; García and Mahan, Reference García and Mahan2014; Schanz et al., Reference Schanz, Montgomery, Collins and Duvall2018). At Fitton Cave within the Buffalo River watershed (Fig. 1), a speleothem record shows decreased growth rates and marked increases in both the δ13C and δ18O isotopic records between ca. 260–280 ka, possibly indicating a shift to drier conditions during this time (Fig. 6; Paces et al., Reference Paces, Hudson, Hudson, Turner, Bitting, Center, Kuniansky and Spangler2017). There is also some evidence to suggest that even south of the glacial limit, periglacial processes can lead to significant increases in sediment supply during glacial periods, which could allow for a shift to fluvial regimes that favor strath planation (Marshall et al., Reference Marshall, Roering, Bartlein, Gavin, Granger, Rempel, Praskievicz and Hales2015, Reference Marshall, Roering, Rempel, Shafer and Bartlein2021).

Figure 6. Composite regional paleoenvironmental and fluvial records. Marine Isotope Stages are listed as bold black numbers at the top of the figure. Interglacial stages are shown as vertical gray bands; glacial stages are shown as white bands. Marine isotope substages are not shown here. (A) Fluctuations in benthic δ18O composition provided by Lisiecki and Raymo (Reference Lisiecki and Raymo2005) is shown in black; the relative eustatic sea level reconstruction by Spratt and Lisiecki (Reference Spratt and Lisiecki2016) is shown in red; (B, C) paired δ13C and δ18O records from speleothems at Fitton Cave, AR, respectively (Paces et al., Reference Paces, Hudson, Hudson, Turner, Bitting, Center, Kuniansky and Spangler2017); (D) speleothem growth rates from central Texas (Musgrove et al., Reference Musgrove, Banner, Mack, Combs, James, Cheng and Edwards2001); (E) speleothem growth rates from Fitton Cave, AR (Paces et al., Reference Paces, Hudson, Hudson, Turner, Bitting, Center, Kuniansky and Spangler2017); (F) δ13C records from speleothems at Beckham Creek Cave, AR (Denniston et al., Reference Denniston, Gonzalez, Semken, Asmerom, Baker, Recelli-Snyder, Reagan and Bettis1999); (G) OSL ages for the Qtm and Qty terraces preserved along the Buffalo River; individual ages with errors for Qtm deposits are shown as circles; individual Qty ages are not shown here (refer to Tables 1 and 2 for a list of OSL ages); (H) ages of terraces preserved along Owl Creek, a tributary of the Brazos River in Central Texas (Meier et al., Reference Meier, Nordt, Forman and Driese2013); (I) ages of Prairie Complex terraces along the lower Mississippi River (Shen et al., Reference Shen, Tornqvist, Autin, Mateo, Straub and Mauz2012); (J) ages of terraces preserved along the Cimarron River in the High Plains of southwestern Kansas (Layzell et al., Reference Layzell, Mandel, Ludvigson, Rittenour and Smith2015).
Strath planation was followed by an extensive aggradational period that apparently persisted through to the last glacial period ca. 35 ka. A gap in the depositional record exists between ca. 220 ka and ca. 120 ka, which is possibly a reflection of sampling bias (Fig. 6). It is also possible that this gap reflects a period of non-deposition or erosion of the sedimentary record, but we find no evidence for buried soil horizons or cut-in-fill activity that would be expected if terraces experienced periods of long-term stability or if they were re-occupied by a younger channel.
Qtm terrace incision and abandonment occurred comparatively rapidly between ca. 35 ka and ca. 11 ka in response to an increase in water discharge, a decrease in sediment supply, or a drop in base-level (Schanz et al., Reference Schanz, Montgomery, Collins and Duvall2018). The end of Qtm aggradation coincides with the last glacial maximum (LGM) near the transition between MIS 3 and MIS 2 (Fig. 6). Glaciation did not extend as far south as the Buffalo River, but paleoclimate studies in the region suggest that climate transitioned from relatively warm and dry conditions to cool and wet conditions in the transition between MIS 3 and MIS 2. Mineralogic changes in clay sediments deposited in the Gulf of Mexico suggest that moisture inflow into the Midcontinent was reduced during MIS 3 (Sionneau et al., Reference Sionneau, Bout-Roumazeilles, Meunier, Kissel, Flower, Bory and Tribovillard2013). In contrast, during MIS 2 climates in the Midcontinent were relatively cooler and wetter, as indicated by a shift to C3 vegetation in Nebraska and Kansas (Johnson and Willey, Reference Johnson and Willey2000), by ẟ13C and ẟ18O contents from stalagmites in central Missouri (Dorale et al., Reference Dorale, Edwards, Ito and González1998), and by rapid speleothem growth in central Texas (Fig. 6D; Musgrove et al., Reference Musgrove, Banner, Mack, Combs, James, Cheng and Edwards2001). Terrace incision during MIS 2 also has been reported for the Cimarron River Valley in southwestern Kansas (Fig. 6; Layzell et al., Reference Layzell, Mandel, Ludvigson, Rittenour and Smith2015) and Owl Creek, a tributary of the Brazos River in central Texas (Fig. 6; Meier et al., Reference Meier, Nordt, Forman and Driese2013). Base level decrease also could have played a role in driving incision through upward-propagating knickpoints during early MIS 2 when eustatic sea level was ~120 m below the present (Fig. 6; Spratt and Lisiecki, Reference Spratt and Lisiecki2016). Base level control has been suggested for alluvial terrace incision along the lower Mississippi River, despite their long distance (up to ~600 km) from the present-day Gulf of Mexico shoreline (Fig. 6; Shen et al., Reference Shen, Tornqvist, Autin, Mateo, Straub and Mauz2012), but this interpretation has been controversial (see discussion in Otvos, Reference Otvos2013).
The youngest (Qty) terraces preserved along the Buffalo River aggraded during MIS 1 beginning ca. 14.5 ka. The timing of Qty terrace aggradation along the Buffalo River is consistent with aggradational units preserved regionally, including the Brazos (Waters and Nordt, Reference Waters and Nordt1995), Owl Creek (Fig. 6H; Meier et al., Reference Meier, Nordt, Forman and Driese2013), and Colorado rivers (Blum and Price, Reference Blum, Price and Kocurek1998) in central Texas; the Cimarron (Fig. 6; Layzell et al., Reference Layzell, Mandel, Ludvigson, Rittenour and Smith2015), Pawnee (Bettis and Mandel, Reference Bettis and Mandel2002), and Arkansas rivers (Forman et al., Reference Forman, Marín, Gomez and Pierson2008) in Kansas; and the Pomme de Terre River in southern Missouri (Brakenridge, Reference Brakenridge1981). During early MIS 1, the Ozark Plateau was characterized by a shift from cold-adapted boreal forest to mixed conifer-northern hardwoods forest that favors more temperate climates (King, Reference King1973). Between ca. 11–3 ka, the regional climate shifted to warmer, drier, steppe conditions, as evinced by δ13C records from stalagmites throughout Missouri and north-central Arkansas (Fig. 6; Denniston et al., Reference Denniston, Gonzalez, Semken, Asmerom, Baker, Recelli-Snyder, Reagan and Bettis1999, Reference Denniston, González, Asmerom, Reagan and Recelli-Snyder2000), palynological data from Missouri (Jones et al., Reference Jones, Williams and Jackson2017; King, Reference King1973), and loess deposition in west-central Kansas (Olson et al., Reference Olson, Nettleton, Porter and Brasher1997). The regional shift to drier conditions between ca. 11–3 ka is broadly consistent with the timing of Qty aggradation along the Buffalo River. An overall decrease in precipitation could result in reduced river discharge, which would promote terrace aggradation (e.g., Wong et al., Reference Wong, Banner and Musgrove2015). Incision of the Qty terraces likely began in the Middle to Late Holocene, but its precise timing is difficult to determine because high floods likely continue to contribute sediment to terrace treads (Neely, Reference Neely1985). Over the last ca. 3 ka, climates in the region were characterized by wetter conditions (Delcourt and Delcourt, Reference Delcourt and Delcourt1996; Jones et al., Reference Jones, Williams and Jackson2017), potentially offering a driving mechanism for Qty terrace incision. The synchroneity of regional aggradational events suggests that the timing of terrace aggradation and incision along the Buffalo River likely varies with the timing of regional climatic events, which can influence hydrologic processes and changes in sediment supply.
CONCLUSIONS
In this study, we have developed an OSL-based reconstruction of the late Quaternary aggradational and incisional history of the Buffalo River from the alluvium collected from strath and fill terraces. Our TT-OSL ages suggest a minimum planation age of ca. 250 ka for the Qtm terraces and an aggradational phase that apparently persisted for ca. 200 ka. Importantly, our results from modern analogue samples suggest that the fluvial sediments along the Buffalo River were well bleached at deposition and that a TT-OSL protocol can be used reliably to extend the upper dating limit beyond the range of conventional quartz OSL techniques. Qtm aggradation was punctuated by an incisional period, which likely occurred near the LGM between ca. 35 ka and 11 ka. The onset of Qty terrace aggradation occurred downstream (ca. 14 ka) with a response that propagated upstream forming the youngest terrace deposits (ca. 5 ka). The long history of Qtm aggradation suggests that terraces along the Buffalo River can continue to aggrade over hundreds of thousands of years. Consequently, interpretations built on assumptions of geologically instantaneous alluvial deposition following strath planation and abandonment should be considered with caution, particularly where thick sequences of alluvial fill are preserved over strath terraces. Our OSL ages suggest that there is some correlation between the timing of Qty and Qtm terrace aggradation and incision during drier and wetter paleohydrological conditions, respectively.
Our OSL age estimates also suggest that vertical incision rates vary spatially with lithologic resistance along the Buffalo River—where the channel has incised the less-resistant Boone Formation, vertical bedrock incision rates are lower relative to the higher resistance Everton Formation. This work has served to substantiate previous observations relating valley width and lithological resistance along the Buffalo River that have suggested that lateral processes outpace vertical processes in reaches with lower resistance. Lithologic resistance can mitigate or amplify in-channel erosion rates, the effects of which can potentially propagate through an entire catchment. Over the timescales of observation in this study (ca. 250 ka), our in-channel incision rates along the Buffalo River diverge from catchment erosion rates resulting in topography that is characterized by bluffs and wide floodplains.
Supplementary material
The supplementary material for this article can be found at https://doi.org/10.1017/qua.2023.16.
Acknowledgments
This research was supported by a National Science Foundation (NSF) grant to Keen-Zebert (EAR 1360572). The work conducted in the Buffalo National River was in compliance with NPS Scientific Research and Collecting Permit #BUFF-2017-SCI-0001, Study #BUFF-00035. The authors thank Harrison Gray, Sarah Schanz, Dong-Eun Kim, and Yeong Bae Seong for their thoughtful and thorough reviews that contributed to the improvement of this manuscript. Any use of trade, firm, or product names is for descriptive purposes only and does not imply endorsement by the U.S. Government.


