


1. Introduction
Mushy layers are reactive porous media where a multicomponent liquid can exchange mass with a solid matrix through melting and solidification (Huppert & Worster Reference Huppert and Worster1985;Anderson & Guba Reference Anderson and Guba2020). Mushy layers are found in a number of natural settings including sea-ice (Wells, Hitchen & Parkinson Reference Wells, Hitchen and Parkinson2019), magma chambers (Holness et al. Reference Holness, Tegner, Nielsen and Charlier2017), Earth's mantle during its early evolution (Monteux et al. Reference Monteux, Andrault, Guitreau, Samuel and Demouchy2020) and possibly Earth's inner core–outer core boundary (Huguet et al. Reference Huguet, Alboussiere, Bergman, Deguen, Labrosse and Lesœur2016). Mushy layers are also studied in metallurgy as they arise during casting (Worster Reference Worster1992b). A significant amount of experimental work has been carried out using aqueous systems owing to the ease with which these can be manipulated (Worster Reference Worster1997; Huguet et al. Reference Huguet, Alboussiere, Bergman, Deguen, Labrosse and Lesœur2016). An important aspect of mushy systems is that solidification and melting are usually accompanied by a change in the concentration of solute in the liquid. This change in concentration can result in the interstitial liquid having either stable or unstable buoyancy, and the convection arising from unstable gradients has been the subject of many studies (Worster Reference Worster1997).
There have been a number of sets of theoretical equations used to describe mushy layers (McDonald & Hunt Reference McDonald and Hunt1969, Reference McDonald and Hunt1970; Mehrabian & Flemings Reference Mehrabian and Flemings1970; Copley et al. Reference Copley, Giamei, Johnson and Hornbecker1970; Hills, Loper & Roberts Reference Hills, Loper and Roberts1983; Huppert & Worster Reference Huppert and Worster1985; Worster Reference Worster1986, Reference Worster1992a). All of these have been based on a continuum approach, whereby a representative elementary volume (REV) is assumed to contain a mixture of liquid and solid matrix. In particular, Worster (Reference Worster1997) defined an ‘ideal’ mushy layer, one in which the interstitial liquid is assumed to be in perfect local thermodynamic equilibrium with the host matrix and hence its temperature and concentration are confined to the liquidus. Additionally, in an ideal mushy layer, the solid phase is assumed to be stationary with permeability that depends only on porosity while the fluid is assumed to be isotropic and Boussineq. Thermodynamic equilibrium between the liquid and solid requires that thermal and solutal diffusion at the pore scale occur over time scales that are short compared with the time for liquid to migrate through a pore. As such, there are separations of length and time scales that are necessary in order for a mushy layer to be ideal. Continuum-scale modelling of mushy layers also requires using effective material properties for the combined solid and liquid.
The requirement that interstitial fluids remain on the liquidus can lead to transport-induced melting or freezing due to the difference in diffusion and advection rates of heat and solute in passive porous media (Butler Reference Butler2011). Heat diffuses faster than solute, leading to melting when there is a hot invading fluid and solidification for a cold invading fluid in a diffusion-dominated system. For advection-dominated systems, solute is transported faster owing to effects of thermal retardation. This leads to the counterintuitive result that a hot invading fluid will induce freezing while a cold invading fluid will induce melting. One goal of this study is to investigate the validity of predictions made based on ideal mushy layer theory for this transport-induced melting and solidification.
While most modelling of flows in porous media is carried out at the continuum scale, assuming an REV containing a statistically representative volume of liquid and solid, modelling of porous medium flows at the pore scale has been carried out for roughly the last two decades (Meakin & Tartakovsky Reference Meakin and Tartakovsky2009; Bondino et al. Reference Bondino, Hamon, Kallel and Kac2013; Bird et al. Reference Bird, Butler, Hawkes and Kotzer2014; Golparvar et al. Reference Golparvar, Zhou, Wu, Ma and Yu2018). Pore-scale modelling can be used to determine continuum-scale material properties such as permeability as well as effective properties such as thermal conductivity and heat capacity. Pore-scale modelling can also be used to test assumptions made in deriving continuum theories.
Effects of mechanical dispersion are typically neglected in mushy layer modelling or are assumed to simply contribute to the effective solute and thermal diffusivities (Butler Reference Butler2011; Wells et al. Reference Wells, Hitchen and Parkinson2019; Anderson & Guba Reference Anderson and Guba2020; Boury et al. Reference Boury, Meyer, Vasil and Wells2021). Mechanical dispersion arises in porous media because fluid velocities in the centres of pores are higher than those near pore walls and also because of different pore sizes and because fluid parcels that are initially close together may become separated at forks of pore networks (Bear Reference Bear1972;Freeze & Cherry Reference Freeze and Cherry1979). In studies of passive porous media, effects of mechanical dispersion are usually parametrized using velocity-dependent, effective thermal and solutal diffusivities (Bear Reference Bear1972). Pore-scale modelling inherently includes the effects of mechanical dispersion. However, because of the simple straight pore geometry that we will be using, only effects due to the velocity profile across the pore can be studied here.
In the current paper, we present a first attempt at pore-scale modelling of a mushy system. As a simplest possible starting point, we consider a single straight cylindrical pore surrounded by a solid cylindrical annulus with which heat and mass can be exchanged. This is similar in spirit to the early investigation of mechanical dispersion in a straight tube by Taylor (Reference Taylor1953). The long axis of our domain is intended to mimic the length scales over which macroscopic temperature and solute variations occur. A single straight cylindrical pore clearly lacks many complexities associated with real porous media, including variations in pore thickness and pore branches and interconnections. However, our aim is to study macroscopic-scale transport that occurs as a result of transport at the much smaller pore scale and conditions under which local thermodynamic equilibrium persists at the pore scale. We envision that a simplified porous layer might be modelled by a large number of parallel straight pores for which our cylindrical model serves as a unit cell. In our investigation, the pore fluid is required to have the liquidus temperature and concentration at the pore wall, and we consider the diffusive and advective transport of a fluid with sinusoidally varying initial axial concentration and temperature profiles. In passive porous media, temperature and solute fields diffuse and advect at different rates, while in ideal mushy layers the temperature and concentration are constrained to be the same and hence the advection velocities of temperature and concentration gradients must also be equal. The transport of fluids with gradients in concentration and temperature causes freezing or melting (Butler Reference Butler2011) in mushy layers. The degree to which the solute and temperature fields remain in equilibrium with those of the solid matrix depends on the ratios of the thermal and solutal diffusion times to the advection time at the pore scale, which we quantify with the pore-scale Péclet number. We thus compare the predictions of our pore-scale mushy model with those of a one-dimensional ideal mushy layer model and with an analytical solution for an ideal mushy layer for sinusoidally varying temperature and solute based on the theory in Butler (Reference Butler2011). We seek to identify the Péclet number at which the ideal mushy layer approximation begins to break down and to examine non-ideal behaviour.
Non-ideal mushy layer behaviour may also arise from kinetic effects – if the time scale to reach thermal equilibrium at solid–liquid boundaries is not short compared with time scales for transport in the system. We note that this cause of local thermal disequilibrium can be studied using continuum models. Consequently, we will set aside examination of possible non-ideal behaviour due to kinetic effects for a future study and assume perfect equilibrium at the pore walls.
Geophysical systems in which melting and solidifying fluids flow in channels have been previously studied. Brine channels or chimneys can form in convectively unstable mushy systems in which complete melting occurs in narrow regions and fluid velocities may be significantly higher than within the mushy layers themselves. Because of their importance in the evolution of sea-ice and for climate models, these have been studied extensively (Schulze & Worster Reference Schulze and Worster1998; Chung & Worster Reference Chung and Worster2002; Rees, David & Worster Reference Rees, David and Worster2013). While brine channels have some similarity to the system in our study, there are a number of differences, including the fact that flow occurs from the mushy layer into brine channels. Additionally, the degree of disequilibrium within the brine channel was not the main focus of those previous studies. The propagation of magma through country rock is of interest because of its geological implications for feeding volcanoes and the emplacement of igneous dykes (Bruce & Huppert Reference Bruce and Huppert1989; Holmes-Cerfon & Whitehead Reference Holmes-Cerfon and Whitehead2011). Unlike in the current study, the injected fluid in those studies is assumed to be significantly out of equilibrium with the country rock and is modelled as a single chemical component.
In what follows, we first give a theoretical description of our pore-scale model, the ideal mushy layer model and an approximate analytical solution for sinusoidally varying temperature and solute in a one-dimensional ideal mushy layer. We then show results for solute and temperature in a passive porous layer in order to illustrate the differences in behaviour of temperature and solute as a function of Péclet number. We then show results for transport-induced solidification and melting relevant to some common experimental mushy systems consisting of aqueous salts.
2. Governing equations for the pore-scale model
We work in a domain consisting of an inner cylinder of initial radius  $R_{1}$ containing liquid and a concentric cylindrical annulus of initial inner radius
  $R_{1}$ and outer radius
  $R_{2}$ which is a solid region (see figure 1). The cylinder has axial length
  $H$, which we take to be a length over which macroscopic thermal and solutal gradients occur. Coordinates
  $r$ and
  $z$ represent the radial distance from the central axis and the distance from the base of the cylinder. We will assume symmetry such that all quantities are unchanged by a rotation about the cylinder axis. Note that the effects of gravity are not included in the model. We intend for our concentric cylinders to represent a unit cell of a very simple porous medium with long, straight, non-branching pores. However, we also note that it is impossible to tile a plane with circles. A plane can be tiled with hexagons, however, and the use of a domain consisting of a cylindrical liquid pore with a hexagonal outer domain boundary would result in a change in porosity of roughly 10 %.

Figure 1. The solution domain is a cylinder with axial length  $H$, inner radius
  $R_1$, and total radius
  $R_2$. The liquid and solid regions are coloured red and blue.
Melting and solidification will cause changes in the radial position of the liquid–solid boundary and so of the radius of the inner cylinder. We assume that these changes are small enough that they do not significantly affect the axial velocity, and we do not allow our simulation domain to change with time. However, we track the radial position of the radius of the inner cylinder using the variable  $\tilde {R}_{1}$ which is a function of axial position and time.
We impose a flow consistent with a constant pressure gradient along the long axis of the inner cylinder of the form
 \begin{equation} {w=\frac{-1}{4 \eta} \frac{{\rm d}p}{{\rm d}z} (R_{1}^2-r^{2})}, \end{equation}
where  $w$ is the
  $z$ component of velocity,
  $\eta$ is the fluid viscosity,
  $p$ is pressure and
  $r$ is the radial coordinate (Turcotte & Schubert Reference Turcotte and Schubert2001).
The heat transport is described by the advection–diffusion equation in the liquid region,
 \begin{equation} \frac{\partial T}{\partial t}+w \frac{\partial T}{\partial z} =\kappa_l \nabla^{2} T, \end{equation}
and a diffusion equation in the solid,
 \begin{equation} \frac{\partial T}{\partial t} =\kappa_s \nabla^{2} T. \end{equation}
Here,  $T$ is temperature,
  $t$ is time, and
  $\kappa _s$ and
  $\kappa _l$ are the thermal diffusivities of the solid and liquid, respectively, and are assumed to be constant.
We take the outer boundary,  $R_2$, to be thermally insulating:
 \begin{equation} \left.\frac{\partial T}{\partial r} \right|_{R_2} =0. \end{equation}
Melting and freezing at the liquid–solid boundary will cause a change in the radius of the fluid region as well as the release or absorption of latent heat. These processes result in the following jump condition at the fluid–solid boundary:
 \begin{equation} \left.-k_s\frac{\partial T}{\partial r} \right|_{R_1^{+}}+\left.k_l\frac{\partial T}{\partial r} \right|_{R_1^{-}}={-}L\rho_s \frac{\partial {\tilde{R}_1}}{\partial t}. \end{equation}
Here,  $k_s$ and
  $k_l$ are the thermal conductivities of the solid and liquid,
  $L$ is the latent heat per unit mass and
  $\rho _s$ is the density of the solid. We also require that temperature be continuous across the solid–liquid boundary.
A second advection–diffusion equation expresses the conservation of solute:
 \begin{equation} \frac{\partial C}{\partial t}+w \frac{\partial C}{\partial z} =D \nabla^{2} C, \end{equation}
where  $D$ is the solutal diffusivity and
  $C$ is the concentration of a solute in the liquid.
Freezing or melting at the solid–liquid boundary will cause concentration or dilution of the solute, and so mass balance on the liquid side of the boundary requires
 \begin{equation} \left.\rho_{l} D\frac{\partial C}{\partial r} \right|_{R_{1}} =\rho_{s} \left[C_s -C(R_{1})\right]\frac{\partial {\tilde{R}_1}}{\partial t}. \end{equation}
Here,  $C_s$ is the concentration of the solute in the solid, which we assume to be either 0 or 1. We note that if the radial position of the pore wall varied with axial position, there would be an axial component of the normal to the pore wall and (2.5) and (2.7) would need to be modified to take these components into consideration. In keeping with our approximation that variations in the pore wall radius are small and that the geometry of the simulation domain does not change, we assume that solute changes related to latent heat and phase changes are adequately taken into account by the radial component only.
We need an equation describing the rate of change of the inner radius,  $\tilde {R}_{1}$, which we assume to be proportional to the degree of disequilibrium at the inner wall boundary. The temporal variation of the inner boundary at a given height is then given by (Kerr et al. Reference Kerr, Woods, Worster and Huppert1990)
 \begin{equation} {\frac{\partial \tilde{R}_1}{\partial t} =B\left[T(R_1)-T_{eq}(C(R_1))\right]}, \end{equation}
where we have neglected boundary curvature effects. Here,  $B$ is a kinetic constant and
  $T_{eq}$ is the equilibrium temperature (the liquidus), which we take to be linear:
 \begin{equation} T_{eq}=m_1 C+{T_{m}}. \end{equation}
Here,  $T_m$ and
  $m_1$ are constants, (2.8) is used to update
  $\tilde {R}_{1}$ as a function of time and
  $z$, and
  ${\partial \tilde {R}_{1}}/{\partial t}$ is fed back into (2.5) and (2.7).
We calculate the porosity,  $\phi$, from the areal fraction occupied by liquid as a function of height:
 \begin{equation} {\phi(z,t)=\frac{\tilde{R}_{1}(z,t)^2}{R_{2}^{2}}.} \end{equation}
3. Non-dimensional forms
We use the initial radius at the inner boundary,  $R_1$, the velocity along the midline,
  $w_0$, and the ratio
  $R_1/w_0$ as length, velocity and time scales. With these choices, the dimensionless axial length of the domain becomes
  $H^{\prime }=H/R_1$, while the velocity field becomes
 \begin{equation} w^\prime=(1-r^{\prime 2}). \end{equation}
Here, primes indicate dimensionless variables corresponding to dimensional variables introduced in § 2. Equation (3.1) can be integrated over the area of a circular pore to give the total volume flux:
 \begin{equation} Q=\frac{\rm \pi}{2}. \end{equation}
We can further divide  $Q$ by the combined area of the pore and solid to get the Darcy velocity:
 \begin{equation} w_{D}=\frac{Q}{{\rm \pi} R_{2}^{\prime 2}}= \frac{1}{2 R_{2}^{\prime 2}}=\frac{\phi_0}{2}. \end{equation}
The pore velocity,  $w_{c}$, is the mean velocity within the pore only and is given by
 \begin{equation} w_{c}=\frac{w_{D}}{\phi_{0}}=\frac{Q}{\rm \pi} =\frac{1}{2}. \end{equation}
The non-dimensionalized temperature and concentration are defined as
 \begin{equation} \theta= \frac{T-T_0}{T_{max}-T_0} \end{equation}
and
 \begin{equation} c= \frac{C-C_{eq}(T_0)}{C_{eq} (T_{max})-C_{eq}(T_{0})}, \end{equation}
where  $T_0$ and
  $T_{max}$ represent the average and maximum values of the initial temperature while
  $C_{eq}(T)$ is the liquidus concentration for a given temperature. Note that we assume the initial temperature to vary sinusoidally in
  $z$ and so
  $c$ and
  $\theta \in [-1,1]$ since the temperature amplitude typically decreases with time. The liquidus relation then becomes simply
 \begin{equation} \theta=c. \end{equation}
With this non-dimensionalization, when the dimensional liquidus has a negative slope ( $m_{1} < 0$),
  $C_{eq}(T_{max}) - C_{eq}(T_0) < 0$ and the dimensionless concentration,
  $c$, decreases with increasing dimensional concentration,
  $C$. The dimensionless temperature
  $\theta$ always increases with the dimensional temperature
  $T$, however.
The non-dimensional forms of (2.2), (2.3) and (2.6) are
 \begin{gather} \frac{\partial \theta}{\partial t^\prime}+w^\prime \frac{\partial \theta}{\partial z^\prime} =\frac{1}{{{Pe}}} \nabla^{\prime 2} \theta, \end{gather}
 \begin{gather} \frac{\partial \theta}{\partial t^\prime} =\frac{\kappa_r}{{{Pe}}} \nabla^{\prime 2} \theta, \end{gather}
 \begin{gather} \frac{\partial c}{\partial t^\prime}+w^\prime \frac{\partial c}{\partial z^\prime} =\frac{\epsilon}{{{Pe}}} \nabla^{\prime 2} c, \end{gather}
where  ${{Pe}} = w_0 R_1/ \kappa _l$ is a pore-scale Péclet number and
  $\kappa _r = \kappa _s/ \kappa _l$ represents the ratio of the solid to liquid thermal diffusivities. The inverse Lewis number is
  $\epsilon =L_e^{-1} = D/\kappa _l$. The Péclet numbers determine the relative magnitudes of advection and diffusion. Since the chosen length scale is the pore radius,
  ${{Pe}}$ and
  ${{Pe}}/\epsilon$ represent the ratios of time scales for thermal and solutal diffusion to advection over a pore radius. It is additionally useful to define a system or continuum-scale Péclet number with length scale determined by the length of the simulation domain:
  ${{Pe}}_{c}= {w_0} w_{D} H / \kappa _{l}= w_{D} {{Pe}} H /R_{1} = {\phi _{0} {{Pe}} H /(2 R_1)}$. The continuum Péclet number represents the ratio of the time scales for thermal diffusion and advection over the distance
  $H^{\prime }$ over which axial gradients exist. The Darcy velocity
  $w_D$ is used rather than the central pore velocity in the definition of
  ${{Pe}}_c$ so that it can be used in the ideal mushy model where
  $w_0$ is not defined. Note that
  $w_0 w_D$ is the dimensional Darcy velocity.The solutal system Péclet number is given by the ratio
  ${{Pe}}_{c}/\epsilon$. We additionally find it useful to consider hybrid Péclet numbers
  $P_h=(R_{1}^2/\kappa _l)/(H/w_0)={{Pe}} R_1/H$ (thermal) and
  $P_h/\epsilon$ (solutal). These represent the ratios of time scales for diffusive equilibration across a pore radius to advective transport in the axial direction over the distances over which axial gradients occur. The two time scales in this latter Péclet number are the same as those identified by Taylor (Reference Taylor1953).
The Péclet numbers are summarized in table 1, and in our simulations we investigate behaviour from low to high  ${{Pe}}$ and
  ${{Pe}}_c$.
Table 1. Péclet numbers and definitions. Note that all quantities in the ‘Formula’ column are dimensional.

The thermal boundary conditions become
 \begin{gather} \left.\frac{\partial \theta}{\partial r^\prime}\right| _{R_2^\prime} = 0, \end{gather}
 \begin{gather} \left.-{k_s} \frac{\partial \theta}{\partial r^\prime} \right| _{R_1^{\prime +}}+\left.\frac{\partial \theta}{\partial r^\prime} \right| _{R_1^{\prime -}}={-}S {{Pe}}\frac{\partial {\tilde{R}_1^\prime}}{\partial t^\prime}\end{gather}
and
 \begin{equation} {\theta(R_1^{\prime +}) = \theta(R_1^{\prime -})}. \end{equation}
Here  $S={\rho _{s} L}/{\rho _{l} c_{pl} (T_{max}-T_{0})}$ is the Stefan number, which characterizes the relative magnitudes of latent and sensible heat. For the solute boundary condition we have
 \begin{equation} \left.\frac{\partial c}{\partial r^\prime}\right| _{R_1^\prime} = \rho_{s}^\prime (\mathcal{C} -c)\frac{{{Pe}}}{\epsilon}\frac{\partial \tilde{R}_1^\prime}{\partial t^\prime}, \end{equation}
where  $\mathcal {C}=({C_{s}-C_{eq}(T_{0})})/({C_{eq}(T_{max})-C_{eq}(T_{0})})$ is the concentration ratio which characterizes the relative changes in concentration caused by melting or freezing versus those caused by advection and diffusion. The non-dimensional solid density is
  $\rho _{s}^\prime =\rho _{s}/\rho _{l}$.
The kinetic relation governing the rate of melting at the pore wall is
 \begin{equation} \frac{\partial {\tilde{R}_1^\prime}}{\partial t^\prime} =B^\prime[\theta{(R_1)} - c{(R_1)}], \end{equation}
where  $B^\prime = B(T_{max}-T_0)/w_0$.
The parameter  $B^\prime$ characterizes the relative rates of melting and freezing versus advection and controls the degree of disequilibrium at the liquid–solid boundary. If
  $B^\prime =0$, there is no melting or freezing and we regain the equations for a passive pore. In the calculations related to mushy layers, we use a value of
  $B^{\prime } \gg 1$ (
 $B^\prime = 10^4$) so that
  $\theta (R_1) \approx c(R_1)$.
In what follows, all variables are dimensionless and with this understanding we neglect the primes.
4. Ideal mushy layer equations
As shown by Worster (Reference Worster1992b) and Butler (Reference Butler2011), the one-dimensional equations governing the evolution of temperature and solute in an ideal mushy layer can be written as
 \begin{equation} \overline{\rho c_{p}} \frac{\partial \theta}{\partial t} + w_{D} \frac{\partial \theta}{\partial z} = \frac{1}{{{Pe}}_{c}} \frac{\partial}{\partial z} {\bar{k}} \frac{\partial \theta}{\partial z} - S \frac{\partial \phi}{\partial t} \end{equation}
and
 \begin{equation} \phi \frac{\partial c}{\partial t} + w_{D} \frac{\partial c}{\partial z} = \frac{\epsilon {\phi}}{{{Pe}}_{c}}\frac{\partial^{2} c}{\partial z^{2}} + \rho_{s} (\mathcal{C} - c) \frac{\partial \phi}{\partial t}, \end{equation}
where, unlike for an ideal mushy layer where  $\theta =c$, we use the more general constraint
 \begin{equation} \frac{\partial \phi}{\partial t}=B_{i} (\theta - c). \end{equation}
Equations (4.1) and (4.2) are solved on a one-dimensional domain in order to compare with the single-pore mushy model. We also define  $\overline {\rho c_p} = \phi +(1-\phi ) \rho _{s} c_{ps}$ and
  $\bar {k} = \phi + (1-\phi ) k_{s}$ as the heat capacity per unit volume and thermal conductivity that are volume-averaged over an REV and have been non-dimensionalized by the liquid properties. We note that constraints (3.15) and (4.3) differ in that the former is enforced only on the pore wall in the two-dimensional simulations while the latter enforces equilibrium everywhere in the simulation domain. The coefficients
  $B$ and
  $B_i$ are related by
  $B_i=2 \sqrt {\phi \phi _0} B$. However, in all cases involving mushy layers, we use
  $B \gg 1$ and
  $B_i \gg 1$ such that
  $c \approx \theta$ so that the exact values of
  $B$ and
  $B_i$ are not important.
We also note that in (4.2) we have taken the effective solute diffusivity to be proportional to porosity, but we are neglecting terms due to axial gradients in porosity. We expect this approximation to be reasonable given the small variations in porosity in our calculations.
5. Approximate analytical solutions for sinusoidal variations in an ideal mushy layer
As shown in Butler (Reference Butler2011), (4.1) and (4.2) can be rearranged to obtain separate evolution equations for the temperature or solute, assuming  $\theta =c$ as is appropriate for an ideal mushy layer, and for the porosity:
 \begin{equation} \frac{\partial \theta}{\partial t} = A_{1,1} \frac{\partial \theta}{\partial z} + A_{1,2} \frac{\partial^{2} \theta}{\partial z^{2}} \end{equation}
and
 \begin{equation} \frac{\partial \phi}{\partial t} = A_{2,1} \frac{\partial \theta}{\partial z} + A_{2,2} \frac{\partial^{2} \theta}{\partial z^{2}}. \end{equation}
Here
 \begin{gather} A_{1,1}=\frac{-\rho_{s} (\mathcal{C}-\theta)-S}{\overline{\rho c_{p}} \rho_{s} (\mathcal{C} - \theta) +S \phi} w_{D}, \end{gather}
 \begin{gather} A_{1,2}=\frac{\dfrac{\bar{k}}{{{Pe}}_{c}} \rho_{s} (\mathcal{C} - \theta) + S \dfrac{\epsilon}{{{Pe}}_{c}} \phi}{\overline{\rho c_{p}} \rho_{s} (\mathcal{C} - \theta) +S \phi}, \end{gather}
 \begin{gather} A_{2,1}=\frac{\overline{\rho c_{p}} -\phi}{\overline{\rho c_{p}} \rho_{s} (\mathcal{C} - \theta) +S \phi} w_{D}, \end{gather}
 \begin{gather} A_{2,2}=\frac{\dfrac{\phi}{{{Pe}}_{c}}(\bar{k} - \epsilon \overline{\rho c_{p}})}{\overline{\rho c_{p}} \rho_{s} (\mathcal{C} - \theta) +S \phi}. \end{gather}
We have neglected terms due to the product of gradients of temperature and porosity that arise from the porosity dependence of the thermal conductivity and solutal diffusivity. The coefficients multiplying the terms representing the products of the gradients are similar in magnitude to the  $A_{1,2}$ and
  $A_{2,2}$ terms, and hence the relative size of the
  ${\partial ^{2} \theta }/{\partial z^2} \approx \Delta \theta /H^2$ and
  $({\partial \theta }/{\partial z})({\partial \phi }/{\partial z}) \approx \Delta \theta \Delta \phi /H^2$ terms determines the relative size of these two terms. Here,
  $\Delta \theta$ and
  $\Delta \phi$ represent typical changes in temperature and porosity from their background values. For all of the results that we present, the porosity varies by only a few per cent while the dimensionless temperature variation is of order 1, and so the error in neglecting the term in the product of the gradients is of the order of a few per cent.
If  $\theta \ll \mathcal {C}$ and
  $\phi$ changes by only small amounts, we can approximate
  $A_{1,1}$,
  $A_{1,2}$,
  $A_{2,1}$ and
  $A_{2,2}$ as constants. We can then write a general travelling periodic solution for (5.1) as
 \begin{equation} \theta=a {\rm e}^{{\rm i}(k z-\omega t)}, \end{equation}
where  $k$ is the wavenumber and
  $\omega$ is angular frequency. Substituting (5.7) into (5.1), we get
 \begin{equation} \omega ={-}A_{1,1} k -{\rm i} A_{1,2} k^{2}. \end{equation}
Substituting this form back into (5.7), we get
 \begin{equation} \theta = a \exp({{\rm i}(k z - ({-}A_{1,1} k -{\rm i} A_{1,2} k^{2})t)}), \end{equation}
where  $a$ is a constant that depends on the initial condition. Since we use
  $\sin (2 {\rm \pi}z/H)$ as our initial condition, we can choose the imaginary part of (5.9) as the solution and recognize that
  $k=2 {\rm \pi}/H$, which gives
 \begin{equation} \theta {(z,t)} = \sin[2 {\rm \pi}/H(z+A_{1,1} t)] {\rm e}^{{-}4 {\rm \pi}^2 A_{1,2} t/H^2}. \end{equation}
From (5.1), we can see that the coefficient  $A_{1,2}$ corresponds to the effective diffusivity in an ideal mushy system. If
  $\mathcal {C} \gg S$, melting or solidifying will have a greater effect on the solute than temperature, and the form of
  $A_{1,2}$ shows that the effective diffusivity will approach the thermal diffusivity of a passive porous layer. If
  $\mathcal {C} \ll S$, melting or solidifying will strongly affect temperature while only weakly affecting solute concentration, and the diffusivity will approach that of solute for a passive porous layer. Equation (5.10) shows that the thermal disturbance will decay with time constant
  $\tau =H^{2}/(4 {\rm \pi}^{2} A_{1,2}$) as a result of diffusion.
The thermal and solutal disturbance will be transported by the flow at speed  $w_{eff}=-A_{1,1}$, which is the same velocity as that found by Butler (Reference Butler2011). As discussed in Butler (Reference Butler2011), and can be seen by inspection of (5.3),
  $w_{eff}$ is a weighted average of the thermal advection speed,
  $w_{T}=w_{D}/\overline {\rho c_{p}}$, and the solute advection speed (or pore velocity),
  $w_{c}$, for a passive porous layer. The thermal advection speed for a passive porous medium is different from
  $w_{D}$ because of the effects of thermal retardation (Freeze & Cherry Reference Freeze and Cherry1979) – the temperature of the liquid will equilibrate with that of the solid as it flows, resulting in the speed of a thermal front being different from that of the mean flow velocity. As shown by Butler (Reference Butler2011), if
  $\mathcal {C} \gg S$, which corresponds to a system where melting or solidification changes the solute concentration more than the temperature, the mushy advection velocity will approach
  $w_{T}$. In the opposite limit, when
  $\mathcal {C} \ll S$, melting or solidification will more strongly affect the temperature than the solute concentration, and
  $w_{eff} \approx w_{c}$.
Using (5.10), we can derive expressions for  ${\partial \theta }/{\partial z}$ and
  ${\partial ^{2} \theta }/{\partial z^{2}}$. We can substitute these into (5.2) to get
 \begin{equation} \frac{\partial
\phi}{\partial t} = \textrm{Im}({\rm i} A_{2,1} k - k^{2}
A_{2,2} {\rm e}^{{\rm i}(k z - \omega t)}).
\end{equation}
\begin{equation} \frac{\partial
\phi}{\partial t} = \textrm{Im}({\rm i} A_{2,1} k - k^{2}
A_{2,2} {\rm e}^{{\rm i}(k z - \omega t)}).
\end{equation}
Integrating equation (5.11) with respect to time and using (5.8) gives
 \begin{align} \phi &=
\textrm{Im}\left(\frac{-A_{2,1} k - {\rm i} k^{2}
A_{2,2}}{\omega} {\rm e}^{{\rm i} (k z - \omega
t)}\right)+\phi_{0}\nonumber\\
&=\textrm{Im}\left(\frac{A_{2,1}+{\rm
i} k A_{2,2}}{A_{1,1}+{\rm i} A_{1,2} k} {\rm e}^{{\rm i} (
k z + A_{1,1} t)} {\rm e}^{{-}A_{1,2}
t^2}\right)+\phi_{0}.
\end{align}
\begin{align} \phi &=
\textrm{Im}\left(\frac{-A_{2,1} k - {\rm i} k^{2}
A_{2,2}}{\omega} {\rm e}^{{\rm i} (k z - \omega
t)}\right)+\phi_{0}\nonumber\\
&=\textrm{Im}\left(\frac{A_{2,1}+{\rm
i} k A_{2,2}}{A_{1,1}+{\rm i} A_{1,2} k} {\rm e}^{{\rm i} (
k z + A_{1,1} t)} {\rm e}^{{-}A_{1,2}
t^2}\right)+\phi_{0}.
\end{align}Hence,
 \begin{align}
\phi {(z,t)} &= \frac{{\rm e}^{- A_{1,2} k^{2} t}}{A_{1,1}^{2}+A_{1,2}^{2}
k ^{2}}\big[(A_{1,1} A_{2,1} + A_{1,2} A_{2,2} k^{2}) \sin [k
(z + A_{1,1} t)] \nonumber\\
&\quad + k (A_{1,1} A_{2,2} -A_{1,2}
A_{2,1}) \cos[k(z+A_{1,1} t)]\big]+\phi_{0}.
\end{align}
\begin{align}
\phi {(z,t)} &= \frac{{\rm e}^{- A_{1,2} k^{2} t}}{A_{1,1}^{2}+A_{1,2}^{2}
k ^{2}}\big[(A_{1,1} A_{2,1} + A_{1,2} A_{2,2} k^{2}) \sin [k
(z + A_{1,1} t)] \nonumber\\
&\quad + k (A_{1,1} A_{2,2} -A_{1,2}
A_{2,1}) \cos[k(z+A_{1,1} t)]\big]+\phi_{0}.
\end{align}Butler (Reference Butler2011) examined transport-induced melting and solidification for the case of a front propagating through an ideal mushy layer. Both the invading fluid and the host fluid had temperatures and concentrations related by the liquidus but at different temperatures. It was shown that for diffusion-dominated transport, a hot invading fluid will induce melting while a cold invading fluid will induce freezing, because the temperature field in a passive porous layer will diffuse faster than a compositional one. In contrast, for an advection-dominated system, because compositional fields will advect faster than thermal fields in passive porous layers, hot invading fluids will induce freezing while cold invading fluids will induce melting. Note that the invading fluid may be either solute-rich or solute-poor depending on the sign of the slope of the liquidus, but whether freezing or melting occurs depends only on whether the temperature of the invading fluid is higher or lower than that of the host fluid.
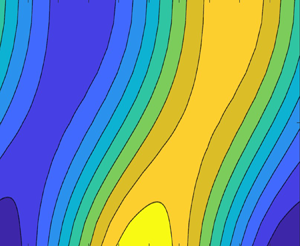
Examining equations (5.2) and (5.13), we can understand similar phenomena for sinusoidally varying perturbations. Figure 2(a) shows an initial sinusoidal thermal and compositional perturbation with a small degree of disequilibrium for a diffusion-transport-dominated case. In regions where  $\theta$ and
  $c$ are high (sector 1 in figure 2a), small degrees of disequilibrium will lead to the temperature being less than the concentration since the temperature field diffuses faster than the solute field. In order to restore equilibrium, freezing will then occur, which will raise the temperature due to effects of latent heating and lower the dimensionless concentration due to the difference in concentration between the solid and liquid. This is consistent with (5.2), which shows that in regions with negative
  ${\partial ^{2} \theta }/{\partial z^{2}}$, near
  $\theta$ maxima, porosity will decrease since
  $A_{2,2}$ will always be positive. In sector 2 in figure 2(a), where
  $\theta$ is near a minimum, all of the above phenomena will be reversed and we expect that melting will occur. For a diffusion-dominated system,
  $A_{1,2}$ and
  $A_{2,2}$ will be much greater than
  $A_{1,1}$ and
  $A_{2,1}$. Examining equation (5.13), we can see that under such circumstances, we expect that the porosity will be in phase with the temperature field.

Figure 2. The temperature and compositional fields are shown when there is a small degree of disequilibrium for the cases of (a) diffusion-dominated transport and (b) advection-dominated transport. Curves are divided into sectors where melting and freezing are occuring.
An advection-dominated system is shown in figure 2(b), where a perturbation is being advected to the right (positive  $w_{D}$). If there is a slight degree of disequilibrium, the concentration field will lead the thermal field due to differences in the advection rates. If a warm fluid is moving into a cold one,
  ${\partial \theta }/{\partial z} <0$ (region 1 in figure 2b), then freezing must occur in order to raise the temperature by latent heating and decrease the concentration. This is again consistent with (5.2) since
  $A_{1,1} < 0$ when
  $w_{D}$ is positive. In region 2 in figure 2(b), where cold fluid is invading a hot fluid, melting will occur. For an advection-dominated system,
  $A_{1,1}$ and
  $A_{2,1}$ are much greater in magnitude than
  $A_{1,2}$ and
  $A_{2,2}$, and since
  $A_{1,1}$ is negative, (5.13) shows that porosity will be 180
 $^{\circ }$ out of phase with the temperature perturbation. For intermediate
  ${{Pe}}$ where transport is a mixture of diffusion and advection, porosity will have an intermediate phase relative to the temperature perturbation. From (5.13) we can also see that, similar to
  $\theta$, diffusion will cause the porosity anomaly to decay with time scale
  $\tau = H^2/(4 {\rm \pi}^{2} A_{1,2})$.
5.1. Passive porous layers
We can recover the continuum-scale equations for a passive porous layer by setting  ${\partial \phi }/{\partial t}=0$ in (4.1) and (4.2), and the liquidus relation no longer applies.
Sinusoidal initial temperature and concentration variations in a domain of infinite height or in a periodic domain of height  $H$ will then evolve according to
 \begin{equation} \theta{(z,t)}= \sin\left[2 {\rm \pi}/H\left(z - \frac{w_{D}}{\overline{\rho c_{p}}} t\right)\right] \exp\left({-\frac{4 {\rm \pi}^2\bar{k} t}{\overline{\rho c_{p}} {{Pe}}_{c} H^{2}}}\right) \end{equation}
and
 \begin{equation} c{(z,t)}= \sin\left[2 {\rm \pi}/H\left(z - \frac{w_{D}}{\phi}t\right)\right] \exp\left({-\frac{4 {\rm \pi}^{2} \epsilon t}{{{Pe}}_{c} H^{2}} }\right). \end{equation}
From these expressions we can see that the thermal field will be transported at the thermal velocity  $w_{T}=w_{D}/\overline {\rho c_{p}}$ and diffusion will cause a decay with time scale
  $\tau _{th}={{Pe}}_c \overline {\rho c_p} H^{2}/(4 {\rm \pi}^{2} \bar {k})$, while solute will be transported at the pore speed
  $w_{c}=w_{D}/\phi$ and decay with time scale
  $\tau _{c}={{Pe}} H^{2}/(4 {\rm \pi}^{2} \epsilon )$. Note that in the results above, it is still assumed that concentration and temperature are constant in the
  $r$ direction, and so the time scale for lateral diffusion is assumed to be small compared with the time scale for the advection in the axial direction.
In passive porous layers, radial variations in solute and temperature are caused by mechanical dispersion – by radial variations in the transport rate of the background variation in these quantities with height. Our simulations start with solute and temperature fields that do not vary with radius. Since the velocity in the liquid region decreases with  $r$, a phase difference between the concentration and temperature fields at
  $r=0$ and
  $r=1$ will be created by advection, which we will represent by
  $\beta _{c}$ and
  $\beta _{\theta }$. The size of the advection-driven radial concentration difference will be proportional to the inverse of the axial length scale over which the concentration is changing,
  $1/H$. This will result in radial diffusion which can balance the axial advective flux for low
  ${{Pe}}_h/\epsilon$. A steady-state phase difference between the concentration profile at
  $r=0$ and
  $r=1$ will result.
For large  ${{Pe}}_h /\epsilon$, radial diffusion cannot balance axial advection and the phase difference between the concentration at
  $r=0$ and
  $r=1$ will vary continuously with time. For sufficiently large
  ${{Pe}}_h/\epsilon$, effects of diffusion are negligible and we can use the method of characteristics to calculate the concentration or temperature fields starting with a sinusoidal initial condition and velocity profile (3.1):
 \begin{equation} c({r,z,t}) = \sin\left[k(z-t+r^{2}t)\right]. \end{equation}
We can calculate the profile of the radially averaged concentration,  $\bar {c}$, with height, which gives
 \begin{equation} \bar{c}(z,{t})=\frac{2 {\rm \pi}\int_{0}^{1} \sin\left[k(z-t+r^{2}t)\right] r \,{\rm d}r}{2 {\rm \pi}\int_{0}^{1} r \,{\rm d}r} = 2 \frac{\sin\left[k\left(z-\dfrac{t}{2}\right)\right] \sin\left(\dfrac{k t}{2}\right)}{k t}. \end{equation}
From this expression, it can be seen that a sinusoidal concentration perturbation will travel with speed equal to the pore velocity  $w_c$, which is half of the fluid velocity at the pore centre for this geometry. The terms causing the oscillation of the amplitude and its decrease with time are the result of the effects of mechanical dispersion. We can also see that the effects of mechanical dispersion will be greater for disturbances at shorter length scales.
5.2. Parameter values
For ideal mushy systems, equilibration by diffusion must occur rapidly in the radial directions compared with rates of transport in the axial direction. In order to achieve such a separation of time scales, the dimensionless length of the tube,  $H$, which also sets the length scale for variations in temperature and concentration in the axial direction, must be large compared with unity (the dimensionless pore radius). We thus used
  $H=200$ for many of the simulations and
  $H=1000$ for some of the simulations at higher
  ${{Pe}}$.
The dimensionless parameters characterizing the mushy layers were set based on the properties of aqueous NH $_{4}$Cl and KNO
 $_3$, which are salts commonly used in mushy layer experiments. Table 2 is obtained from dimensional parameters presented in Butler (Reference Butler2011), Peppin, Huppert & Worster (Reference Peppin, Huppert and Worster2008) and Hallworth, Huppert & Woods (Reference Hallworth, Huppert and Woods2005), assuming
  $\Delta T =36\,^{\circ }{\rm C}$ and
  $\Delta C =0.07$ (mass fraction) for NH
 $_{4}$Cl and
  $\Delta T =10\,^{\circ }{\rm C}$ and
  $\Delta C =0.22$ for KNO
 $_3$. Here, all of the material properties have been scaled by the values for the liquid so that
  $\rho _s^{\prime }= \rho _s/\rho _l$,
  $c_{ps}^{\prime }= c_{ps}/c_{pl}$ and
  $k_s^{\prime }= k_s/k_l$. Also, all material properties are assumed to be independent of temperature and concentration. Thus, the effective thermal conductivity and heat capacity in a representative volume are
  $\bar {k}= k_s (1-\phi _0)+\phi _0$ and
  $\overline {\rho c_p}= \rho _s c_{ps} (1-\phi _0)+\phi _0$, respectively. We took the ratio of solute to thermal diffusivity to be 0.01. The initial porosity for the KNO
 $_3$ simulations was taken to be 0.56, similar to the experiments of Hallworth et al. (Reference Hallworth, Huppert and Woods2005), while
  $\phi _{0}$ for the NH
 $_4$Cl simulations was taken to be 0.5 for simplicity.
Table 2. Dimensionless parameters derived from Butler (Reference Butler2011).

5.3. Estimates of errors due to model approximations
If the densities of the solid and fluid are not equal, melting or solidification will drive a radial flow  $u_{\rho }$ given by
  $u_{\rho }=(1-\rho _s) ({\partial \tilde {R}_1}/{\partial t})$ (Glicksman, Coriell & McFadden Reference Glicksman, Coriell and McFadden1986; Worster & Batchelor Reference Worster and Batchelor2000). However, we are assuming a constant, axial flow. We can use the approximate solutions of § 5 to estimate the magnitude of this neglected radial velocity.
From (2.10) we can show that
 \begin{equation} \frac{\partial \tilde{R}_{1}}{\partial t} = \frac{1}{2 \sqrt{\phi \phi_0}} \frac{\partial \phi}{\partial t} \approx \frac{1}{2\phi_0} \frac{\partial \phi}{\partial t}. \end{equation}
We can further use (5.2) to obtain
 \begin{align} u_{\rho}&=(1-\rho_s)
\frac{\partial \tilde{R}_{1}}{\partial t} \approx
\frac{(1-\rho_s)}{2\phi_0} \left(A_{2,1}\frac{\partial
\theta}{\partial z}+A_{2,2} \frac{\partial^2
\theta}{\partial z^2} \right)\nonumber\\
&\approx \frac{(1-\rho_s)}{2\phi_0} \left(A_{2,1} \frac{2 {\rm \pi}\Delta
\theta}{H} +A_{2,2} \frac{4 {\rm \pi}^2 \Delta
\theta}{H^2}\right).
\end{align}
\begin{align} u_{\rho}&=(1-\rho_s)
\frac{\partial \tilde{R}_{1}}{\partial t} \approx
\frac{(1-\rho_s)}{2\phi_0} \left(A_{2,1}\frac{\partial
\theta}{\partial z}+A_{2,2} \frac{\partial^2
\theta}{\partial z^2} \right)\nonumber\\
&\approx \frac{(1-\rho_s)}{2\phi_0} \left(A_{2,1} \frac{2 {\rm \pi}\Delta
\theta}{H} +A_{2,2} \frac{4 {\rm \pi}^2 \Delta
\theta}{H^2}\right).
\end{align}
Substituting in values from table 2 over the range of  ${{Pe}}_c$ used, we get values of
  $u_{\rho }$ of at most
  $10^{-3}$ for both NH
 $_4$Cl and KNO
 $_3$ parameters, much less than unity (the dimensionless velocity on the midline).
Additionally, (3.12) and (3.14) are formulated assuming a solid–liquid boundary that does not vary with  $z$. For a mobile boundary, there will be a component of the normal to the boundary that for small variations would be proportional to
  ${\partial \tilde {R} }/{\partial z} \approx (\tfrac{1}{2}\phi _0) ({\partial \phi }/{\partial z}) \approx {{\rm \pi} \Delta \phi }/{H}$. Using the maximum value of
  $\Delta \phi$ from our simulations, we find that
  ${\partial \tilde {R}}/{\partial z}$ is at most
  $10^{-3}$ while the radial component of the normal is similar to 1.
The change in domain geometry resulting from a change in  $\tilde {R}_1$ will result in a change in the axial flow field (3.1). The leading-order effect of changing
  $\tilde {R}_1$ will be to increase the flow velocity in regions where
  $\tilde {R}_1$ is decreased and decrease the velocity where
  $\tilde {R}_1$ is increased in order to conserve mass. Conserving mass, the change in axial velocity
  $\Delta w$ along the midline can be shown to be
 \begin{equation} \Delta w \approx{-}2 (\Delta \phi/\phi_0). \end{equation}
The largest  $\Delta \phi /\phi _0$ in our simulations is 0.06, giving a difference in velocity of less than 12 %. Assuming an incompressible flow, we can estimate that the radial velocity field
  $u$ will go like
  $u \approx \Delta w/H$. Given the large values of
  $H$ that we use, we can then expect the radial velocity to be very small compared with the background flow field, and the flow field is well approximated by purely axial flow.
5.4. Numerical model description
For the pore-scale model, (3.8), (3.9) and (3.10) were solved in a domain shown in figure 1 using the finite element method as implemented in the commercial software modelling package COMSOL Multiphysics (COMSOL 2022) subject to boundary conditions (3.11), (3.12), (3.13) and (3.14). The ordinary differential equation (ODE) (3.15) was solved along the boundary between the liquid and solid, and  $R_{1}(z)$ was used to track the evolution of the degree of melting and freezing. However, the geometry of the numerical domain does not change with time and nor does the velocity profile, so we are making the approximation that changes in
  $\phi$ are sufficiently small that they would not significantly change the flow or the transport of heat and solute. Boundary conditions at
  $z=0$ and
  $z=H$ were taken to be periodic for all of the fields. Axisymmetry was imposed along
  $r=0$ and so the radial derivatives of concentration and temperature were required to vanish there.
The initial condition for all of the models was
 \begin{equation} \theta(r,z)=c(r,z)=\sin\left(\frac{2 {\rm \pi}z}{H}\right) \end{equation}
in both the liquid and the solid regions, while the initial condition for  $R_{1}$ was set using (5.13). We assume symmetry with rotation about the cylinder axis and so we solve the problem in cylindrical axisymmetric geometry. Note that the initial condition does not depend on
  $r$ and so corresponds to a solution for an ideal mushy layer. Note also that (3.8)–(3.15) and (4.1)–(4.3) are nonlinear and so the solution may not remain sinusoidal after some time evolution. However, for the NH
 $_4$Cl and KNO
 $_3$ parameters that we investigate,
  $\mathcal {C}$ is significantly greater than
  $\theta$ and
  $\phi$ does not change by large amounts compared with
  $\phi _0$, so the equations are close to linear and the solutions remain close to sinusoidal. For the analytical solutions to (5.1) and (5.2) we are assuming that the system is fully linear. We investigate sinusoidal disturbances in a periodic medium because it allows us to study cases in which the length scale over which gradients of the temperature and concentration occur,
  $H$, are large compared with the pore size
  $R_1$. For the fully linear system, thermal and solutal disturbances of arbitrary shape could be investigated by superposing sinusoidal solutions of various wavelengths.
Triangular elements were used to create the finite element mesh, while Lagrange shape functions were used for the heat and concentration equations and discontinuous Lagrange shape functions were used to solve the boundary ODE. The direct solver MUMPS (Amestoy, Duff & L'excellent Reference Amestoy, Duff and L'excellent2000) was used to solve the large sparse systems arising from the simulation. Simulations typically used around 300 000 elements and took 10 min to run.
For the one-dimensional ideal mushy model, (4.1) and (4.2) were solved on a one-dimensional domain of length  $H$ and coupled with ODE (4.3). These equations were also solved using the finite element method in COMSOL Multphysics. The initial conditions used were the same as those for the pore-scale model. Again, Lagrange elements were used for the shape functions for the thermal and compositional evolution equations while discontinuous Lagrange shape functions were used for the ODE.
6. Passive porous medium results
We can simulate a passive porous medium for our pore-scale model by specifying that  $B=0$. In figure 3(a), profiles of the radial average over the liquid and solid are shown for the temperature, while the radial average over the liquid is shown for the composition from our pore-scale numerical simulation run with
  ${{Pe}}=0.002$,
  $H=200$ and the properties of NH
 $_{4}$Cl. For these parameters, the continuum-scale Péclet number is 0.1 and so we expect that axial diffusion will be greater than advection. The results are shown at
  $t=\tau _{th}=0.74$, and the initial condition consisted of a sine curve of unit amplitude. As can be seen, the shape of the disturbance has been preserved; however, the thermal disturbance has decayed to
  ${\rm e}^{-1}$ of its original amplitude. Because
  $\epsilon \ll 1$, the time scale for decay of the composition is very long compared with that for temperature and so the composition field has remained essentially unchanged from the initial condition. The numerical model result is compared with the predictions of (5.14) (analytical
  $\theta$) and the agreement is excellent. The results for the concentration were also compared with the predictions of (5.15); however, these were always visually almost identical to the one-dimensional numerical model solutions so they have been neglected. The agreement of the two-dimensional model with the one-dimensional models indicates that the liquid and solid were laterally thermally equilibrated.

Figure 3. Concentration and temperature averaged radially over the fluid region (mean $_{liq}$) as well as the temperature radially averaged over the fluid and solid region (mean
 $_{tot}$) from the two-dimensional model from a simulation with NH
 $_{4}$Cl properties and
  $H=200$. The values are compared with predictions from (5.14) and (5.17) as well as with the predictions of the one-dimensional model. (a) Péclet number
  ${{Pe}}=0.002$,
  ${{Pe}}_c=0.1$ and
  $t = \tau_{\textit{th}}$; the temperature curves and the concentration curves are all overlapping. (b) Péclet number
  ${{Pe}}=0.2$,
  ${{Pe}}_c=10$ and
  $t=\tau _{th}$. (c) Péclet number
  ${{Pe}}=20$ and
  ${{Pe}}_c=1000$; the time is 0.75
 $H$ or the time that it would take a fluid parcel at the centre of the cylinder to travel 0.75 of the length of the domain. (d) Péclet number
  ${{Pe}}=200$,
  ${{Pe}}_c=10\,000$ and
  $t=0.75 H$.
In figure 3(b), similar calculations are shown for a case with  ${{Pe}}=0.2$ and
  ${{Pe}}_{c}=10$. The effects of axial advection will now be greater than the effects of axial diffusion. The results are shown at time
  $t=\tau _{th}=74$. While
  $\theta$ has again decayed in amplitude to
  ${\rm e}^{-1}$ and
  $c$ has essentially maintained its initial amplitude, the profiles have been shifted by the effects of advection. The concentration profile has moved farther than the temperature profile, showing the effects of thermal retardation caused by the equilibration of the temperature in the liquid with that in the solid. In order to characterize the degree of variation in the radial direction of the concentration field, the phase difference between profiles at
  $r=0$ and
  $r=1$ was calculated. For this simulation, the phase difference was found to be 0.04 rad, indicating only a small radial variation in concentration.
The averaged concentration profiles maintain an amplitude that is considerably greater than the prediction of (5.17), indicating that mechanical dispersion was not causing a significant decrease in the amplitude for these cases because of the high degree of radial homogeneity due to diffusion.
A case where the Péclet number is 20 at the pore scale is shown in figure 3(c). The solution is shown at the time needed for fluid at the centreline velocity to transit three-quarters of the domain ( $t=150$). The concentration is again shifted relative to the temperature due to the effects of thermal retardation. It can also be seen that the profile of the concentration for the two-dimensional model has significantly lower amplitude than the profiles from the one-dimensional model. This reduction in amplitude is caused by the effects of mechanical dispersion, and the amplitude of the concentration profile is tending towards the prediction of (5.17). The temperature in the two-dimensional model both averaged over only the fluid domain and averaged over the entire domain remains similar to that of the analytical solutions assuming perfect lateral equilibration, indicating that the temperature remains well equilibrated laterally. The reduction in amplitude of the concentration profile by mechanical dispersion indicates that it is not well equilibrated radially. The phase difference between the concentration profiles at
  $r=0$ and
  $r=1$ did not converge to a steady value, while for temperature profiles the phase difference was 0.07.
In figure 3(d), solutions are shown for  ${{Pe}}=200$ again at the time when fluid at the centre has travelled three-quarters of the length of the column (
 $t=150$). The concentration has once again moved ahead of the temperature, and it can be seen that the average concentration from the two-dimensional model differs significantly in amplitude from that of the one-dimensional model but now is in very good agreement with the pure advection solution (5.17). The temperature, averaged over both the liquid and the solid and only over the liquid, is significantly reduced in amplitude compared with the one-dimensional and equilibrated analytical solutions, indicating that mechanical dispersion is now significant for the temperature field as well. The phase difference between temperature profiles plotted along
  $r=0$ and
  $r=1$ was steady and had value 0.7, while again the phase difference for the concentration profiles did not converge to a steady state. It can also be seen that the temperature, when averaged only over the liquid, is slightly leading the temperature averaged over the liquid and solid. This indicates imperfect thermal equilibration between the solid and liquid at these high flow velocities.
Figure 4(a) shows snapshots of the concentration field for the values of  ${{Pe}}_h/\epsilon$ shown in a domain of height 200 for NH
 $_4$Cl parameters. The simulations had been run to time 1000 so the disturbance had passed through the domain many times. Note the very large difference in scale between the horizontal and vertical axes. For simulations with
  ${{Pe}}_h/\epsilon$ values of 0.5, lateral diffusion results in almost constant concentration with radius. The concentration field along the midline leads the field at
  $r=1$ by only a small amount (
 $\beta _c=0.2$ rad). When
  ${{Pe}}_h/\epsilon =3$, the shearing of the concentration field by the flow has become more significant (
 $\beta _c=1.2$ rad). However,
  $\beta _c$ still reaches a steady-state value. The phase difference between the inside and outside is sufficient to reduce the amplitude of the radially averaged concentration profile, however. For the two larger values of
  ${{Pe}}_h/\epsilon$ shown, lateral diffusion is unable to establish a concentration field that is steady in a reference frame moving with the flow, and so
  $\beta _c$ is not well defined. The shearing of the concentration field results in a radially averaged profile that decreases in amplitude in time but also oscillates as the inner and outer radii fields go in and out of phase.

Figure 4. (a) The concentration field for the values of  ${{Pe}}_h/\epsilon$ indicated at time 1000 (time for five transits of the domain) for simulations run with NH
 $_4$Cl parameters. (b) The phase difference between the concentration on the cylinder midline and that along the solid boundary (
 $\beta _c$, blue ‘+’ symbols) plotted against
  ${{Pe}}_h /\epsilon$ (blue left-hand vertical axis and lower horizontal axis) and the similar phase difference for the temperature (black circles) plotted against
  ${{Pe}}_h$ (black right-hand vertical axis and top horizontal axis).
Many simulations were run with  $B=0$ for various values of
  ${{Pe}}$,
  $H$ and
  $\epsilon$. We plot the steady-state difference in phase of a profile in concentration along the midline relative to that at the solid wall with
  ${{Pe}}_h/\epsilon$ in figure 4(b). For
  ${{Pe}}_h/\epsilon <4$,
  $\beta _c$ goes to a steady state. Results shown in figure 4 were run with
  ${{Pe}}$ varying from 0.2 to 4.2,
  $H$ varying from 100 to 400 and
  $\epsilon$ varying from 0.005 to 0.01, and all results collapse reasonably well onto the line
  $\beta _c=0.42 {{Pe}}_h /\epsilon$. For these steady-state cases, the concentration field becomes constant in a reference frame moving with axial speed
  $w_{c}$ relative to the cylinder. As
  $\beta _{c}$ increases, the amplitude of the radially averaged concentration decreases and so the amplitude is lower than the predictions of the ideal one-dimensional model and (5.15). When
  ${{Pe}}_h/\epsilon > 4$, the predicted phase difference becomes a significant fraction of
  ${\rm \pi}$. Once the concentration perturbations along the inner and outer radii are almost completely out of phase, it becomes impossible for diffusion to create a steady state. The results shown in figure 3(a,b) were in the regime of a steady
  $\beta _{c}$ and
  $\beta _{c} \ll {\rm \pi}$ and so the approximation that the solutions were constant in the radial direction was reasonable. The results shown in figure 3(c,d) were both in the unsteady regime, with the latter approaching a state where radial diffusion was negligible.
Similarly, for NH $_{4}$Cl parameters, the phase difference between temperature profiles plotted along
  $r=0$ and
  $r=1$ was found to obey
  $\beta _{\theta }=0.69 {{Pe}}_h$ when
  ${{Pe}}_h < 4$ (figure 4). These phase differences were smaller than those for the concentration field owing to the much higher thermal diffusivity. For the results shown in figure 3(d),
  $\beta _{\theta }=0.7$ and was steady. In all other calculations,
  $\beta _{\theta }$ was very small and the temperature field was very close to constant in the radial direction. Unlike
  $\beta _c$,
  $\beta _{\theta }$ varied with
  $\phi _{0}$,
  $\rho _{s}$ and
  $c_{ps}$, as would be expected since these parameters affect the thermal retardation. Similar scaling behaviours for
  $\beta _c$ and
  $\beta _{\theta }$ were found for KNO
 $_3$ parameters.
To summarize the passive porous layer results, we have shown that for  ${{Pe}}_c < 1$ (axial diffusion greater than axial advection), the temperature perturbation decays faster than the concentration perturbation, leading to the prediction that porosity will be in phase with the thermal and solutal disturbances in mushy layers. For
  ${{Pe}}_c > 1$, solute perturbations are transported faster than thermal ones, leading to the prediction of porosity being out of phase with the thermal disturbance in mushy layers. The radial equilibration of the temperature and solute fields is determined by
  ${{Pe}}_h$ and
  ${{Pe}}_h/\epsilon$. For
  ${{Pe}}_h/\epsilon$ less than approximately 4, the concentration field reaches a steady state in a reference frame moving with the pore velocity. For larger values of
  ${{Pe}}_h/\epsilon$, the concentration field is continuously sheared by the background flow and does not reach a steady state. Because thermal diffusivity is much greater than solute diffusivity, the temperature field remains laterally equilibrated to much higher values of
  ${{Pe}}$. We thus expect that for systems in which solidification and melting are taking place at the solid–liquid boundary,
  ${{Pe}}_h/\epsilon$ will determine whether the liquid and solid remain in thermodynamic equilibrium with a critical value of order unity. For our simple system consisting only of straight tubes, this value
  ${{Pe}}_h/\epsilon$ also determines when effects of mechanical dispersion become significant.
7. Mushy layer results
Figure 5(a,b) shows the temperature and composition profiles at the time for thermal disturbances in an ideal mushy layer to decay by  ${\rm e}^{-1}$,
  $t=\tau\!$, for a simulation with
  ${{Pe}}=0.002$ for NH
 $_4$Cl properties and
  $Pe = 0.0018$ for KNO
 $_3$ properties (
 ${{Pe}}_c=0.1$ for both) and with
  $B=10^4$ and
  $H=200$. Note that
  $\tau =0.74$ for NH
 $_4$Cl, while it is 1.1 for KNO
 $_{3}$ because of the different material properties. At these low
  ${{Pe}}$ values, diffusion is dominant at both the pore and the system scales. Also shown are points labelled
  $w_{c}$,
  $u_T$ and
  $w_{eff}$, which are plotted at
  $z=w_c \tau\!$,
  $u_T \tau$ and
  $w_{eff} \tau\!$, respectively. These give the predicted position of the rising zero-crossing of the temperature and concentration curves if these were travelling at the speed of the solute in a passive porous layer, the speed of the temperature field in a passive porous layer or the effective advection speed in a mushy layer, respectively. At this low
  ${{Pe}}$, these points have not moved appreciably from 0. In general, there is good agreement between all of the model predictions, indicating that the conditions for an ideal mushy layer are essentially met, as would be expected for such low
  ${{Pe}}$, and that effective diffusivity calculated from (5.4) is correctly calculating the effective diffusivities for both of these aqueous systems. However, it can be seen that the amplitudes of the predictions of (5.10) (analytical
  $\theta$) are slightly lower than those of the other models. This indicates some error due to the assumption of constant
  $A_{1,1}$ and
  $A_{1,2}$. There is also a small difference between the averaged temperature and averaged composition in the pore-scale model, indicating that even at this very small
  ${{Pe}}$ there is some degree of disequilibrium due to finite radial diffusion.

Figure 5. (a,b) Concentration and temperature averaged over the fluid region (mean $_{liq}$) as well as the temperature averaged over the fluid and solid regions (mean
 $_{tot}$) from the two-dimensional model for
  ${{Pe}}_c=0.1$ and
  $H=200$ compared with predictions from (5.10) (analytical) and the one-dimensional model for (a) NH
 $_4$Cl and (b) KNO
 $_3$. Markers for
  $w_c$,
  $w_{T}$ and
  $w_{eff}$ indicate the predicted position of a rising zero-crossing for a sinusoid moving at these velocities. (c,d) Porosity,
  $\phi$, for the two-dimensional model compared with predictions from (5.13) (analytical) and predictions of the one-dimensional model for (c) NH
 $_4$Cl and (d) KNO
 $_3$. For all plots,
  $t=\tau\!$.
In figure 5(c,d), porosity profiles are shown. We have also included a plot of the porosity at  $t=0$ for comparison. The amplitude of the porosity perturbation has clearly decayed for both aqueous systems to a degree that is predicted well by (5.13) (analytical). There are small differences between all of the solutions, indicating both a small degree of disequilibrium and some effects of non-constant coefficients in (5.2). For both NH
 $_4$Cl and KNO
 $_3$ the porosity and temperature perturbations are well correlated, as is predicted by (5.13) for a purely diffusive ideal mushy system.
Similar results are shown for a case that is dominantly advective at the system scale ( ${{Pe}}=0.2$ for NH
 $_4$Cl parameters,
  ${{Pe}}=0.18$ for KNO
 $_3$ parameters and
  ${{Pe}}_{c}=10$ for both) in figure 6. The time is again
  $t=\tau$, which corresponds to
  $t=74$ for NH
 $_4$Cl and 108 for KNO
 $_3$. The porosity, temperature and concentration fields have again decayed in amplitude, but at this
  ${{Pe}}_{c}$ they have been shifted appreciably by the effects of advection. Note that for both the NH
 $_{4}$Cl case and the KNO
 $_3$ case, the position of the rising zero-crossing is well predicted by
  $w_{eff}$. The KNO
 $_3$ perturbation has been transported by advection farther than the NH
 $_4$Cl case, due mostly to the longer time that the model has been run. Also, because
  $S /\mathcal {C}$ is greater for KNO
 $_{3}$ than it is for NH
 $_4$Cl,
  $w_{eff}$ is slightly closer to
  $w_{c}$. In figure 6(c,d), we can see that porosity has been both reduced in amplitude compared with its initial value and shifted in position because of the effects of advection. All of the models agree reasonably well, indicating again that (5.13) predicts the melting and freezing caused by the transport of the temperature anomaly and that the system is close to an ideal mushy layer. Additionally, the differences in phase for profiles of concentration and temperature at
  $r=0$ and
  $r=1$ for the NH
 $_{4}$Cl case were
  $\beta _c=0.07$ and
  $\beta _{\theta }=0.0006$ rad, also indicating that concentration and temperature were almost constant in the radial direction. As predicted by (5.13), when diffusion and advection are of similar magnitude, the phase of the porosity will be between 0
 $^{\circ }$ and 180
 $^{\circ }$, and as can be seen in this case, it is close to 90
 $^{\circ }$.

Figure 6. (a,b) Concentration and temperature averaged over the fluid region (mean $_{liq}$) as well as the temperature averaged over the fluid and solid regions (mean
 $_{tot}$) from the two-dimensional model for
  ${{Pe}}_c=10$ and
  $H=200$ compared with predictions from (5.10) (analytical) and the one-dimensional model for (a) NH
 $_4$Cl and (b) KNO
 $_3$. Markers for
  $w_c$,
  $w_{T}$ and
  $w_{eff}$ indicate the predicted position of a rising zero-crossing for a sinusoid moving at these velocities. (c,d) Porosity,
  $\phi$, for the two-dimensional model compared with predictions from (5.13) (analytical) and predictions of the one-dimensional model for (c) NH
 $_4$Cl and (d) KNO
 $_3$. For all plots,
  $t=\tau\!$.
Temperature and concentration profiles are shown for a simulation with  ${{Pe}}=0.4$ (NH
 $_4$Cl parameters),
  ${{Pe}}=0.36$ (KNO
 $_3$ parameters) and
  ${{Pe}}_{c}=100$ (both), where advection strongly dominates at the system scale, in figure 7(a,b). The system size,
  $H$, was increased for this calculation in order to remain close to radial equilibrium but also allow for a system where advection is dominant at the system scale. Here, the solution is shown at the time needed for fluid at the centreline velocity to transit three-quarters of the domain. Again, the temperature and concentration profiles are very similar for the pore-scale model, ideal mushy model and (5.10), indicating that this equation, based on ideal mushy layer theory, is accurately predicting the effective diffusion and advection rates. Although the system is mostly advective at the system scale, the temperature and concentration have decayed from their initial amplitude of 1 due to effects of diffusion. In accord with the radially averaged temperature and concentration profiles agreeing with the predictions of ideal mushy layer theory, the phase differences between profiles of concentration and temperature at
  $r=0$ and
  $r=1$ were
  $\beta _c=0.027$ and
  $\beta _{\theta }=0.00027$ rad, indicating very small radial variations in concentration and temperature.

Figure 7. (a,b) Concentration and temperature averaged over the fluid region (mean $_{liq}$) as well as the temperature averaged over the fluid and solid regions (mean
 $_{tot}$) from the two-dimensional model for
  ${{Pe}}_c=100$ and
  $H=1000$ compared with predictions from (5.10) (analytical) and the one-dimensional model for(a) NH
 $_4$Cl and (b) KNO
 $_3$. Markers for
  $w_c$,
  $w_{T}$ and
  $w_{eff}$ indicate the predicted position of a rising zero-crossing for a sinusoid moving at these velocities. (c,d) Porosity,
  $\phi$, for the two-dimensional model compared with predictions from (5.13) (analytical) and predictions of the one-dimensional model for (c) NH
 $_4$Cl and(d) KNO
 $_3$. For all plots,
  $t=0.75H$.
Figure 7(c,d) shows that the phase of the porosity has been shifted relative to its original position by the advection of the thermal and compositional perturbation. For both the KNO $_3$ and the NH
 $_4$Cl simulations, the porosity profile from the pore-scale model is in good agreement with the predictions of ideal mushy theory, indicating good lateral equilibration at the pore scale. The porosity perturbation can be seen to be close to 180
 $^{\circ }$ out of phase with the temperature perturbation, as predicted by (5.13) for a system that is dominantly advective at the system scale.
An extreme case where  ${{Pe}}=40$ (NH
 $_4$Cl parameters),
  ${{Pe}}=35.7$ (KNO
 $_3$ parameters) and
  ${{Pe}}_{c}=10\,000$ (both) is shown in figure 8. The solutions are shown at the time that it would take a fluid parcel at the centre of the cylinder to travel 0.75 of the length of the domain of length
  $H=1000$. For both aqueous systems, the concentration and temperature of the pore-scale model differ significantly while they remain the same for the ideal mushy models. This demonstrates that effects of lateral diffusion are no longer able to maintain thermodynamic equilibrium in the radial direction. The temperature in the pore-scale model is being advected at speed
  $u_T$ while the concentration profile is being advected considerably faster and is approaching speed
  $w_c$. The amplitudes of the temperature and especially the concentration profiles can also be seen to be reduced from their initial values due to the effects of mechanical dispersion that are not included in the ideal mushy formulation. The temperature profiles averaged over the liquid region only and over the entire volume remain essentially the same, however, indicating that this fluid velocity is not high enough to cause a solid–liquid thermal disequilibrium.

Figure 8. (a,b) Concentration and temperature averaged over the fluid region (mean $_{liq}$) as well as the temperature averaged over the fluid and solid regions (mean
 $_{tot}$) from the two-dimensional model for
  ${Pe_c=10\,000}$ and
  $H=1000$ compared with predictions from (5.10) (analytical) and the one-dimensional model for (a) NH
 $_4$Cl and (b) KNO
 $_3$. Markers for
  $w_c$,
  $w_{T}$ and
  $w_{eff}$ indicate the predicted position of a rising zero-crossing for a sinusoid moving at these velocities. (c,d) Porosity,
  $\phi$, for the two-dimensional model compared with predictions from (5.13) (analytical) and predictions of the one-dimensional model for (c) NH
 $_4$Cl and (d) KNO
 $_3$. For all plots,
  $t=0.75H$.
In figure 9(a) the concentration and temperature fields in the liquid region are shown for the same time and simulations as the profiles plotted in figure 8 for the NH $_4$Cl case. Note the very different scales on the two axes. The temperature and concentration at
  $r=1$ are identical because of the liquidus constraint at this boundary. However, the high thermal diffusivity results in the temperature field being constant in the radial direction, while the concentration field has been sheared by the variation in flow velocity with radius. At this Péclet number, the shearing continued and
  $\beta _c$ did not reach a steady value, while
  $\beta _{\theta }$ did reach a steady value of 0.028 rad.

Figure 9. (a) The concentration field and temperature for a simulation with  ${{Pe}}=40$ and
  $H=1000$ at the time for a fluid packet at the midline to travel three-quarters of the length of the domain. The simulation used NH
 $_4$Cl parameters. (b) Steady-state phase difference in the concentration field at the inner and outer boundary for the concentration field (blue symbols and lower and left-hand axes) and temperature field (black symbols and upper and right-hand axes). The solid lines are fits to the data with slopes 0.64 and 0.7.
In figure 8(c,d) the porosity is compared with the predictions from (5.13) and the one-dimensional model. The porosity in the two-dimensional model differs significantly from the ideal mushy layer prediction and the porosity profile has decreased significantly in amplitude and has moved slightly in the opposite sense to the background flow. The porosity from the ideal mushy models is close to 180 $^{\circ }$ out of phase with the temperature, while the pore-scale model differs significantly due to non-ideal effects.
Simulations were run with varying values of  ${{Pe}}$,
  $H$ and
  $\epsilon$. Results are shown for the NH
 $_4$Cl simulations in figure 9(b). Up to
  ${{Pe}}_h /\epsilon \approx 2$,
  $\beta _c \approx 0.64 {{Pe}}_h/\epsilon$. Above approximately
  ${{Pe}}_h/\epsilon =2$,
  $\beta _c$ did not reach a steady state. In these cases, the concentration field continued to be sheared by the background flow. Because of the small value of
  $\epsilon$,
  $\beta _{\theta }$ did reach a steady state in all of our simulations and went roughly like
  $0.7 {{Pe}}_h$. The KNO
 $_3$ simulations (not shown) behaved similarly, with
  $\beta _c \approx 0.5 {{Pe}}_h/\epsilon$ and
  $\beta _{\theta } \approx 0.55 {{Pe}}_h$. In order for the temperature and concentration to remain roughly the same functions of
  $z$, it is required that
  $\beta _{c}-\beta _{\theta }$ be small. Since
  $\beta _{c} \gg \beta _{\theta }$, and taking 10
 $^{\circ }$ as a rough threshold value, we get that a condition for the concentration and temperature to remain close to the liquidus throughout the liquid is
  ${{Pe}}_h/{\epsilon } \lesssim 0.3$. Note that the slope of
  $\beta _c$ is significantly different from the
  $B=0$ case because of the mass exchange between the solid and liquid which acts in a way that is similar to thermal retardation.
8. Discussion and conclusions
We have presented a first attempt at modelling mushy layers at the pore scale – using separate sets of continuum equations for the fluid and solid regions for the highly simplified geometry of two concentric cylinders. Our pore-scale models are shown to be in excellent agreement with the predictions of governing equations whose derivation is based on the assumption of an ideal mushy layer – that the liquid and solid are in near perfect local thermodynamic equilibrium – provided that  ${{Pe}}_h/\epsilon < 0.3$. Kinetic effects, leading to lagging equilibrium at the pore walls, could further lead to non-ideal mushy behaviour. We leave investigation of these effects to a future study but note that kinetic effects can also be addressed using single-continuum approaches to mushy layer theory.
In addition to verifying ideal mushy layer theory for these lower-flow regimes, these calculations also serve as a test of the equations for effective combined solid and liquid properties such as heat capacity, thermal conductivity and solutal diffusivity, based on simple volume averages. The effects of mechanical dispersion are inherently included in pore-scale modelling, while they are typically parametrized as a velocity-dependent diffusivity or simply neglected in mushy layer theory. For  ${{Pe}}_h/\epsilon < 0.3$ we have shown that the neglect of mechanical dispersion does not lead to large errors. We note that this criterion for dispersion to become important is similar to the criterion of Taylor (Reference Taylor1953), who conducted experiments in straight tubes. It can be shown (Bear Reference Bear1972) that for dispersion in simple tubes, the dispersion coefficient goes like the velocity squared. However, experimental studies with real porous media show that the dispersion coefficient increases roughly linearly with velocity once
  ${{Pe}} >1$ (Delgado Reference Delgado2007). While our simple study gives a criterion for the maintenance of local thermodynamic equilibrium and hence the applicability of ideal mushy theory, real mushy systems with branching pore networks and variable pore sizes will probably have hydrodynamic dispersion that behaves more like that in passive porous layers.
As an application to a real mushy system, we consider the case of sea-ice whose characteristic pore size (approximating  $R_1$) is in the range of
  $10^{-3}\unicode{x2013}10^{-4}\,{\rm m}$ (Maus, Schneebeli & Wiegmann Reference Maus, Schneebeli and Wiegmann2021). We take thermal and compositional gradients to occur over a typical ice thickness of 0.1 m (approximating a dimensional
  $H$) and further use a solute diffusivity of
  $D=10^{-8}\,{\rm m}^2\,{\rm s}^{-1}$. Niedrauer & Martin (Reference Niedrauer and Martin1979) gave a maximum velocity of brine flow in their experiments of
  $2.5 \times 10^{-4}\,{\rm m}^2\,{\rm s}^{-1}$. Combining terms, this gives a maximum
  ${{Pe}}_h/\epsilon =0.25$, indicating that the fastest-flowing brine plumes may be only marginally in the ideal mushy regime in sea-ice.
For the KNO $_3$-based experiments reported in Hallworth et al. (Reference Hallworth, Huppert and Woods2005), the grain size was
  $R_1 \approx 5 \times 10^{-3}$ m while the distance over which gradients occurred was similar to the system size, so
  $H \approx 0.1$ m. The experimental thermistor data give the Darcy speed of a fast-moving transient early plume of roughly
  $10^{-5}\,{\rm m}\,{\rm s}^{-1}$. Using
  $D=10^{-8}\,{\rm m}^2\,{\rm s}^{-1}$ and
  $w_0=2 w_D/\phi$ (here
  $w_D$ is the dimensional Darcy speed) gives
  $P_h/\epsilon \approx 1$, indicating that these early fast-moving plumes in the experiments may have not been in the perfect ideal mushy regime.
The rates of solute and thermal advection are equal in mushy layers and are intermediate to those for solute and temperature in passive porous media and depend on the material properties of the mushy layers. Theoretical expressions for these rates based on ideal mushy layer theory were presented by Butler (Reference Butler2011), and we have shown here that pore-scale models are in good agreement with these predictions. Transport of solute and heat induces melting and freezing in mushy layers, where hot invading fluids induce melting if the system-scale transport is dominantly diffusive while they will induce freezing if the system-scale transport is dominantly advective. For sinusoidally varying temperature and solute fields, these melting patterns manifest as porosity profiles that correlate with temperature when transport is diffusion-dominated at the system size and anticorrelate with temperature when transport is advection-dominated. For  ${{Pe}}_h/\epsilon < 0.3$, the results of our pore-scale mushy model were in excellent agreement with the simulations assuming an ideal mushy layer and with predictions of an analytical model that assumed an ideal mushy layer and small variations in porosity. We note that the prediction of porosity assuming ideal mushy layers diverged from those for our pore-scale model to a greater degree than temperature and concentration for our highest-
 ${{Pe}}$ calculation displayed. We attribute this discrepancy to the fact that the porosity field is a result of the time-integrated variation of the temperature and concentration and so the effects of small differences in these with those of ideal mushy layers add up over time.
For passive porous layers, when  ${{Pe}}_{c} > 1$, the effects of advection dominate those of axial diffusion and we have identified regimes where the concentration and temperature fields reach a steady state in reference frames moving at
  $w_{c}$ and
  $w_{T}$, respectively. In this regime, the concentration magnitude may still be significantly less than that predicted by models assuming radially constant concentration, since the concentration field at different radii will have different phases. Above
  ${{Pe}}_h / \epsilon \gtrsim 2$, the concentration field becomes time dependent in any reference frame and will decrease in amplitude with time because of the effects of mechanical dispersion. Similar regimes would exist for temperature; however, because thermal diffusion is much greater than solutal diffusion, the flow velocities required would be much higher. In reactive porous layers, the calculation with the highest
  ${{Pe}}_h$ reached a regime where mechanical dispersion significantly decreased the concentration field relative to the thermal field in amplitude but the thermal field reached a state with a constant phase difference between the profiles of concentration at
  $r=0$ and
  $r=1$.
We have shown that the criterion for flow to be in the ideal mushy regime depends inversely on the length scale over which thermal and solutal variations are taking place,  $H$. Our simulations have assumed sinusoidal variation and hence a long length scale for the size of the solution domain. If we had instead investigated the transit of a sharp thermal and composition front through a reactive layer, we expect that non-ideal effects would have manifested for smaller values of
  ${{Pe}}$.
Our solution domain is clearly a great simplification compared with real mushy layers with tortuous pore networks and for which the deforming pores can feed back onto the flow. Experiments and linear theory for systems including gravity (Coriell et al. Reference Coriell, McFadden, Boisvert, Glicksman and Fang1984; Fang et al. Reference Fang, Glicksman, Coriell, McFadden and Boisvert1985; Glicksman et al. Reference Glicksman, Coriell and McFadden1986) have shown that for a single-component system, the interaction between the melt-driven deforming boundary and background flow can lead to significant instabilities. These studies considered concentric cylinders with a long axis and flow direction oriented parallel to gravity, and the unstable modes that they found had wavelengths much shorter than the wavelengths considered in this paper. It will be interesting to include fully deforming boundaries in a future investigation.
We have also limited this investigation to parameters that are appropriate for aqueous NH $_4$Cl and KNO
 $_3$ where the parameters
  $S$ and
  $\mathcal {C}$ are significantly greater than 1 and to systems with large porosity. Sea-ice has
  $\mathcal {C} \approx 1$ and typically low porosity, both of which will result in advection, diffusion and melting rates that depend on temperature and porosity, and hence the evolution will be nonlinear. In these cases, the assumptions made in deriving the analytical mushy solutions will not be valid. For sea-ice parameters at very high
  ${{Pe}}$, ideal mushy theory predicts that the temperature evolves to a shock (Butler Reference Butler2011). These nonlinear effects will be interesting to investigate using our two-dimensional model in a future study.
Additionally, it will be interesting to investigate effects of mechanical dispersion due to varying pore sizes and branching networks. These will add complexity and will likely affect the simple criterion developed here for determining if a mushy layer is likely to be close to ideal.
Acknowledgements
We would like to thank four anonymous reviewers and Associate Editor J. Wettlaufer for their comments when reviewing our manuscript.
Funding
S.L.B. would like to acknowledge funding from the Natural Sciences and Engineering Research Council of Canada. We would also like to acknowledge CMC Microsystems for providing access to COMSOL Multiphysics.
Declaration of interests
The authors report no conflict of interest.


 Open access