Although there is growing recognition of mental ill health as a serious contributor to disease burden, existing allocations of resources to address this burden remain very low in low- and middle-income countries (World Health Organization, 2001, 2005a ; Reference Saxena, Sharan and Garrido CumbreraSaxena et al, 2006), despite an increasing consensus on what mental disorders and interventions might constitute a basis for scaling up (Reference Hyman, Chisholm, Kessler, Jamison, Breman and MeashamHyman et al, 2006). From a financial perspective, two key questions remain: what is it actually going to cost to implement such an envisaged plan of action and who is going to pay? This study makes an attempt to tackle the first of these questions, and in so doing may help to stimulate discussion of the second question. Specifically, we set out to calculate the resource needs and costs associated with the scaling up of a core package of mental healthcare in low- and middle-income countries.
METHOD
Plan of analysis
To address the overall question of how much it will cost to scale up a core mental healthcare package, there is a need to define the package (in terms of health conditions and interventions to be included), estimate current v. target levels of treatment need and coverage in the populations of interest, and calculate the year-on-year resource costs required over a specified investment period to reach the desired coverage. The investment period is set here at 10 years (2006–2015) to be consistent with the Millennium Development Goals. The costing principles used are also consistent with other efforts to estimate the global costs of scaling up health service delivery with respect to these goals (Reference Dreesch, Dolea and Dal PozDreesch et al, 2005; World Health Organization, 2005b , 2006). First, financial costs reflect what needs to be paid for and what funds need to be mobilised (from a health system perspective). The financial costs incurred but not usually paid for by the health system, most notably travel costs incurred by patients and families to access care, were not included. Other costs such as travel time and lost productivity, which have an economic if not a financial value, were likewise excluded. Second, for incremental costing, current treatment coverage was estimated and the costs for maintaining that coverage level were assumed to continue to be available, meaning that only the resources and expenditures required over and above current spending levels are included in final scaling-up cost estimates. Third, fixed v. variable costs were estimated separately. Variable costs, including treatment, depend directly on the number of patients in need and the projected coverage level, whereas capital costs (e.g. equipment or buildings) do not vary with each new patient treated. In addition, programme costs incurred above the level of service delivery such as district or national training and supervision were estimated, including assessment of the capacity of each country's current health system to manage and monitor scale up. Fourth, both prices for ‘non-traded’ goods and need for services may vary greatly from country to country, so country-specific data should be used to the extent possible in order to build credible costing estimates.
All costs are expressed in US dollars for the year 2005 in order to allow comparison between countries and against scaling-up estimates for other diseases (i.e. no account was taken of inflation in the future).
Core package definition
Health conditions
Three ICD–10 mental disorders were selected for inclusion in the package: schizophrenia, bipolar affective disorder and depressive episode (World Health Organization, 1992). All cases in the adult population meeting diagnostic criteria were considered eligible for treatment. We also included one risk factor for disease, hazardous alcohol use, defined in line with the World Health Organization (WHO) Comparative Risk Assessment project as more than an average of 20 g pure alcohol per day for women and 40 g per day for men (Reference Rehm, Room, Monteiro, Ezzati, Lopez and RodgersRehm et al, 2004). For this condition, half of adult heavy drinkers were modelled to need treatment. Hazardous alcohol use was selected over alcohol use disorders because it is far more burdensome from a public health perspective (Rehm et al, Reference Rehm, Room, Monteiro, Ezzati, Lopez and Rodgers2004, Reference Rehm, Klotsche and Patra2007). These four health conditions were chosen because of their significant contribution to the burden of disease, their responsiveness to known interventions and the availability of data on current service provision and resource requirements for intervention (World Health Organization, 2001; Reference Saxena, Lora and van OmmerenSaxena et al, 2007). By implication, we excluded from the core mental healthcare package all anxiety disorders, disorders in childhood and adolescence, and intellectual disability, on the grounds that data on prevalence, current service provision or resource need estimates in low- and middle-income countries were not sufficient or available.
Annual adult prevalence rates for schizophrenia and bipolar disorder were obtained from the Global Burden of Disease Database, which provides estimates by WHO sub-region (http://www.who.int/healthinfo/bodgbd2002revised/en/index.html). For depression, prevalence estimates were derived from national epidemiological surveys where possible, undertaken independently or as part of the World Health Survey (country results available at http://www.who.int/healthinfo/survey/whsresults/en/index.html). If national data were unavailable, rates from the Global Burden of Disease study were used. For hazardous alcohol use, data were taken from the Global Alcohol Database (http://www.who.int/globalatlas/default.asp), based on the methodological assumptions of Rehm et al (Reference Rehm, Room, Monteiro, Ezzati, Lopez and Rodgers2004, Reference Rehm, Klotsche and Patra2007).
Interventions and service delivery
The overall service framework within which the scaling up of cost-effective interventions is modelled to occur is one where the majority of mental healthcare users are expected to be treated at primary care level, with referral of patients with complex problems to more specialist services (World Health Organization, 2003a : pp. 30–34). For schizophrenia and bipolar disorder, this relies on a mental health team based in the district to lead the treatment through community outreach activities and supported by out-patient and in-patient services. Primary healthcare professionals and workers have assigned responsibilities for follow-up of people with these severe disorders. For the other two conditions, the model relies more heavily on primary care – where opportunistic screening, treatment and follow-up functions are all undertaken. This is supported by the mental health team with out-patient and in-patient services.
The selection of interventions for inclusion in the package was based on the findings of cost-effectiveness analyses carried out for each of the four conditions in a range of low- and middle-income countries (Chisholm et al, Reference Chisholm, Rehm and van Ommeren2004a ,Reference Chisholm, Sanderson and Ayuso-Mateos b , Reference Chisholm, Van Ommeren and Ayuso-Mateos2005, Reference Chisholm, Gureje and Saldivia2007; Reference Hyman, Chisholm, Kessler, Jamison, Breman and MeashamHyman et al, 2006). With the exception of newer atypical antipsychotic medication, all index drugs appear in the latest edition of the WHO Model List of Essential Medicines (World Health Organization, 2007).
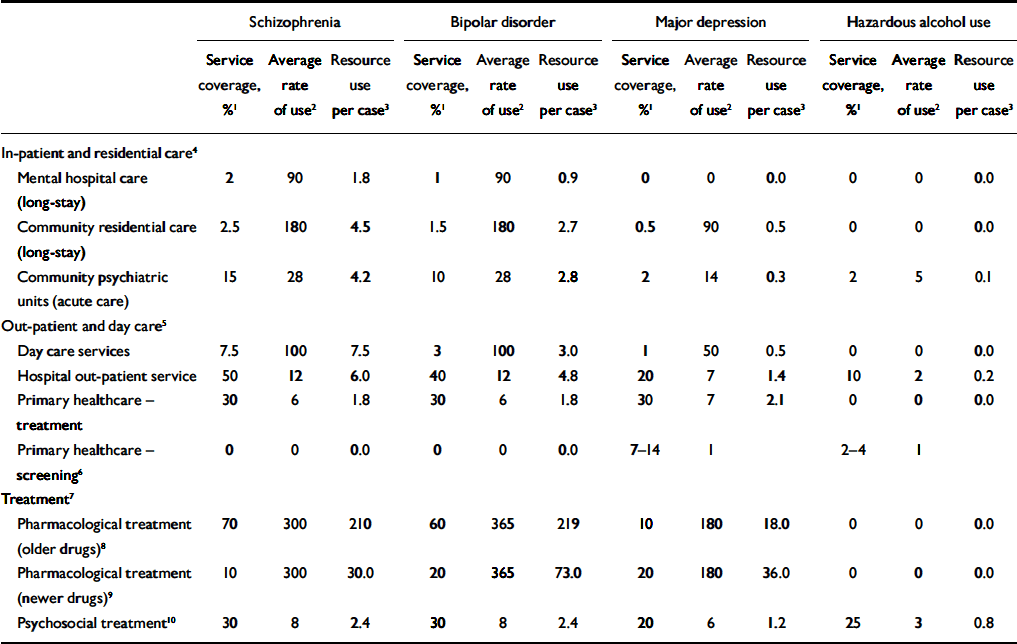
For schizophrenia and bipolar affective disorder, treatment is via mainly older antipsychotic or mood stabiliser drugs (the index drugs used are chlorpromazine and lithium carbonate respectively), for which coverage was scaled up over the 10 years from current levels (varying from 20 to 50% between countries, see below) to 70% for antipsychotics and 60% for mood stabilisers. Owing to their similar efficacy but much higher acquisition cost than older antipsychotic drugs (Reference Chisholm, Gureje and SaldiviaChisholm et al, 2007), newer antipsychotic drugs such as risperidone were only scaled up to 10% (from their already low level of use), and newer mood stabilisers – such as sodium valproate – from current coverage (varying from 2 to 10% across countries) to 20% over the 10 years. Adjuvant psychosocial care and support – which is estimated to appreciably improve health outcome for these disorders (Chisholm et al, Reference Chisholm, Van Ommeren and Ayuso-Mateos2005, Reference Chisholm, Gureje and Saldivia2007) – was scaled up from current coverage of 2–10% to 30% over the 10 years (see Table 1, including specification of the index therapies used).
Table 1 Target estimates for service coverage and resource utilisation
| Schizophrenia | Bipolar disorder | Major depression | Hazardous alcohol use | |||||||||||||||||
|---|---|---|---|---|---|---|---|---|---|---|---|---|---|---|---|---|---|---|---|---|
| Service coverage, % 1 | Average rate of use 2 | Resource use per case 3 | Service coverage, % 1 | Average rate of use 2 | Resource use per case 3 | Service coverage, % 1 | Average rate of use 2 | Resource use per case 3 | Service coverage, % 1 | Average rate of use 2 | Resource use per case 3 | |||||||||
| In-patient and residential care 4 | ||||||||||||||||||||
| Mental hospital care (long-stay) | 2 | 90 | 1.8 | 1 | 90 | 0.9 | 0 | 0 | 0.0 | 0 | 0 | 0.0 | ||||||||
| Community residential care (long-stay) | 2.5 | 180 | 4.5 | 1.5 | 180 | 2.7 | 0.5 | 90 | 0.5 | 0 | 0 | 0.0 | ||||||||
| Community psychiatric units (acute care) | 15 | 28 | 4.2 | 10 | 28 | 2.8 | 2 | 14 | 0.3 | 2 | 5 | 0.1 | ||||||||
| Out-patient and day care 5 | ||||||||||||||||||||
| Day care services | 7.5 | 100 | 7.5 | 3 | 100 | 3.0 | 1 | 50 | 0.5 | 0 | 0 | 0.0 | ||||||||
| Hospital out-patient service | 50 | 12 | 6.0 | 40 | 12 | 4.8 | 20 | 7 | 1.4 | 10 | 2 | 0.2 | ||||||||
| Primary healthcare – treatment | 30 | 6 | 1.8 | 30 | 6 | 1.8 | 30 | 7 | 2.1 | 0 | 0 | 0.0 | ||||||||
| Primary healthcare – screening 6 | 0 | 0 | 0.0 | 0 | 0 | 0.0 | 7–14 | 1 | 2–4 | 1 | ||||||||||
| Treatment 7 | ||||||||||||||||||||
| Pharmacological treatment (older drugs) 8 | 70 | 300 | 210 | 60 | 365 | 219 | 10 | 180 | 18.0 | 0 | 0 | 0.0 | ||||||||
| Pharmacological treatment (newer drugs) 9 | 10 | 300 | 30.0 | 20 | 365 | 73.0 | 20 | 180 | 36.0 | 0 | 0 | 0.0 | ||||||||
| Psychosocial treatment 10 | 30 | 8 | 2.4 | 30 | 8 | 2.4 | 20 | 6 | 1.2 | 25 | 3 | 0.8 | ||||||||
1. Service coverage: percentage of patients in the population who are expected to use the service or resource over the course of 1 year
2. Average rate of use: mean rate of uptake per year among those expected to use the service or resource
3. Resource use per ‘average’ patient in the population: percentage of patients expected to use the resource (coverage) multiplied by average rate of use
4. Average rate of use in days
5. Average rate of use in visits
6. Refers to coverage in the total adult population (i.e. pre-diagnosis)
7. Average rate of use in days taken (pharmacological treatment) or sessions provided (psychosocial treatment)
8. Index drugs used: chlorpromazine (schizophrenia); lithium carbonate (bipolar disorder); imipramine (depression)
9. Index drugs used: risperidone (schizophrenia); sodium valproate (bipolar disorder); fluoxetine (depression)
10. Index therapies used: family therapy (schizophrenia); problem-solving treatment (bipolar disorder); brief psychotherapy (depression); brief physician advice (alcohol use). Sessions last 40 min each, except brief interventions for alcohol use, which take 10 min
For the other two conditions, treatment is via antidepressants and/or psychosocial treatment for depression (Reference Chisholm, Sanderson and Ayuso-MateosChisholm et al, 2004b ), and brief interventions for heavy alcohol use (Reference Chisholm, Rehm and van OmmerenChisholm et al, 2004a ). Older (tricyclic) antidepressants were scaled up for some countries (from 5% coverage) and down for others (from 20% coverage) to a target coverage of 10%. Newer antidepressants (selective serotonin reuptake inhibitors, SSRIs) were scaled up from between 2 and 15% across countries to a target coverage of 20% (Table 1). These modelled changes are designed to reflect the increasing availability and affordability of generically produced SSRIs, which together with advantages for adherence will make them the drug of choice in the near future (Reference Chisholm, Sanderson and Ayuso-MateosChisholm et al, 2004b ; Reference Hyman, Chisholm, Kessler, Jamison, Breman and MeashamHyman et al, 2006).
Forensic services were excluded from consideration because of considerable variation in the definition and organisation of these services, as well as limited data on current forensic service provision.
Current service coverage and resource use
A key impediment to – but vital ingredient for – mental health resource planning concerns the availability of comprehensive and reliable data on existing levels of mental health service provision. However, development of a WHO Assessment Instrument for Mental Health Systems (WHO–AIMS) and its subsequent application in a number of low- and middle-income countries has significantly improved the situation (Reference Saxena, Lora and van OmmerenSaxena et al, 2007; http://www.who.int/mental_health/evidence/WHO-AIMS). We purposely selected 12 countries for which a WHO–AIMS data collection has recently been completed (see Table DS1 of the online data supplement to this paper for a set of summary indicators for numbers of trained mental health professionals, hospital beds and out-patient users). These 12 selected countries encompass a wide range of geographical, cultural and socio-economic settings, but they cannot be truly representative of other countries, so are best viewed as examples of what it might take for countries at different levels of economic development to scale up mental health services over the next decade.
Target estimates for service coverage and resource use
What proportion of cases eligible for treatment can actually be reached over time, and what might constitute a typical expected package of care? Given the significant disability, vulnerability and also greater visibility of people with schizophrenia and bipolar affective disorder, a high target coverage was set for these two conditions (80%) – despite the current disturbingly low levels of coverage in many low-income countries. For hazardous alcohol use and depressive episode, target coverage is much lower (25 and 33% respectively) because of well-established challenges of identification, access and willingness to receive care. The proportion of eligible patients expected to make use of different services in order to meet these overall treatment coverage levels, together with estimates of service use intensity, are given in Table 1.
Target coverage and resource need estimates were finalised after consultation with the Lancet Mental Health Call for Action Group (2007), and were informed by previous population-based mental health need assessment exercises (World Health Organization, 1996; Reference Lund, Flisher and LeeLund et al, 2000; Reference Lund and FlisherLund & Flisher, 2006), a multinational Delphi consensus study on resource needs for neuropsychiatric disorders in low- and middle-income countries (Reference Ferri, Chisholm and Van OmmerenFerri et al, 2004) and WHO sub-regional cost-effectiveness analyses for each of the health conditions (Chisholm et al, Reference Chisholm, Rehm and van Ommeren2004a ,Reference Chisholm, Sanderson and Ayuso-Mateos b , Reference Chisholm, Van Ommeren and Ayuso-Mateos2005, Reference Chisholm, Gureje and Saldivia2007).
Human resource requirements (clinical care)
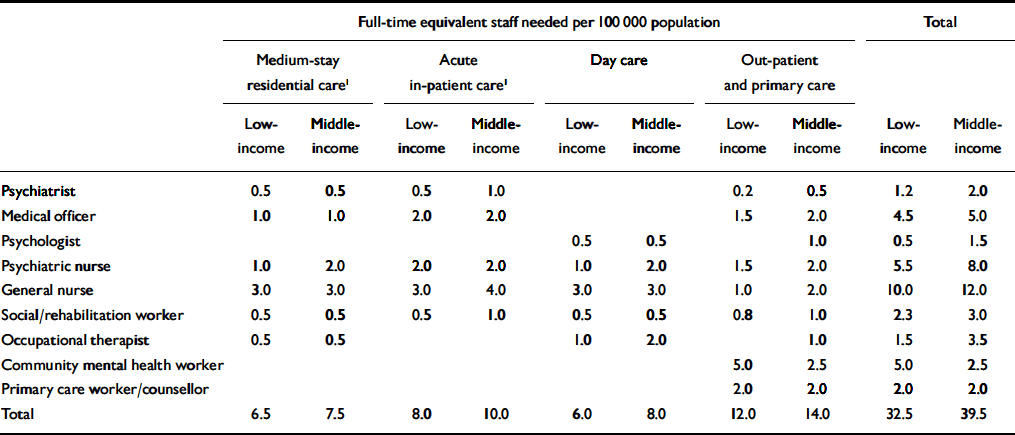
Estimation of the full-time equivalent (FTE) mental health and primary care staff needed to deliver the package was based on previous need assessment studies (World Health Organization, 1996, 2003b ; Reference Lund, Flisher and LeeLund et al, 2000). Separate estimates were derived for low-income and middle-income countries, in order to reflect current differences in the availability of human resources and services for mental health (see Table DS1 of the online supplement) and the consequently longer lag in training sufficient numbers of health personnel to meet target coverage goals. For acute and long-stay psychiatric in-patient units with 24 beds, a clinical team of 8–10 and 6.5–7.5 FTE staff per 100 000 population is envisaged for low- and middle-income countries respectively. A further 12–14 FTE staff would be required per 100 000 population for out-patient, community and primary care. This gives a total requirement of 32.5–39.5 FTE staff per 100 000 population for low- and middle-income countries respectively (Table 2). The predicted out-patient workload that would follow from the deployment of this workforce is shown in Table DS2 of the online supplement, which reveals a plausible daily workload in 2015 that ranges between 6 and 12 out-patients seen per health professional per working day.
Table 2 Target estimates for mental healthcare staffing
| Full-time equivalent staff needed per 100 000 population | Total | |||||||||||||||||
|---|---|---|---|---|---|---|---|---|---|---|---|---|---|---|---|---|---|---|
| Medium-stay residential care 1 | Acute in-patient care 1 | Day care | Out-patient and primary care | |||||||||||||||
| Low-income | Middle-income | Low-income | Middle-income | Low-income | Middle-income | Low-income | Middle-income | Low-income | Middle-income | |||||||||
| Psychiatrist | 0.5 | 0.5 | 0.5 | 1.0 | 0.2 | 0.5 | 1.2 | 2.0 | ||||||||||
| Medical officer | 1.0 | 1.0 | 2.0 | 2.0 | 1.5 | 2.0 | 4.5 | 5.0 | ||||||||||
| Psychologist | 0.5 | 0.5 | 1.0 | 0.5 | 1.5 | |||||||||||||
| Psychiatric nurse | 1.0 | 2.0 | 2.0 | 2.0 | 1.0 | 2.0 | 1.5 | 2.0 | 5.5 | 8.0 | ||||||||
| General nurse | 3.0 | 3.0 | 3.0 | 4.0 | 3.0 | 3.0 | 1.0 | 2.0 | 10.0 | 12.0 | ||||||||
| Social/rehabilitation worker | 0.5 | 0.5 | 0.5 | 1.0 | 0.5 | 0.5 | 0.8 | 1.0 | 2.3 | 3.0 | ||||||||
| Occupational therapist | 0.5 | 0.5 | 1.0 | 2.0 | 1.0 | 1.5 | 3.5 | |||||||||||
| Community mental health worker | 5.0 | 2.5 | 5.0 | 2.5 | ||||||||||||||
| Primary care worker/counsellor | 2.0 | 2.0 | 2.0 | 2.0 | ||||||||||||||
| Total | 6.5 | 7.5 | 8.0 | 10.0 | 6.0 | 8.0 | 12.0 | 14.0 | 32.5 | 39.5 | ||||||||
1. Units of 24 beds
Cost estimation
The cost per year of scaling up each service component of the package to those in need was calculated as total adult population × adult annual prevalence × service coverage × rate of use × unit cost of service. Unit costs of primary and secondary care services were derived from an econometric analysis of a multinational data-set of hospital costs, using gross national income per capita (plus other explanatory variables) to predict unit costs at the country level (Reference Adam, Evans and MurrayAdam et al, 2003; http://www.who.int/choice/country/en/index.html). For medication costs, international supplier prices (rather than local retail prices) were obtained from the International Drug Price Indicator Guide (http://erc.msh.org/dmpguide), adjusted upwards by a 10–50% transportation multiplier to reflect the additional costs of drug distribution. Country-specific unit costs used in this analysis can be found in Table DS3 of the online supplement.
A series of one-way and multi-way sensitivity analyses were carried out to observe the impact of plausible – or when combined, extreme – changes in service coverage, resource use and unit prices on baseline cost estimates.
In order to reach target levels of health service coverage, there is an inescapable requirement in most low- and middle-income countries to significantly bolster other key components of the mental health system, not only at the national level but also at the provincial and district levels. Scaling up is assumed to occur steadily, with increasing numbers of provinces and their districts equipped to deliver the core package to their respective populations.
Programme management
Target norms were established for three levels of health system development, based upon prior WHO estimates of programme-level costs (Johns et al, Reference Johns, Baltussen and Adam2003, Reference Johns, Adam and Evans2006). Principal categories of cost incorporated into the model include: personnel for mental health system planning, management and evaluation; national and province-level workshops for planning and monitoring; nationally representative surveys of mental health status, service uptake and outcome in the population; plus advocacy and awareness campaigns through mass media outlets.
Training and supervision
A cascade system is anticipated whereby province-level mental health leads (trained centrally) organise training for the ambulatory mental health teams working at district level, who in turn provide basic training to primary care workers. For mental health team professionals, an initial course of 20 days plus 3 days refresher training/supervision per year was estimated (for a total of 47 days per trainee over 10 years), compared with 10 and 2 days respectively for primary care workers (a total of 28 days per trainee over 10 years).
Capital infrastructure
An extensive programme of capital investment in mental health acute in-patient and out-patient facilities is required in most countries in order to accommodate the projected increase in patients, staff and services. For each additional required acute in-patient bed, for example, we allowed for a total of 25 m2 (10 of which for common space in a ward) and multiplied this by the replacement cost per square metre in each country (available from the WHO–CHOICE database; see Table DS3 of online supplement), including adjustment for land purchase, permits, contracting, site works and equipment. These investment costs are partially offset, where applicable, by the sale of land and buildings that would result from a gradual downsizing and closure of long-stay mental hospitals.
RESULTS
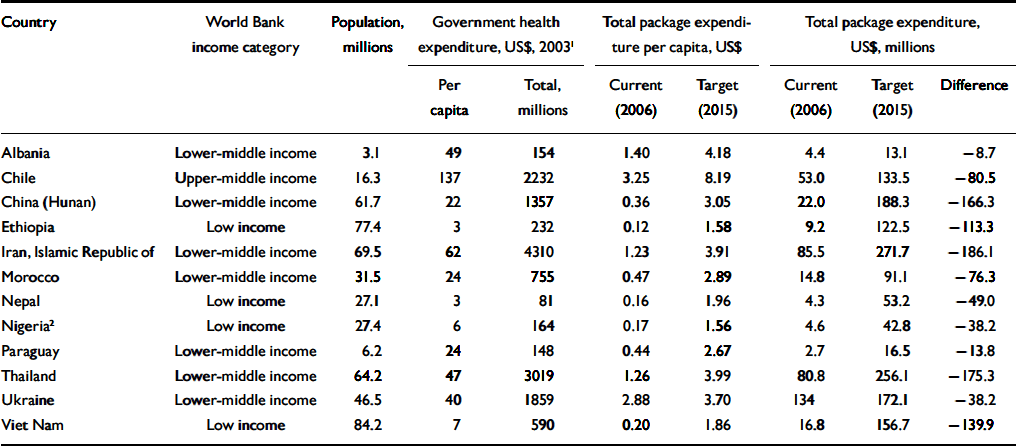
Table 3 provides a set of summary financial indicators relating to the core mental heathcare package in 12 selected low- and middle-income countries, both at current and target levels of coverage. The 12 selected countries ranged widely in terms of population size (from below 10 million to more than 70 million) and level of economic development (from very-low-income countries such as Ethiopia, Nepal and Nigeria with total annual government health spending of less than $10 per capita through to one upper-middle-income, country, Chile, with health spending above $100 per capita).
Table 3 Financial indicators for a specified mental heathcare package
| Country | World Bank income category | Population, millions | Government health expenditure, US$, 2003 1 | Total package expenditure per capita, US$ | Total package expenditure, US$, millions | ||||||||
|---|---|---|---|---|---|---|---|---|---|---|---|---|---|
| Per capita | Total, millions | Current (2006) | Target (2015) | Current (2006) | Target (2015) | Difference | |||||||
| Albania | Lower-middle income | 3.1 | 49 | 154 | 1.40 | 4.18 | 4.4 | 13.1 | –8.7 | ||||
| Chile | Upper-middle income | 16.3 | 137 | 2232 | 3.25 | 8.19 | 53.0 | 133.5 | –80.5 | ||||
| China (Hunan) | Lower-middle income | 61.7 | 22 | 1357 | 0.36 | 3.05 | 22.0 | 188.3 | –166.3 | ||||
| Ethiopia | Low income | 77.4 | 3 | 232 | 0.12 | 1.58 | 9.2 | 122.5 | –113.3 | ||||
| Iran, Islamic Republic of | Lower-middle income | 69.5 | 62 | 4310 | 1.23 | 3.91 | 85.5 | 271.7 | –186.1 | ||||
| Morocco | Lower-middle income | 31.5 | 24 | 755 | 0.47 | 2.89 | 14.8 | 91.1 | –76.3 | ||||
| Nepal | Low income | 27.1 | 3 | 81 | 0.16 | 1.96 | 4.3 | 53.2 | –49.0 | ||||
| Nigeria 2 | Low income | 27.4 | 6 | 164 | 0.17 | 1.56 | 4.6 | 42.8 | –38.2 | ||||
| Paraguay | Lower-middle income | 6.2 | 24 | 148 | 0.44 | 2.67 | 2.7 | 16.5 | –13.8 | ||||
| Thailand | Lower-middle income | 64.2 | 47 | 3019 | 1.26 | 3.99 | 80.8 | 256.1 | –175.3 | ||||
| Ukraine | Lower-middle income | 46.5 | 40 | 1859 | 2.88 | 3.70 | 134 | 172.1 | –38.2 | ||||
| Viet Nam | Low income | 84.2 | 7 | 590 | 0.20 | 1.86 | 16.8 | 156.7 | –139.9 | ||||
1. National Health Accounts estimates, as reported in Annex Table 3 of the World Health Report 2006
2. Population and total expenditure data relate only to 6 (out of the 36) provinces/states of Nigeria
Current expenditure on the specified package of mental healthcare
The estimated cost of providing the specified mental healthcare package at current levels of service coverage – excluding training, capital and other programme costs – is shown in Fig. 1. Current annual care expenditures on this package in the four low-income countries represented in this analysis – Ethiopia, Nepal, Nigeria and Viet Nam – is estimated to be only $0.10–0.20 per capita total population (equivalent to $5–10 million per year for a population of 50 million). Expenditure in lower-middle-income countries ranged from less than $0.50 in China (Hunan Province), Morocco and Paraguay up to $1.20–1.25 in Albania, Thailand and the Islamic Republic of Iran. Expenditure is highest in Ukraine ($2.87) plus the one upper-middle-income country represented here, Chile ($3.19). Most of these expenditures are directed towards interventions and services for schizophrenia and bipolar disorder. Current coverage of, and therefore expenditure on, brief interventions in primary healthcare for hazardous alcohol use is negligible in all but a few middle-income countries (Albania, Chile, Thailand, Ukraine).
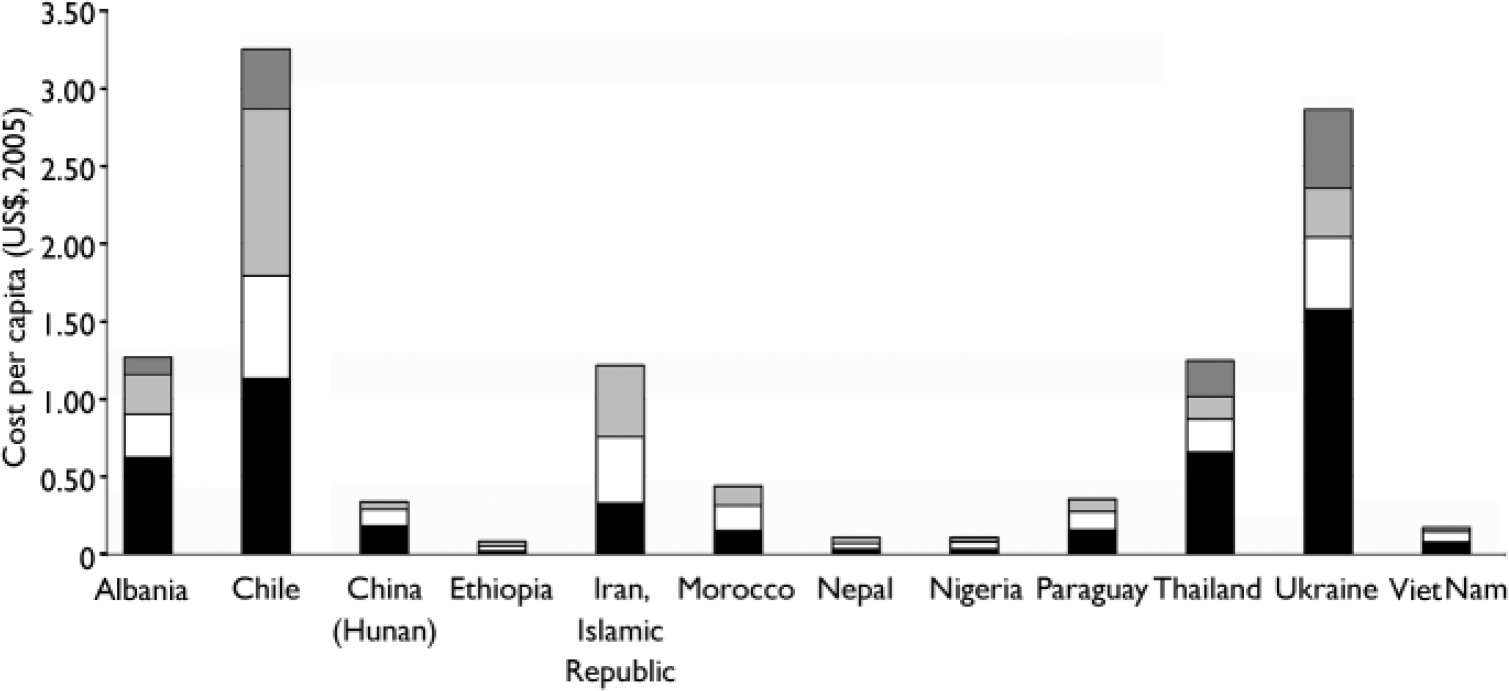
Fig. 1 Cost per capita of delivering a specified mental healthcare package at current levels of service coverage. ![]() , Hazardous alcohol use;
, Hazardous alcohol use; ![]() , major depression; □, bipolar disorder; ▪, schizophrenia.
, major depression; □, bipolar disorder; ▪, schizophrenia.
Resource requirements following scaling up of the package
Marked changes in the availability of mental health services are anticipated, including a substantial increase in acute psychiatric admissions as well as out-patient and community care visits. These service needs translate into large-scale increases in capital infrastructure and human resource deployment, offset only by a reduction in the number of required psychiatric hospital beds (currently above 15 per 100 000 population in Albania, Thailand and Ukraine). Figure 2, for example, shows the estimated number of FTE staff (per 100 000 population) required to deliver the specified package at current v. projected levels of coverage. In a number of middle-income countries current staffing levels are two-thirds to three-quarters of what they are estimated to need (Albania, Chile, Islamic Republic of Iran and Ukraine), but elsewhere the ratio is below one-third, thereby indicating that there is a need to significantly enhance the supply of trained mental health professionals.
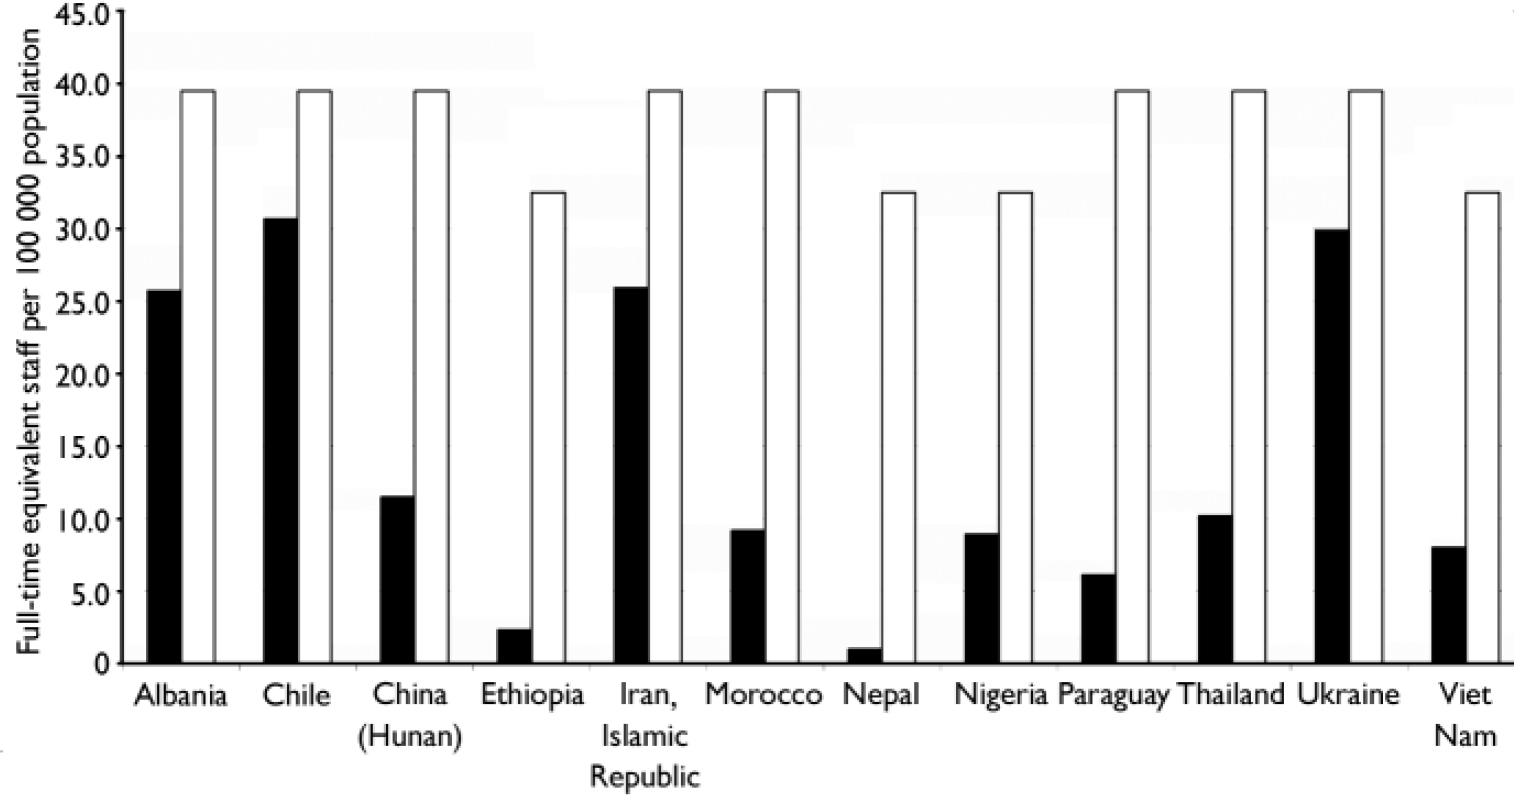
Fig. 2 Current v. projected number of full-time equivalent staff required to deliver the specified package. ▪, 2006; □, 2015
Aggregate costs of scaled-up provision
If desired target coverage levels are to be reached in 10 years time, total annual expenditure in the four low-income countries included here (Ethiopia, Nepal, Nigeria and Viet Nam) would need to rise steeply by at least 9 times (to $1.50–2.00 per capita), and by a factor of 2–6 (to around $3–4 per capita) in lower-middle-income countries such as Morocco, Thailand and the Islamic Republic of Iran. The treatment of depression and hazardous alcohol use would consume an increased proportion of this total expenditure (30–55%). Figure 3 provides a breakdown of per capita costs in 2015, this time by category of expenditure.
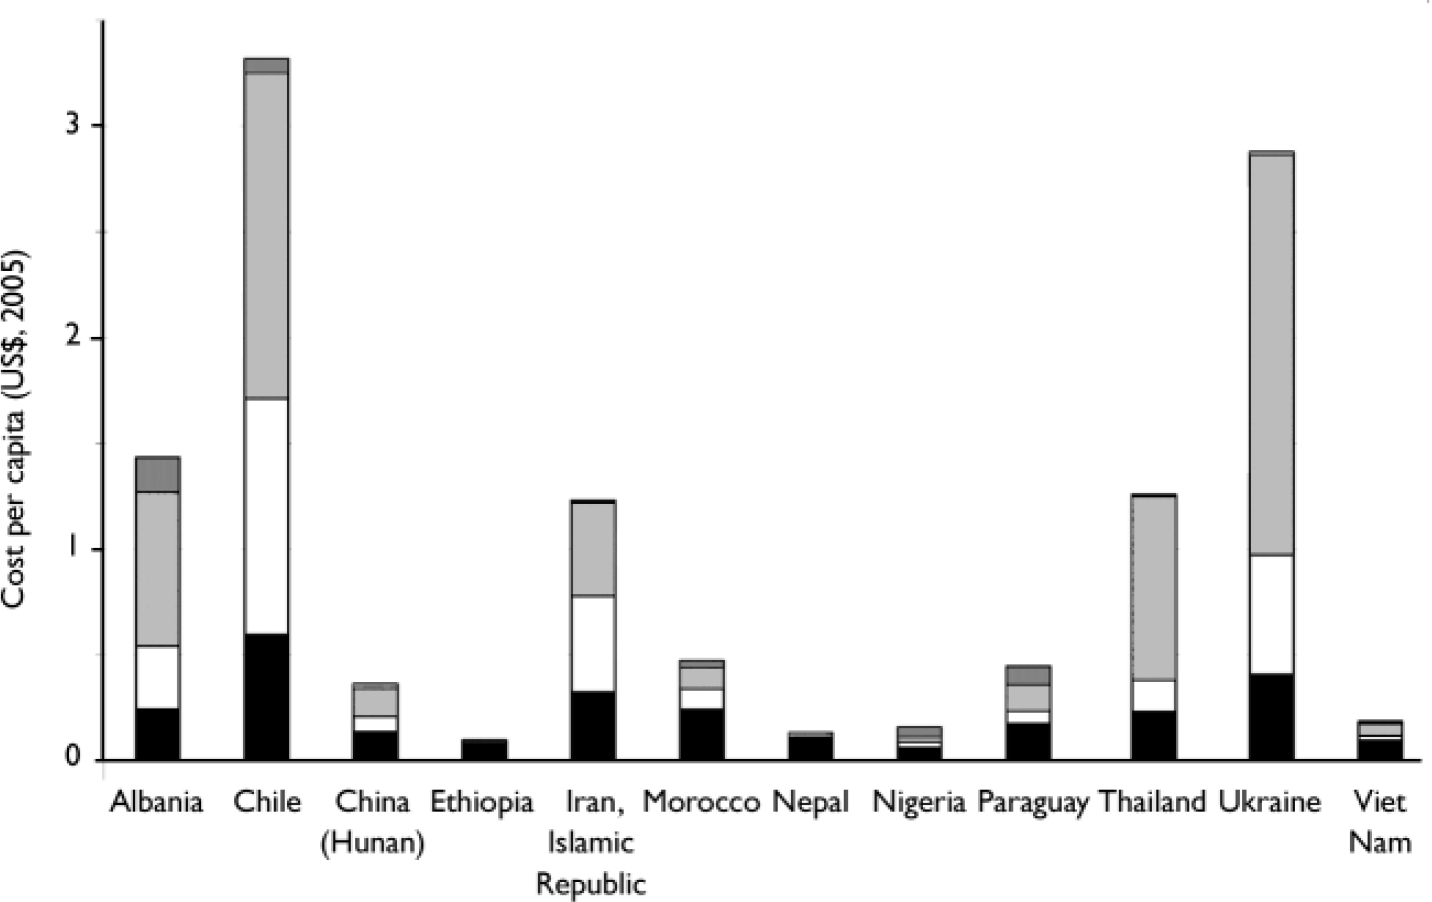
Fig. 3 Cost per capita of delivering a specified mental healthcare package at target levels of service coverage. ![]() , Programme development and management;
, Programme development and management; ![]() , in-patient and residential care; □, out-patient and primary care; ▪, drug and psychosocial treatment.
, in-patient and residential care; □, out-patient and primary care; ▪, drug and psychosocial treatment.
By subtracting out the expenditure associated with current treatment coverage (assuming it remains unchanged), an indication of the incremental or additional spend per capita for each year of scaled-up activity can be ascertained. For most countries, an initial period of large-scale investment of $0.30–0.50 per capita (mainly related to building new acute inpatient and out-patient facilities) is followed by a gradual per capita spend of $0.10–0.25 per year as increasing numbers of provinces are covered. In absolute terms, the amount of additional investment required for the whole 10-year period ranges from less than $50 million in relatively small countries such as Albania, Nepal or Paraguay (with populations below 30 million) to more than $100 million in larger countries (with populations in excess of 50 million; Table 1).
Sensitivity analysis of the impact of plausible modifications to three key drivers of cost – target coverage level, rates of utilisation and unit prices of health services or goods – reveals that, across the 12 countries, adjusting unit costs of secondary care services (by 20%), changing the distribution of older v. newer drugs (by 10%) and altering the proportions in contact with out-patient v. primary care services (by 10%) changed baseline estimates by an average of 10% or less (Fig. 4). The most significant independent effects on baseline estimates were mean length of stay (a 50% increase is associated with a 17–34% increase in the expected total or per capita cost in 2015) and target coverage (reducing coverage to 50% for serious mental disorders and to 15% for the other two conditions takes the estimated package cost down by 31–55%).
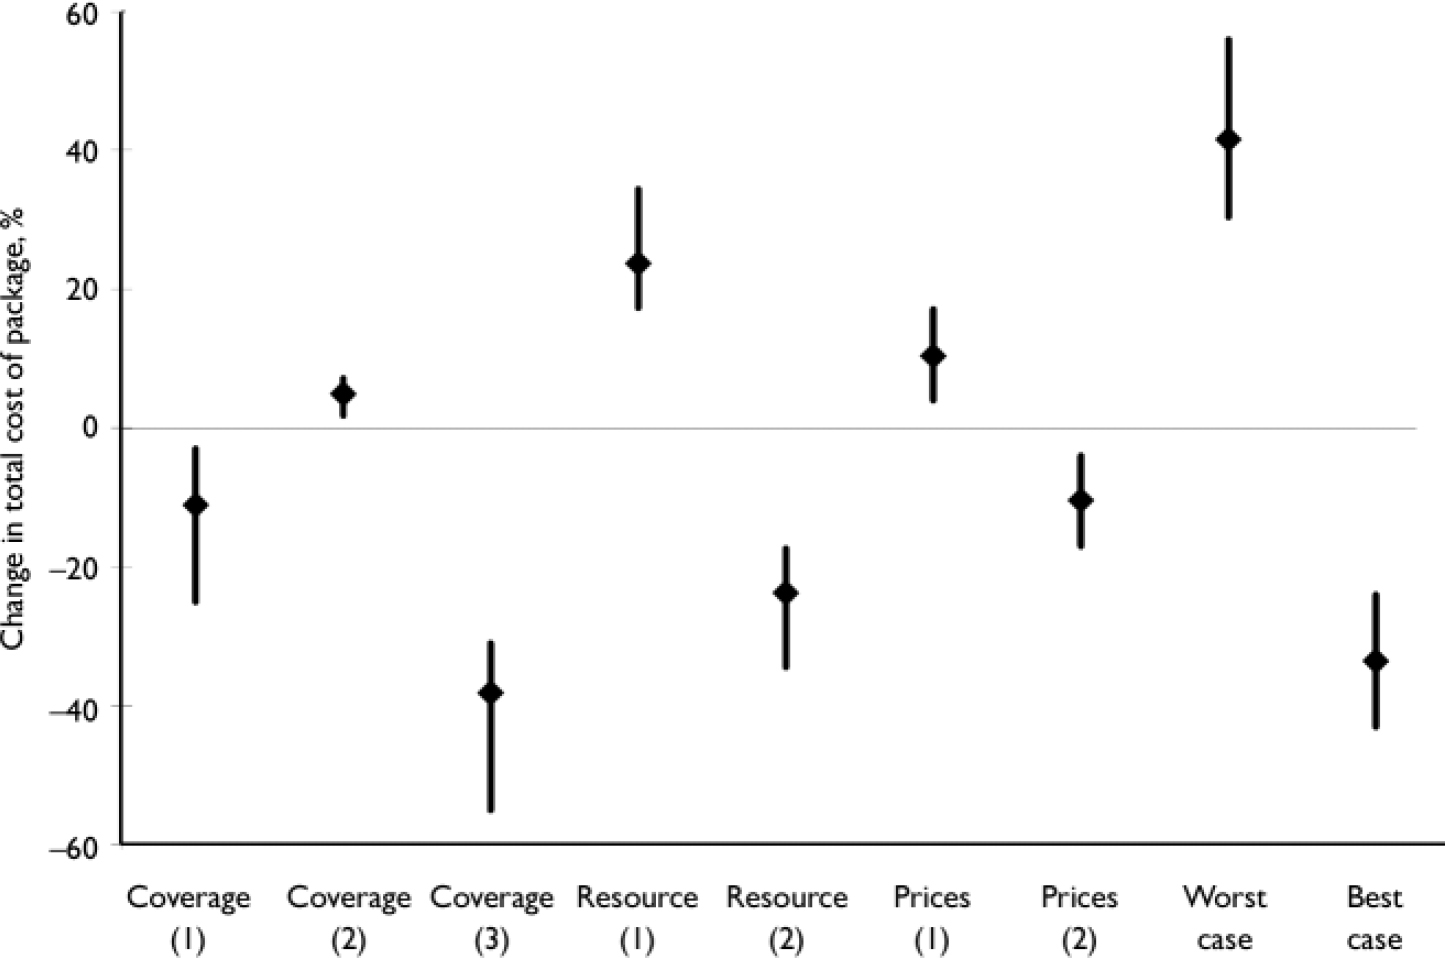
Fig. 4 Impact of changes in target coverage, service use and unit prices on baseline cost estimates. Values relate to the percentage change in the expected cost of the package in 2015, and are provided for the 12 countries as a whole (average change, ♦), together with minimum and maximum values (for the country with the least/greatest change). Coverage (1), reduce target coverage for out-patient services (by 10%), increase target coverage for primary healthcare services (by 10%); Coverage (2), reduce target coverage of old drugs (by 10%), increase target coverage of new drugs (by 10%); Coverage (3), reduce treatment coverage (to 50% for schizophrenia and bipolar disorder, to15% for depression and hazardous alcohol use); Resource (1), increase average length of stay in overnight facilities (by 50%); Resource (2), decrease average length of stay in overnight facilities (by 50%); Prices (1), increase unit costs of secondary care (in-patient, residential and out-patient services) by 20%; Prices (2), decrease unit costs of secondary care (in-patient, residential and out-patient services) by 20%; Worst case, higher secondary care unit costs (20%), higher average length of stay (50%), higher use of newer drugs (10%); Best case, lower secondary care unit costs (20%), lower average length of stay (50%), higher use of older drugs (10%).
DISCUSSION
Resource implications of scaling up mental healthcare
No systematic attempt has yet been made to map out the resources and expenditures that might reasonably need to be mar-shalled in order to deliver a package of service interventions capable of making a meaningful dent in the currently massive global burden of mental disorders. This first effort suggests that the extra cost of scaling up mental health services over a 10-year period in order to provide extensive coverage of the core package specified here is not large in absolute terms (an additional investment of around $0.20 per capita per year for low-income countries and $0.30 for lower-middle-income countries, leading to a total financial outlay of up to $2 per person in low-income countries and $3–4 in lower-middle-income countries by 2015).
Neither is such a level of investment large or startling when compared with estimated funding requirements for tackling other major contributors to global disease burden; for example, the full estimated costs of scaling up a neonatal healthcare package to 90% coverage have been put at $5–10 per capita (Reference Knippenberg, Lawn and DarmstadtKnippenberg et al, 2005), whereas the cost of providing universal access to basic health services has been estimated to exceed $30 per person per year (Commission on Macroeconomics and Health, 2001).
Although the estimated investments are not large in absolute terms, they would nevertheless represent a dramatic departure from the budget allocations currently accorded to mental health, particularly in highly resource-constrained countries where the projected building costs alone would consume over 10% of the entire health budget. In fact, if the total health budget remained unchanged for 10 years, delivery of the specified mental healthcare package at target coverage would account for a quarter of total health spending in Nigeria and Viet Nam, and more than half in Nepal and Ethiopia. In countries such as Albania or Ukraine, by contrast, it is not so much new allocations of (mainly external) funds that are needed as much as a reallocation of existing domestic resources and capital.
Policy considerations
It should be noted that the recommendations for scaling up services in these 12 countries imply not only an increase in resources and expenditure for mental health, but also a change in the way mental health services are delivered. Chief among these is a change from institutionally based models of care (among those countries where this still predominates), to community-based care and the introduction of evidence-based interventions. Emphasis is also given to the development of national mental health programmes that facilitate new mental health policy, legislation and strategic plans.
A key target audience for these conclusions are international development agencies. For too long mental health has been left off the agenda of basic development aid packages to low- and middle-income countries. This study demonstrates that scaling up a core package of mental health services is measurable and achievable if governments and international development agencies are prepared to give mental health due priority. Given the growing body of evidence that demonstrates higher rates of mental disorder in poorer communities, and the vicious cycle of mental ill health and poverty (World Health Organization, 2001; Reference Patel and KleinmanPatel & Kleinman, 2003), mental health interventions need to be seen as an integral part of poverty alleviation strategies, and included on international development agendas (Lancet Mental Health Call for Action Group, 2007).
Study limitations
The scope and limitations of this exercise should be emphasised. Estimates are provided for a small set of selected countries, which may or may not reflect resource needs in other low- and middle-income countries. Equally, although best-available data have been employed to estimate epidemiological need, treatment coverage, service utilisation and prices, there remains considerable uncertainty around these estimates (as shown in the sensitivity analysis). Together with inevitable variations in how the package would actually be formulated and implemented in countries, this uncertainty suggests that our estimates should best be viewed as indicative. For example, the suggested levels of target coverage – which were set equal for all countries in the interest of comparability – may give rise to levels of resource requirement that are considered not feasible or affordable in some low-income countries; in such cases the content and target coverage could be revised downwards, but recognising that the amount of care offered or burden averted will likewise be reduced. In some higher-income countries, by contrast, restriction of the package to a small number of health conditions and interventions may be seen to unduly limit the broader vision of developing a comprehensive mental health system. It is therefore hoped that countries interested in developing their mental health systems will make use of the methodology developed in this study (by contacting the authors) so that they can generate their own estimates of need, coverage and resource requirements.
Further research is needed to estimate the resource implications of scaling up services for areas not addressed here, including anxiety disorders, disorders of childhood and adolescence, intellectual disability and forensic services.
Acknowledgements
We acknowledge the Lancet Mental Health Call for Action Group who stimulated this study and the data collection efforts of the WHO-AIMS team and its collaborating partners in WHO member states. We also thank Benjamin Johns for technical advice on costing methodologies related to the scaling up of health services. C.L. is funded by the UK Department for International Development (DFID). The views expressed are those of the authors and not necessarily those of the organisations they work for (or receive funding from).


eLetters
No eLetters have been published for this article.