


Introduction
Autism spectrum disorder (autism) is a neurodevelopmental condition characterized by social-communicative differences, focused and repetitive behaviors, and sensory differences (Sarmiento & Lau, Reference Sarmiento, Lau, J. Carducci, S. Nave, Di Fabio, H. Saklofske and Stough2020). The latest monitoring results from the Centers for Disease Control and Prevention (CDC) on 27 March 2020 show that the prevalence of autism has increased by nearly 10% from 2 years ago, accounting for 1/54 of American children (CDC, https://www.cdc.gov/). One of the key characteristics of autism is its high phenotypic and biological heterogeneity (Lombardo, Lai, & Baron-Cohen, Reference Lombardo, Lai and Baron-Cohen2019). The often mixed and inconsistent observations from structural and functional neuroimaging have been variously attributed to this heterogeneity. Nevertheless, the consistent co-occurrence of the several phenotypical features in a syndromic manner raises the question of putative neural markers that are likely to be consistent across various samples and sites.
Hemispheric asymmetry is considered a latent biomarker related to various psychiatric and neurocognitive atypicalities, including schizophrenia, attention-deficit hyperactivity disorder (He, Palaniyappan, Linli, & Guo, Reference He, Palaniyappan, Linli and Guo2022), and also in autism (Duboc, Dufourcq, Blader, & Roussigné, Reference Duboc, Dufourcq, Blader and Roussigné2015; Toga & Thompson, Reference Toga and Thompson2003). Early observations from computed tomography images revealed an unusual right lateralization especially in posterior language areas (Hier, LeMay, & Rosenberger, Reference Hier, LeMay and Rosenberger1979; Rojas, Camou, Reite, & Rogers, Reference Rojas, Camou, Reite and Rogers2005) but this was not replicated by others (Prior, Tress, Hoffman, & Boldt, Reference Prior, Tress, Hoffman and Boldt1984; Tsai, Jacoby, Stewart, & Beisler, Reference Tsai, Jacoby, Stewart and Beisler1982). This topic is being revisited in recent years, especially with phenotype refinement and availability of multimodal imaging from large number of subjects providing better population-level mapping of asymmetry (Kong et al., Reference Kong, Mathias, Guadalupe, Abé, Agartz, Akudjedu and Orhan2018) using magnetic resonance imaging (MRI). When focusing on brain structure, the expected leftward volume asymmetry of language-related cortical regions such as the planum temporale, Heschl's gyrus, posterior supramarginal gyrus, and parietal operculum and the inferior parietal lobule (Floris et al., Reference Floris, Lai, Auer, Lombardo, Ecker, Chakrabarti and Suckling2016) is reduced with a rightward bias in autism, while the expected symmetry of the fusiform gyrus area is reduced with a leftward bias (Dougherty, Evans, Katuwal, & Michael, Reference Dougherty, Evans, Katuwal and Michael2016), with a general effect of overall reduction in asymmetry for all affected regions (Postema et al., Reference Postema, van Rooij, Anagnostou, Arango, Auzias, Behrmann and Francks2019; Sha et al., Reference Sha, van Rooij, Anagnostou, Arango, Auzias, Behrmann and Francks2022). In terms of functional MRI (fMRI), autism is characterized by reduced leftward language lateralization compared to controls (Kleinhans, Müller, Cohen, & Courchesne, Reference Kleinhans, Müller, Cohen and Courchesne2008; Knaus, Tager-Flusberg, Mock, Dauterive, & Foundas, Reference Knaus, Tager-Flusberg, Mock, Dauterive and Foundas2012; Lindell, Reference Lindell, F. Casanova, El-Baz and S. Suri2017) and a rightward shift of functional connectivity (Cardinale, Shih, Fishman, Ford, & Müller, Reference Cardinale, Shih, Fishman, Ford and Müller2013). Importantly, direct investigation of high-risk children studied at infancy suggests that the onset of atypical asymmetry in resting-state functional MRI (rs-fMRI) predates autistic features by several years (Rolison, Lacadie, Chawarska, Spann, & Scheinost, Reference Rolison, Lacadie, Chawarska, Spann and Scheinost2022).
While the emerging literature on atypical lateralization in autism is encouraging, many outstanding questions remain. Most studies on hemispheric lateralization are based on a single modality (structure or function); it is unclear if atypical functional lateralization in activation and connectivity follows the changes in structural laterality. Demonstrating the structure–function correspondence could clarify if the atypical lateralization observed people with autism represent a primary impairment (with strong structure–function correspondence) or emerge over time in the functional domain (with no accompanying structural differences) or even adaptive, in which case, functional laterality opposing the underlying structural differences but relating to lower symptom burden. Second, if the heterogeneity of a phenotype (autism) depends on a critical biological feature (laterality), then we can expect notably higher variance of this feature (asymmetry) among those who exhibit the phenotype. We comprehensively study these questions on hemispheric lateralization in autism using multimodal and multisite data.
Meta-analysis methods integrate the results of different sites by performing site-specific statistical analyses and combining the results afterwards. These methods have shown great promise. They are often used to evaluate studies that compare the averages of two groups. The standardized mean difference (SMD, also known as Cohen's; dand its associated derivatives) is the difference between group means divided by the within-study variability; it is a commonly used effect size measure for this purpose. In practice, two groups may differ in terms of not only their means but also their variances (Nakagawa et al., Reference Nakagawa, Poulin, Mengersen, Reinhold, Engqvist, Lagisz and Senior2015; Violle et al., Reference Violle, Enquist, McGill, Jiang, Albert, Hulshof and Messier2012). Several methods to test for differences in the variance of groups have been proposed (Nakagawa et al., Reference Nakagawa, Poulin, Mengersen, Reinhold, Engqvist, Lagisz and Senior2015). In particular, the logarithm of the ratio of standard deviation (s.d.), that is, log ‘variability ratio’ (lnVR), is commonly used across the standard meta-analytic paradigm (Palaniyappan, Sabesan, Li, & Luo, Reference Palaniyappan, Sabesan, Li and Luo2021).
In this study, brain hemispheric lateralization was investigated on the basis of the rs-fMRI and structural magnetic resonance imaging (sMRI) data of 868 subjects [370 people with autism and 498 non-autistic controls (NACs)] from seven different sites. The meta-effect sizes based on the SMD and s.d. for lateralization for three cortical features [i.e. gray matter volume (GMV) indexing regional structure, fractional amplitude of low-frequency fluctuation (fALFF) indexing hemodynamic signal strength, and regional homogeneity (ReHo) indexing local connectivity] were studied separately. By capturing the mean differences and variations at the individual level, in combination with quantifying the degree of heterogeneity displayed in these measures in autism, our work provides a step toward precision neuroscience in autism.
Materials and methods
Participants
The rs-fMRI and sMRI data included in the study were collected from seven sites of the Autism Brain Imaging Data Exchange Project (ABIDE, http://fcon_1000.projects.nitrc.org/indi/abide/abide_I.html), namely, Georgetown University (GU), NYU Langone Medical Center Sample 1 (NYU1), Oregon Health and Science University (OHSU), University of California, Los Angeles Sample 1 (UCLA1), University of Michigan Sample 1 (UM1), University of Utah School of Medicine (USM), and Kennedy Krieger Institute (KKI); the sample size of all seven sites was greater than 80. People with autism and their parents completed the Autism Diagnostic Interview-Revised (ADI-R) interview (Disorders, Hospital, & Interview, Reference Disorders, Hospital and Interview1994). The subdomains of the ADI-R were used to determine clinical features in terms of differences in social interaction domain (ADI-A); differences in communication domain (ADI-B); and repetitive behaviors domain (ADI-C). This study was approved by the local ethics committee and adhered to the Declaration of Helsinki. Written informed consent was obtained from all participants. Participants were excluded based on the following criteria: (1) missing important information, such as diagnostic status, age, or sex; (2) missing rs-fMRI or sMRI data; (3) poor quality structural scans and poor alignment; and (4) head motion parameters larger than 3 mm or 3°. Finally, 868 participants were included in the study, with 370 having autism and with 498 being NACs. Six of the seven sites collected scores of ADI-R interview. Their demographics are shown in Table 1 and online Supplementary Table S2.
Table 1. Demographic characteristics of each site
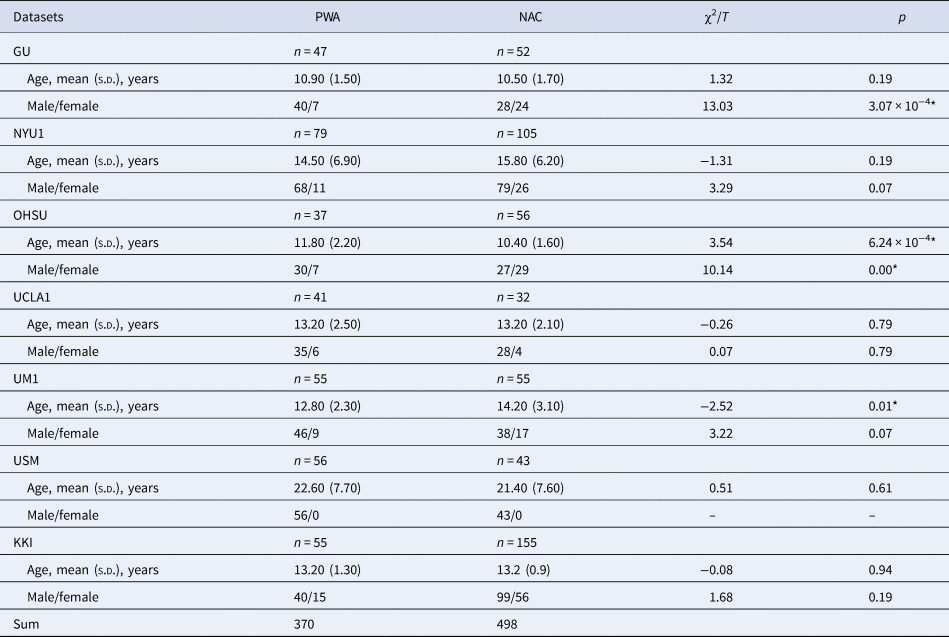
PWA, people with autism; NAC, non-autistic control; s.d., standard deviation.
Note. The two columns χ2/Tand p represent the χ2 statistic of sex and two-sample t test of age and the corresponding p value. An asterisk was marked if p value was less than 0.05.
MRI acquisition and preprocessing
The MRI data scanner and scanning parameters are available from the website of the ABIDE project (https://fcon_1000.projects.nitrc.org/indi/abide/). The detailed imaging acquisition parameters are available in the online Supplemental materials. For the rs-fMRI data of each site, data preprocessing was conducted using Statistical Parametric Mapping (SPM12) (http://www.fil.ion.ucl.ac.uk/spm/) and Data Processing Assistant for Resting-State fMRI (Chao-Gan & Yu-Feng, Reference Chao-Gan and Yu-Feng2010). First, the data were slice time corrected, motion corrected, and standardized to the Montreal Neurological Institute (MNI) space. Smoothing was then conducted to reduce the influence of spatial noise via a Gaussian filter with a 4 mm full width at half maximum value. Second, linear trends and nuisance covariance were removed to eliminate the noise remaining after realignment or instrumental instability. These nuisance covariates included Friston's 24 head motion parameters, global mean signal, white matter signal, and cerebrospinal fluid signal (Murphy & Fox, Reference Murphy and Fox2017; Power, Schlaggar, & Petersen, Reference Power, Schlaggar and Petersen2015). Finally, filtering was performed to reduce low-frequency and high-frequency noise outside the frequency range of 0.01–0.1 Hz. To calculate the value of ReHo, we performed another preprocessing step that did not include the smoothing step.
For the sMRI, data preprocessing was conducted using SPM12 with a voxel-based morphometry toolbox (http://dbm.neuro.uni-jena.de/vbm/) with default settings, including the use of high-dimensional spatial normalization with an already integrated Diffeomorphic Anatomical Registration Through Exponentiated Lie Algebra (DARTEL) template in the MNI space. Tissue segmentation was first performed for the classification of the brain into gray matter, white matter, and cerebrospinal fluid. The flipping of gray matter segments was performed to calculate the asymmetry index (AI). Then, a symmetric DARTEL template was created, and the original and flipped gray matter segments were registered to the template. Finally, spatial smoothing was performed to increase the signal-to-noise ratio.
Calculation of three cortical regional measures
After structural and functional data preprocessing, the second version of the automated anatomical labeling atlas (Rolls, Joliot, & Tzourio-Mazoyer, Reference Rolls, Joliot and Tzourio-Mazoyer2015) was used to parcellate the whole brain into 120 regions of interest (ROIs), including 56 regions for each hemisphere and eight vermis partitions. We ignored regions of the vermis, since our study focused on asymmetry of the left and right hemispheres (Rolls et al., Reference Rolls, Joliot and Tzourio-Mazoyer2015). Thus, cortical regional measures were obtained for each of the 112 regions (56 per hemisphere). The full names and abbreviations of the 56 ROIs are listed in online Supplementary Table S1.
For the preprocessed sMRI data, the average GMV of each ROI was extracted as a measure of brain structure. For the preprocessed fMRI, two commonly used measures (fALFF and ReHo) were extracted for each ROI. A detailed introduction to fALFF and ReHo can be found in the online Supplementary materials.
Calculation of AI
For each of the three regional measures (GMV, fALFF, and ReHo), the AI was defined as follows (Shaw et al., Reference Shaw, Lalonde, Lepage, Rabin, Eckstrand, Sharp and Rapoport2009):

where L and R represent the left and right regional measures, respectively. AI measures the degree of asymmetry of the left–right hemisphere and falls within range of [−2, 2]. The positive AI indicates leftward lateralization, and a negative AI indicates rightward lateralization. By calculating the average AI of the 56 ROIs, we obtained the average AI of the whole brain, which measures the overall lateralization of the brain and has been studied extensively (Kong et al., Reference Kong, Mathias, Guadalupe, Abé, Agartz, Akudjedu and Orhan2018; Okada et al., Reference Okada, Fukunaga, Yamashita, Koshiyama, Yamamori, Ohi and Hashimoto2016; Wyciszkiewicz & Pawlak, Reference Wyciszkiewicz and Pawlak2014).
Meta-analysis
Meta-analysis based on SMD in lateralization
We fitted a multiple regression model separately for each regional functional measure (ALFF or ReHo) or structural measure (GMV) within each site as follows:

where group and gender represent the diagnostic status (1 = autism, 0 = NAC) and gender (1 = male, 0 = female) at each site, respectively. Age-squared was added to remove the influence of any residuals that were not explained by the linear term used in previous studies (Kong et al., Reference Kong, Mathias, Guadalupe, Abé, Agartz, Akudjedu and Orhan2018). The t statistic for the regression coefficient β 1 was used to calculate Cohen's d (Nakagawa & Cuthill, Reference Nakagawa and Cuthill2007), which measures the effect size on hemispheric lateralization in people with autism:

where n c and n p are the sample size of people with autism and NAC at a given site, respectively; and d is the degree of freedom of the t statistic. The pooled effect size of all sites was the weighted sum of the effect sizes of a single site (Borenstein, Hedges, Higgins, & Rothstein, Reference Borenstein, Hedges, Higgins and Rothstein2010):

where ω i = 1/V i is the weight of the i-th site, V i is the variance of the overall error of the i-th site, and d i is the effect size of the i-th site.
The following statistics can be used to test the significance of the pooled effect size:

The Z statistic obeyed the standard normal distribution, and the p value was given by p = 2(1 − Φ(|Z|)) (Borenstein et al., Reference Borenstein, Hedges, Higgins and Rothstein2010). As for the regional pooled effect size, the Benjamini–Hochberg false-discovery rate (BH-FDR) correction (Benjamini & Hochberg, Reference Benjamini and Hochberg1995) was used to control the probability of making the first type of error.
Meta-analysis based on s.d. in lateralization
We further used a meta-analysis based on s.d. to investigate the variance-based differences in the hemispheric lateralization of the brain structure and function in people with autism. For each AI of the 56 ROIs at each site, the effects of age and gender were first regressed out, as shown in equation (2). The relative variability in people with autism compared with the NACs can be quantified using the variability ratio (VR) as follows:

where ‘ln’ is the natural logarithm; $\hat{\sigma }_p$ and $\hat{\sigma }_c$
 are the unbiased estimates of the population s.d. for the people with autism and NACs, respectively; S p and S c are the reported s.d.s; and n p and n c are the sample sizes.
Similar to the pooled effect of SMD, the pooled effect size of the s.d. was obtained as follows:

For convenience of explanation, the pooled effect sizes for lnVR(i.e. $pooled\_\ln VR$ ) were transformed back to a linear scale as follows (Brugger & Howes, Reference Brugger and Howes2017):

Thus, a VR value greater than 1 indicates greater relative variability in patients, and a value less than 1 indicates lower variability.
Likewise, the following statistics can be used to test the significance of the pooled effect size:

Similar to the pooled effect of SMD, the BH-FDR correction was used to control the probability of making the first type of error.
Heterogeneity test
The differences among studies from different sites included in the meta-analysis, referred to as heterogeneity (or inconsistency), are commonly measured usingQ statistics and I 2 statistics (Cochran, Reference Cochran1954; Freeman, Hedges, & Olkin, Reference Freeman, Hedges and Olkin1986; Higgins, Thompson, Deeks, & Altman, Reference Higgins, Thompson, Deeks and Altman2003). The calculations of the Q statistics and I 2 statistics can be found in the online Supplementary materials. The I 2 values of 0, 25, 50, and 75% indicate no, low, moderate, and high inconsistencies, respectively (Higgins et al., Reference Higgins, Thompson, Deeks and Altman2003).
Correlation analysis
The Pearson correlation coefficient was calculated to study the following three relationships: (1) the relationship between the pooled effect of SMD and the pooled effect of s.d., (2) the relationship between structural and functional lateralization, and (3) the relationship between hemispheric lateralization and clinical features. Since only six sites had clinical symptom scores from differences in social interaction (ADI-A), communication (ADI-B), and repetitive behaviors (ADI-C) (online Supplementary Table S2), the third analysis was focused on six sites.
Functional annotation analysis
The Brain Annotation Toolbox (BAT) (Liu et al., Reference Liu, Rolls, Liu, Zhang, Yang, Du and Feng2019) was used to explore and tag the putative difference of brain regions with atypical lateralization revealed by the meta-analysis based on SMD and s.d.. The BAT was implemented as a free and open-source MATLAB toolbox and is publicly available at http://123.56.224.61:1313/post/bat. By performing multiple permutations, we identified the brain functions associated with the given ROIs and the corresponding p values.
Results
Demographic characteristics
The demographic characteristics for all sites are presented in Table 1. There were no significant age differences between the autism and NAC groups, except for those in OHSU and UM1 sites. Moreover, there were no significant sex differences, except for those in GU and OHSU (p < 0.05).
Meta-analysis based on SMD
Meta-analysis of structural lateralization
After correcting for multiple comparisons ($p\_fdr \le 0.05$ ), the GMV of 85% of the ROIs (48/56) showed statistically significant lateralization effects in the meta-analysis based on SMD in people with autism (Fig. 1a and online Supplementary Table S3). The cerebellum, caudate nucleus, posterior cingulate gyrus, and lentiform nucleus as ROIs showed significant leftward lateralization in people with autism. Significant rightward lateralization was observed in the anterior and medial cingulate gyrus; superior, medial, and inferior temporal gyrus; lateral orbitofrontal cortex; fusiform gyrus; hippocampus; supplementary motor area; and para-hippocampal gyrus. All ROIs, except for the lateral orbitofrontal cortex (Q = 12.88, p = 0.045, I 2 = 45.64%) and caudate nucleus (Q = 15.083, p = 0.019, I 2 = 53.59%), showed low heterogeneity across different sites, as presented in online Supplementary Table S3.
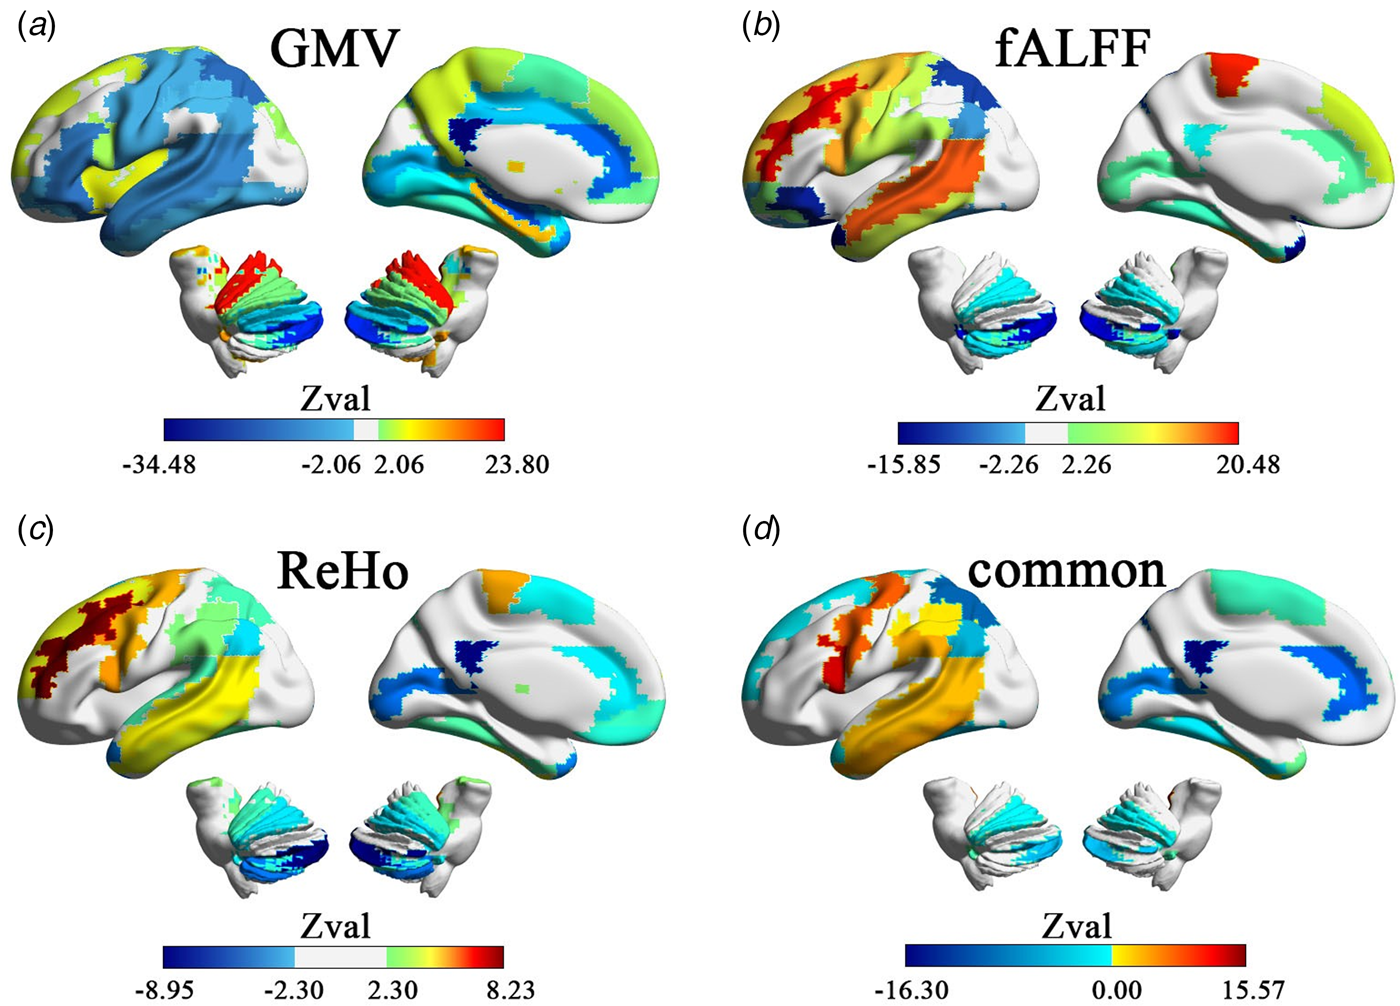
Fig. 1. Hemispheric lateralization based on SMD on structural and functional measures. (a)–(c) The areas with significant hemispheric lateralization measured by GMV, fALFF and ReHo. (d) Regions with overlapping atypical structural and functional lateralization in autism-produced common structural and functional SMD maps. The warm color area (red) indicates that people with autism have more leftward lateralization than (NACs, and the cool color area (blue) indicates that people with autism have more rightward lateralization than NACs.
Meta-analysis of functional lateralization
At the brain function level, after correcting for multiple comparisons ($p\_fdr \le 0.05$ ), the fALFF of 51% of the ROIs (29/56) showed a statistically significant leftward or rightward lateralization in people with autism, as revealed by the meta-analysis based on SMD (Fig. 2b and online Supplementary Table S4). After correcting for multiple comparisons ($p\_fdr \le 0.05$
 ), the ReHo of 51% of the ROIs (29/56) showed statistically significant leftward or rightward lateralization in people with autism, as revealed by the meta-analysis based on SMD (Fig. 2c and online Supplementary Table S5). Similarly, the lateralization effect sizes of fALFF and ReHo showed no heterogeneity in any brain region (online Supplementary Tables S4 and S5).
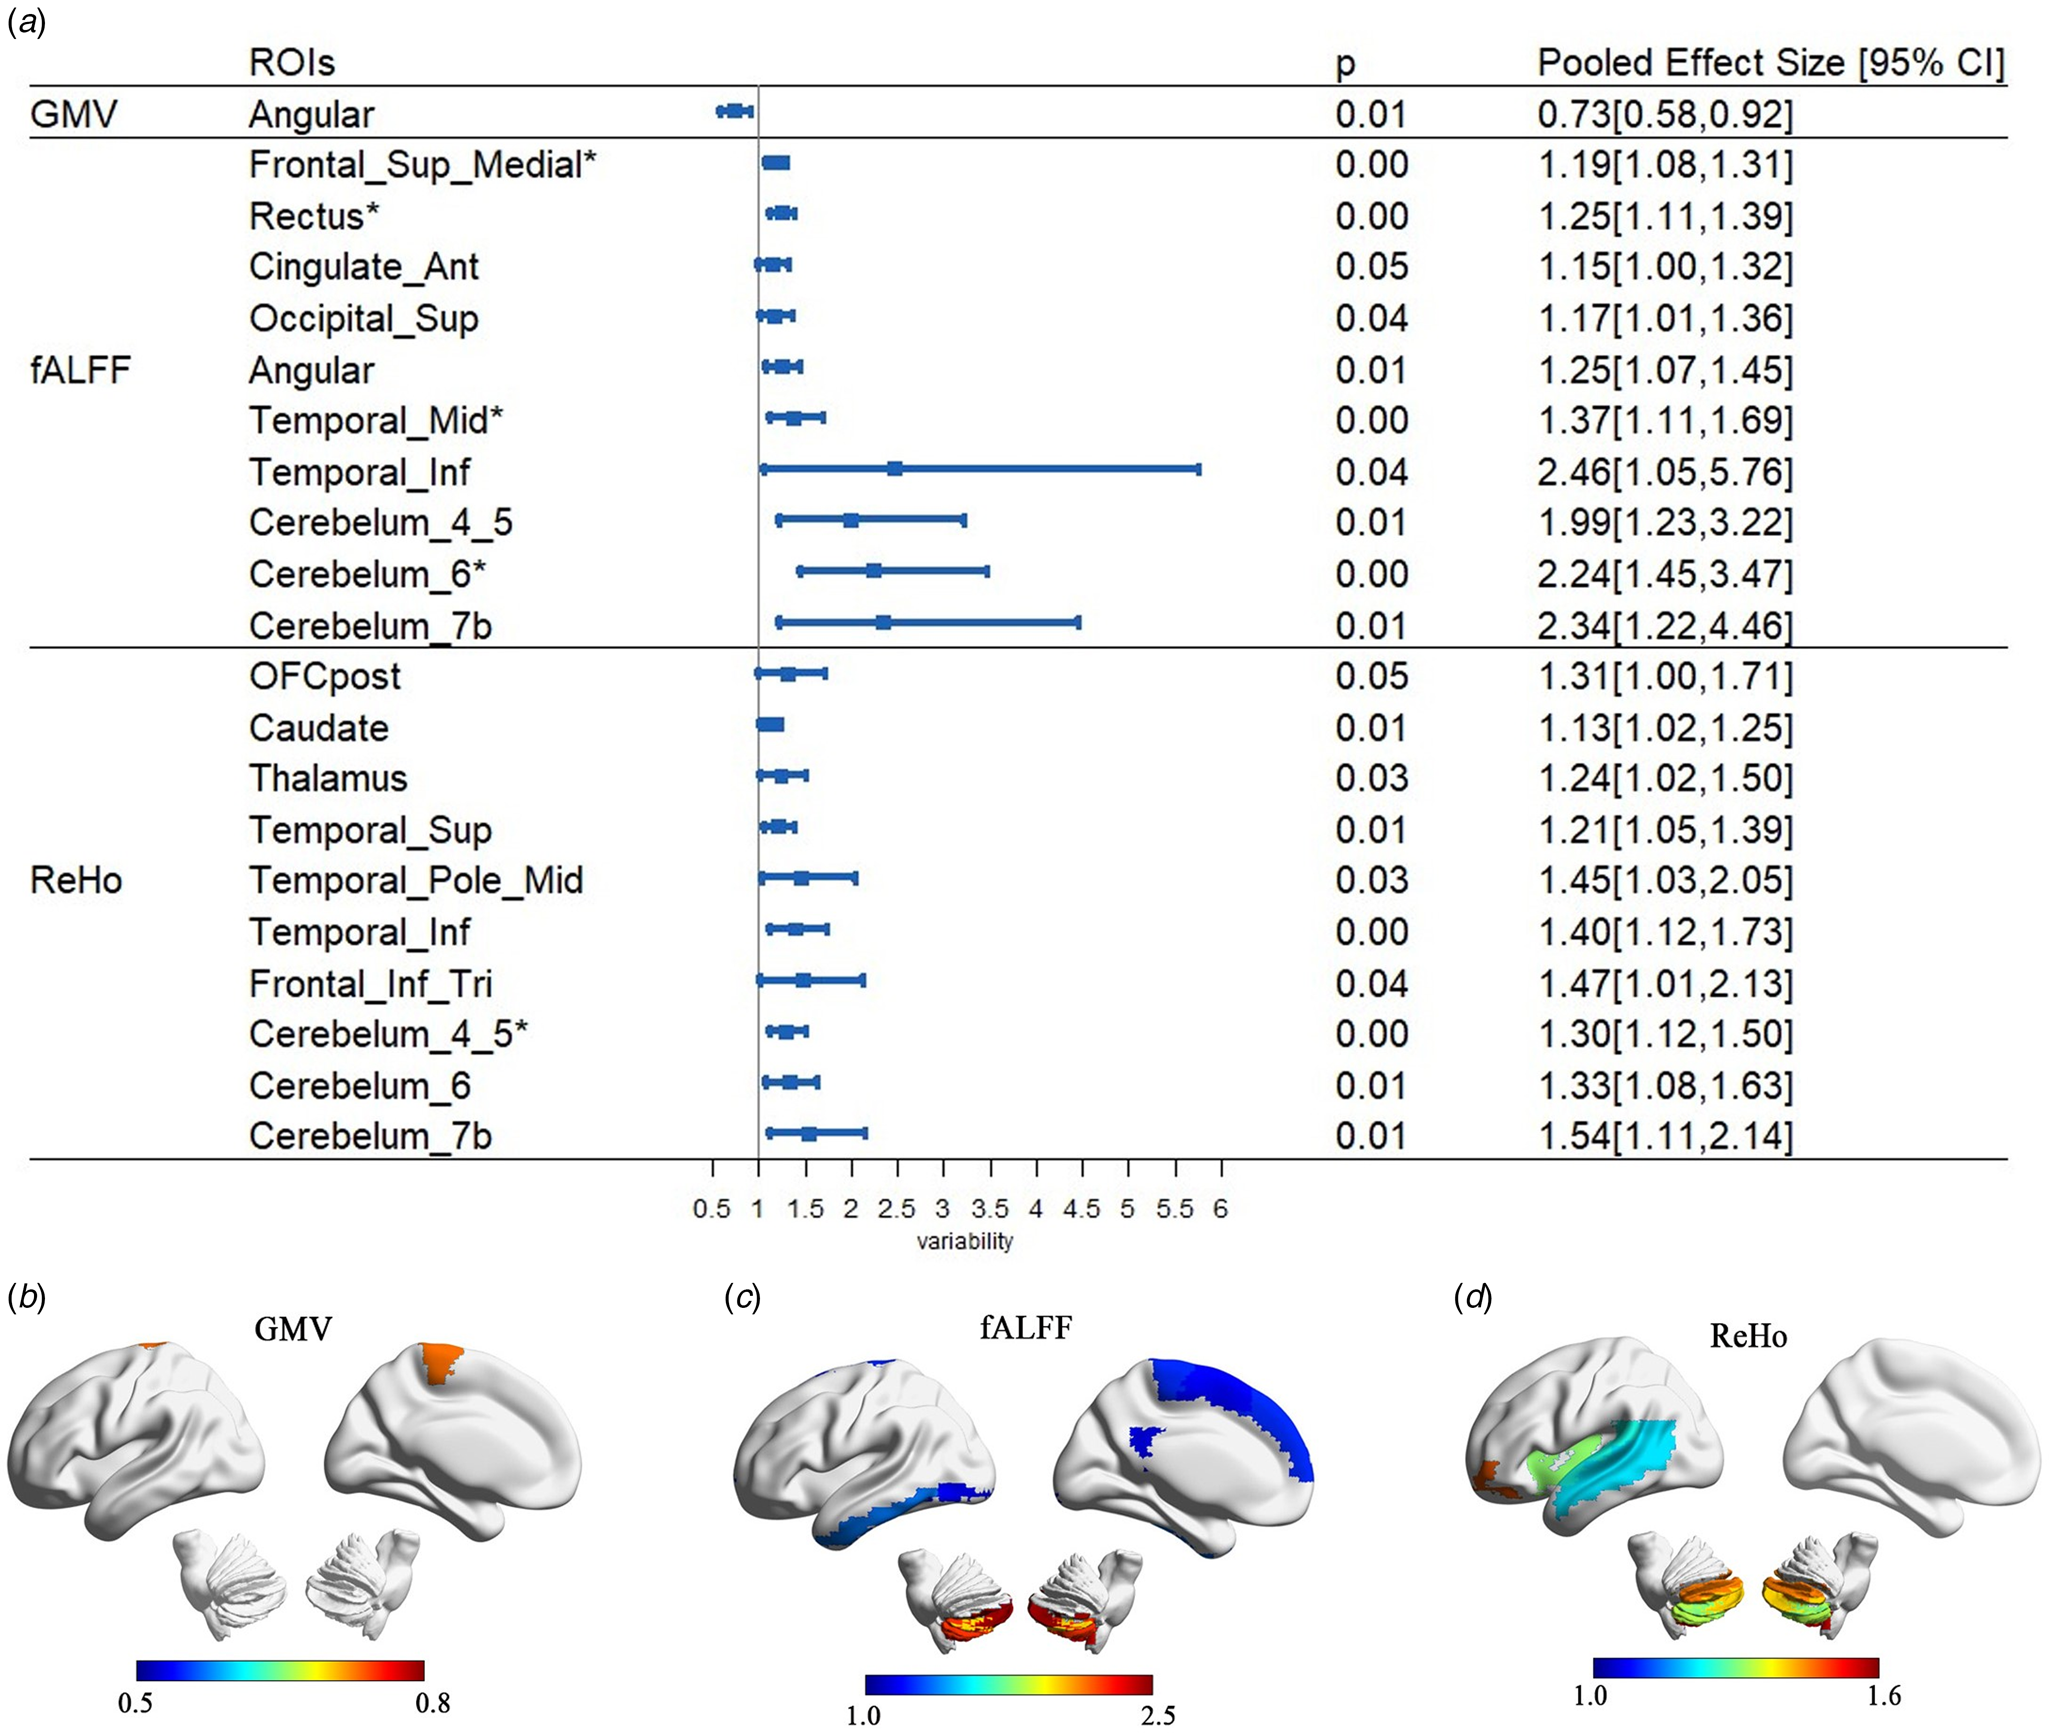
Fig. 2. Variance-based differences in hemispheric lateralization of brain structure and function in people with autism. (a) ROIs with significantly different variability in AI and the corresponding p value and pooled effect size. (b)–(d) Visualization of ROIs with significant variation difference in lateralization for GMV, ALFF, and ReHo, respectively. Heat map refers to effect sizes, with warm color indicating lower variability in autism, while cooler colors reflect higher variability autism compared to NAC subjects.
Overlapping atypical structural and functional lateralization based on SMD
To discover regions with atypical asymmetries at both the structural and functional levels, we summarized overlapping brain regions that exhibited significant laterality differences in all three measures (GMV, fALFF, and ReHo). For the three regional measures (GMV, fALFF, and ReHo), 35.7% of the ROIs (20/56) showed overlapping differences in lateralization based on SMD (Fig. 2d and Table 2). Of these, most (13/20) had autism-related structural and functional differences in asymmetry in the same direction. Higher rightward lateralization in autism was seen in the orbital posterior frontal gyrus, anterior and lateral cingulate gyrus, para-hippocampal gyrus, middle occipital gyrus, fusiform gyrus, parietal and inferior marginal angular gyrus, and temporal pole (superior temporal gyrus, inferior temporal gyrus, and cerebellar_3), while four regions, namely, dorsolateral superior frontal gyrus, orbital inferior frontal gyrus, angular gyrus, and cerebellar_9, showed higher leftward lateralization in the three regional measures. Seven regions showed internal disagreement between structural and functional measures (see Table 2). For all measures, the regions with overlapping lateralization differences based on SMD displayed low heterogeneity, as shown in Table 2.
Table 2. ROIs and pooled effect size with atypical lateralization measured by GMV, fALFF, and ReHo
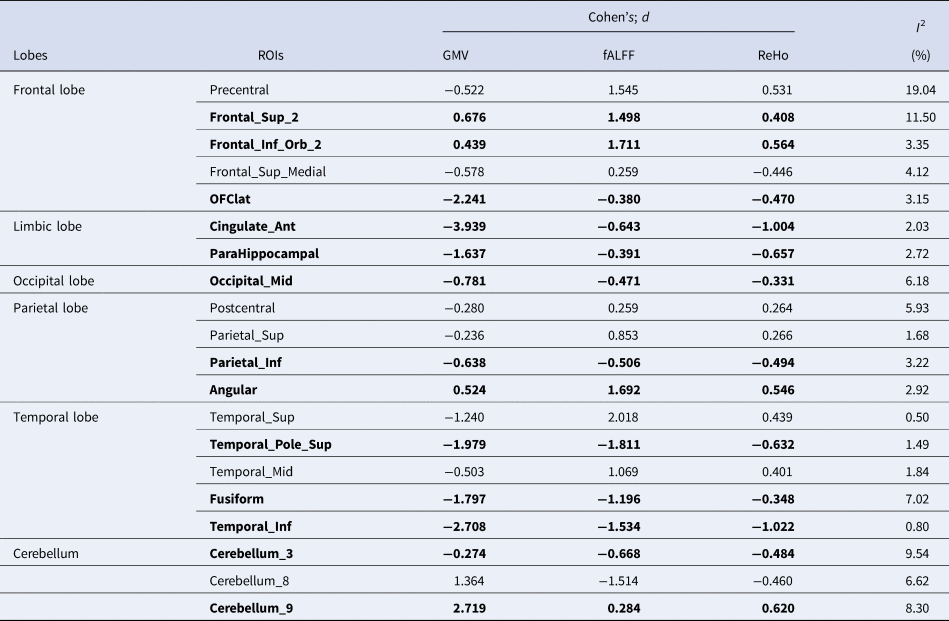
Note. The bold fonts are used to highlight ROIs that show significant changes in the same direction of lateralization across three cortical area measures (GMV, fALFF, ReHo).
Meta-analysis based on s.d.
For the GMV measure, only one region showed a significantly lower variation in lateralization among people with autism (angular gyrus, $pooled\_VR = 0.73, \;p = 0.007$ ) (Fig. 3). For the fALFF and ReHo, 10 ROIs showed significantly higher variation in lateralization in both measures in people with autism (Fig. 3). Among these, four survived BH-FDR correction (medial superior frontal gyrus, $p\_fdr = 0.009$
 ; rectus gyrus, $p\_fdr = 0.006$
 ; middle temporal gyrus, $p\_fdr = 0.041$
 ; and cerebellum6, $p\_fdr = 0.008$
 ) for fALFF, and one region (cerebellum4_5:$p\_fdr = 0.034$
 ) for ReHo.
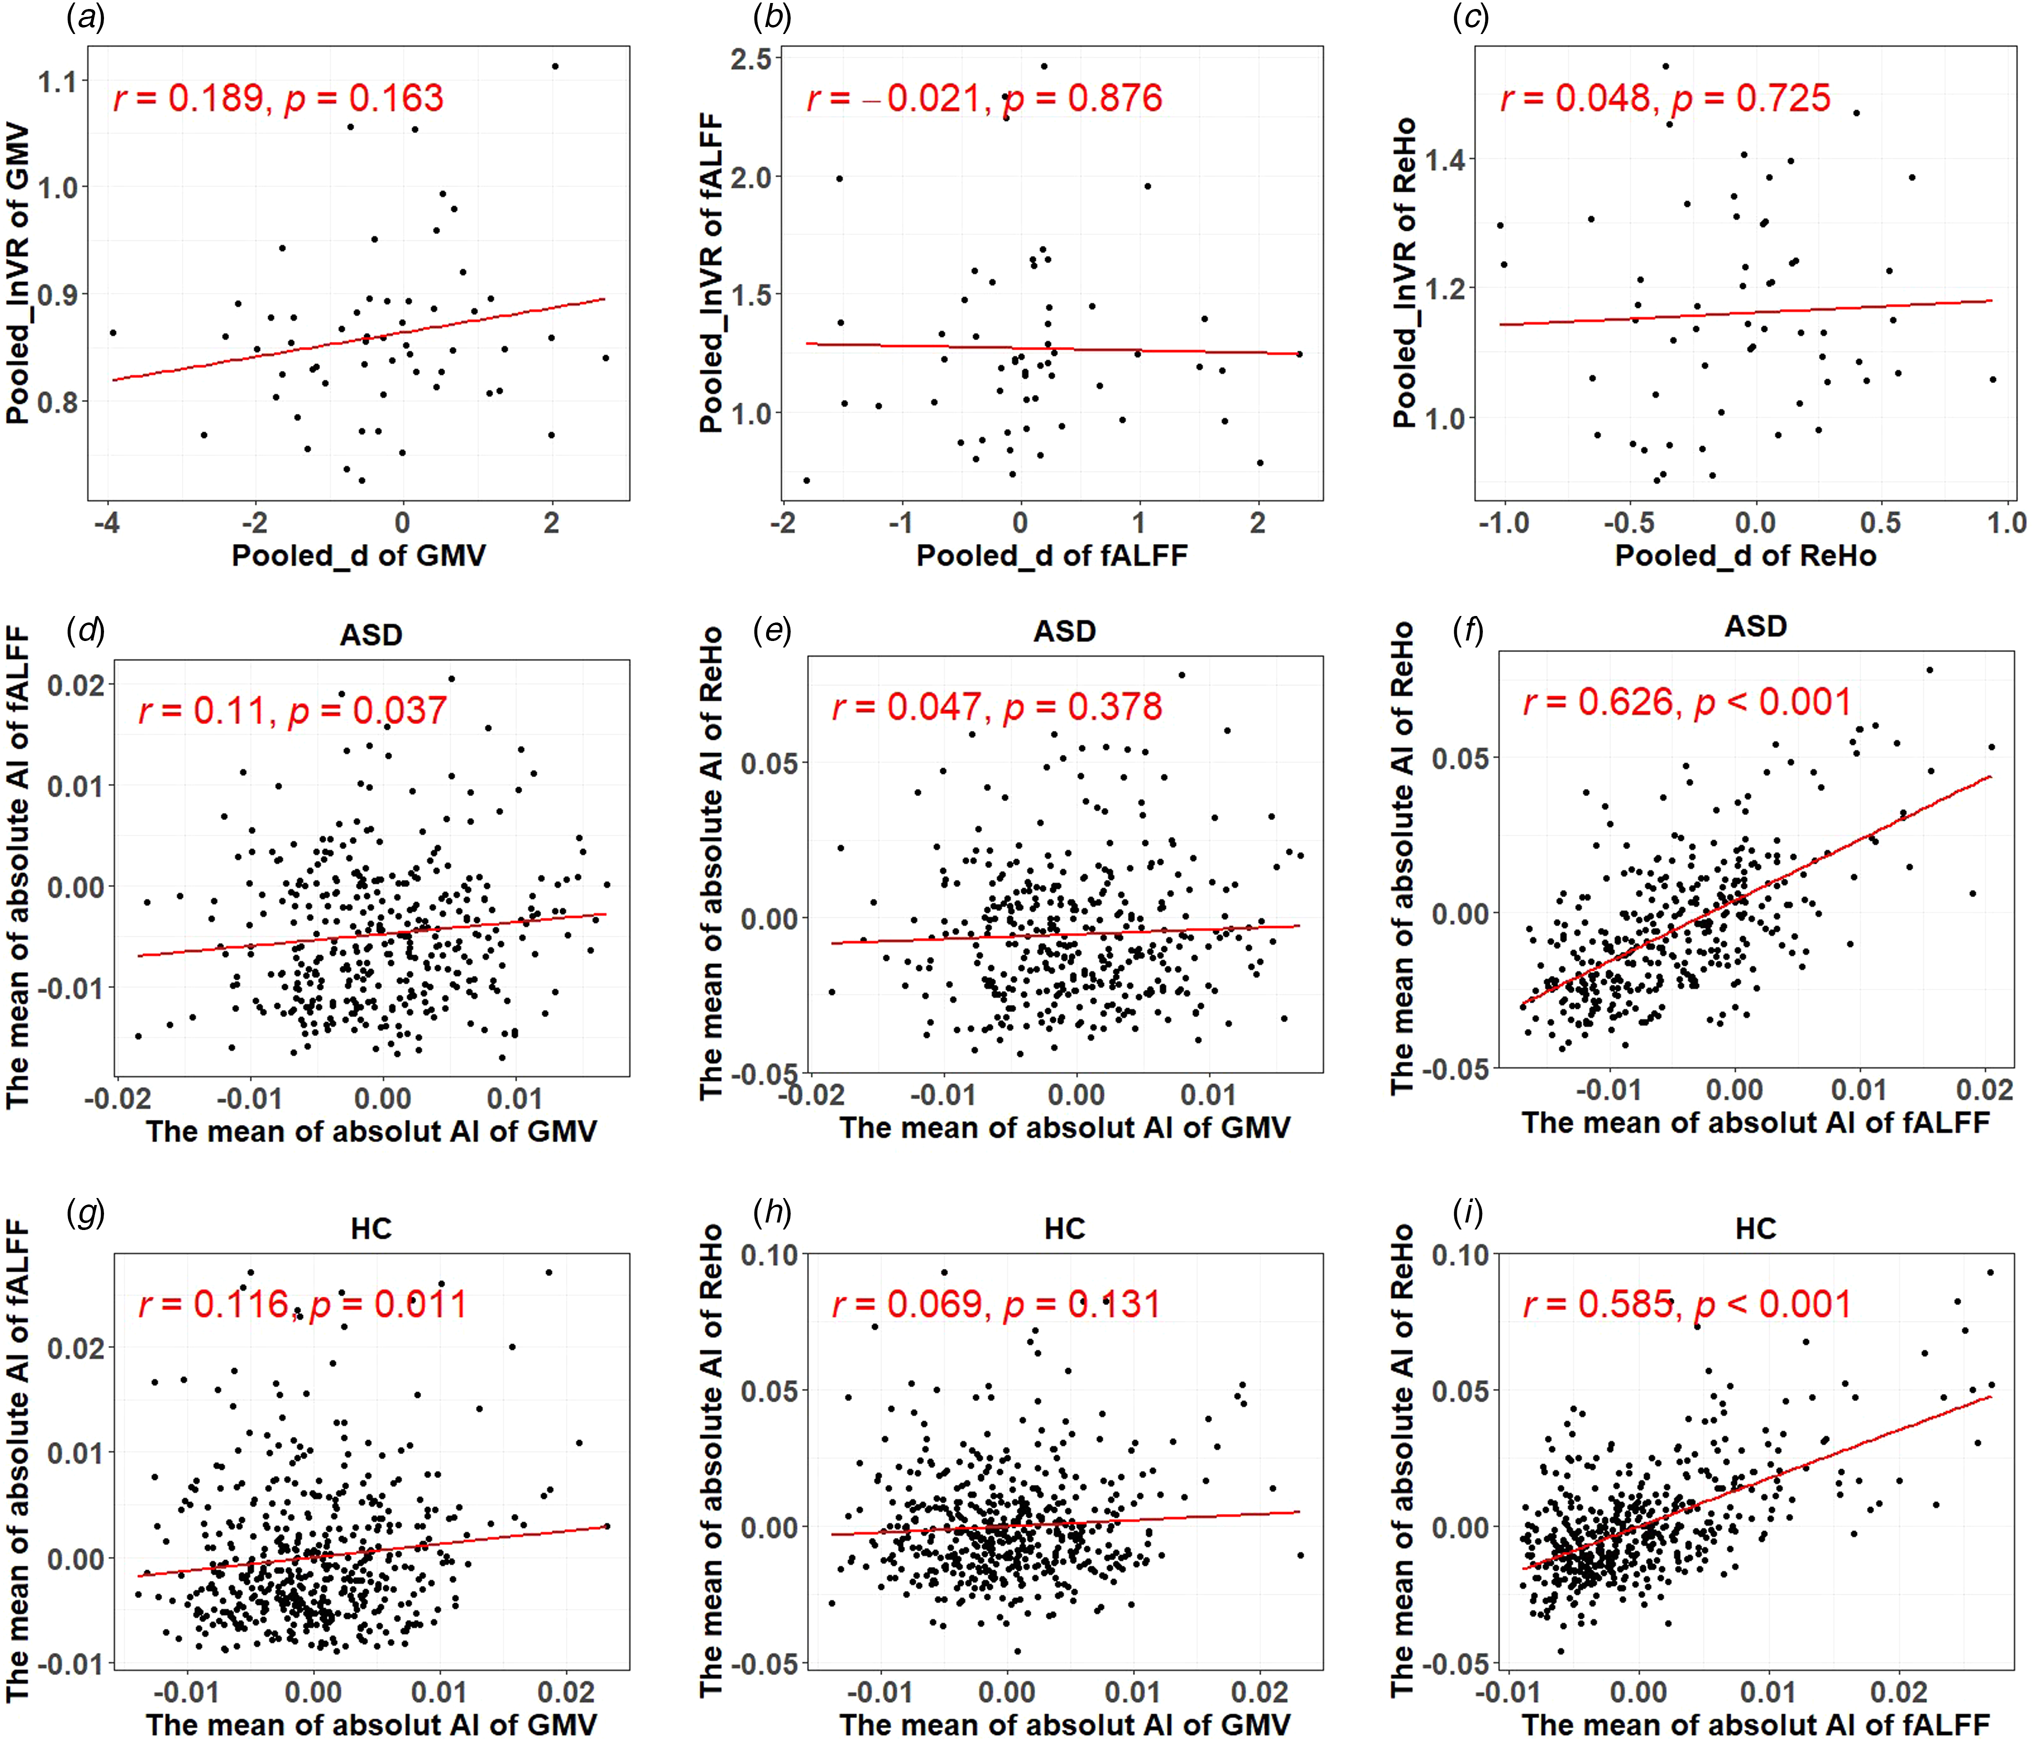
Fig. 3. Results of correlational analyses. (a)–(c) The relationship between the pooled effect size based on SMD and s.d. measured by GMV, fALFF, and ReHo, respectively. (d)–(i) The relationship between structural and functional lateralization measures and two functional lateralization measures.
In terms of statistical heterogeneity, two regions (medial superior frontal gyrus: I 2 = 0, rectus gyrus: I 2 = 20.87%) had lower heterogeneity for fALFF, and two regions (caudate nucleus: I 2 = 0, cerebellum_4_5: I 2 = 0) had lower heterogeneity for ReHo, as shown in online Supplementary Table S6.
Correlation analysis
As shown in Fig. 3a–c, there was no significant correlation between the pooled effect size based on SMD and the pooled effect size based on s.d. for all three cortical area measures (i.e. GMV, fALFF, and ReHo), indicating that increase in inter-individual variability of asymmetry was not able to explain the degree of atypical laterality seen in autism.
There was a significant but small positive relationship between the lateralization of the GMV and fALFF measures (r = 0.110, p = 0.037 for people with autism:r = 0.116, p = 0.011 for NACs) but a larger positive relationship in the lateralization of the fALFF and ReHo measures (r = 0.626, p < 0.001 for people with autism; r = 0.585, p < 0.001 for NACs). There was no significant relationship between the lateralization of the GMV and ReHo measures (r = 0.047, p = 0.378 for people with autism;r = 0.069, p = 0.131 for NACs), as shown in Fig. 3d–i.
As listed in Table 3, there was a significant positive correlation between the hemispheric lateralization of the GMV and the differences in social interaction (ADI-A), communication (ADI-B), and repetitive behaviors (ADI-C) in the lateral orbitofrontal cortex, medial superior frontal gyrus, and superior and inferior temporal gyrus. There was also a significant positive correlation between the lateralization of the fALFF and the differences in communication (ADI-B) and repetitive behaviors (ADI-C) in the lateral orbitofrontal cortex and anterior cingulate. In addition, we found a significant positive correlation between the lateralization of ReHo and differences in repetitive behaviors (ADI-C) in the anterior cingulate.
Table 3. ROIs with a significant correlation between the absolute AIs of brain structure, function, and autism behavioral measures
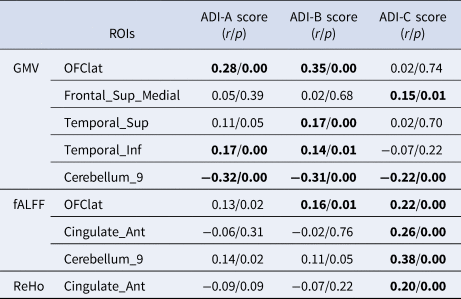
Note. ADI-A score represents differences in social interaction. ADI-B score represents differences in communication. ADI-C score represents differences in repetitive behaviors. Bold font indicates that the test p value is less than 0.05.
Functional annotation analysis
Using the BAT, the different ROIs revealed by the meta-analysis based on SMD were significantly associated with five functions, namely, illusion, motion, moving, percept, and speech sounds ($p\_fdr < 0.05$ ). Similarly, the different ROIs revealed by the meta-analysis based on s.d. were significantly associated with seven functions, namely, auditory and visual function, communication, emotion, object recognition, perception, memory, and language (Fig. 4 and online Supplementary Table S7).
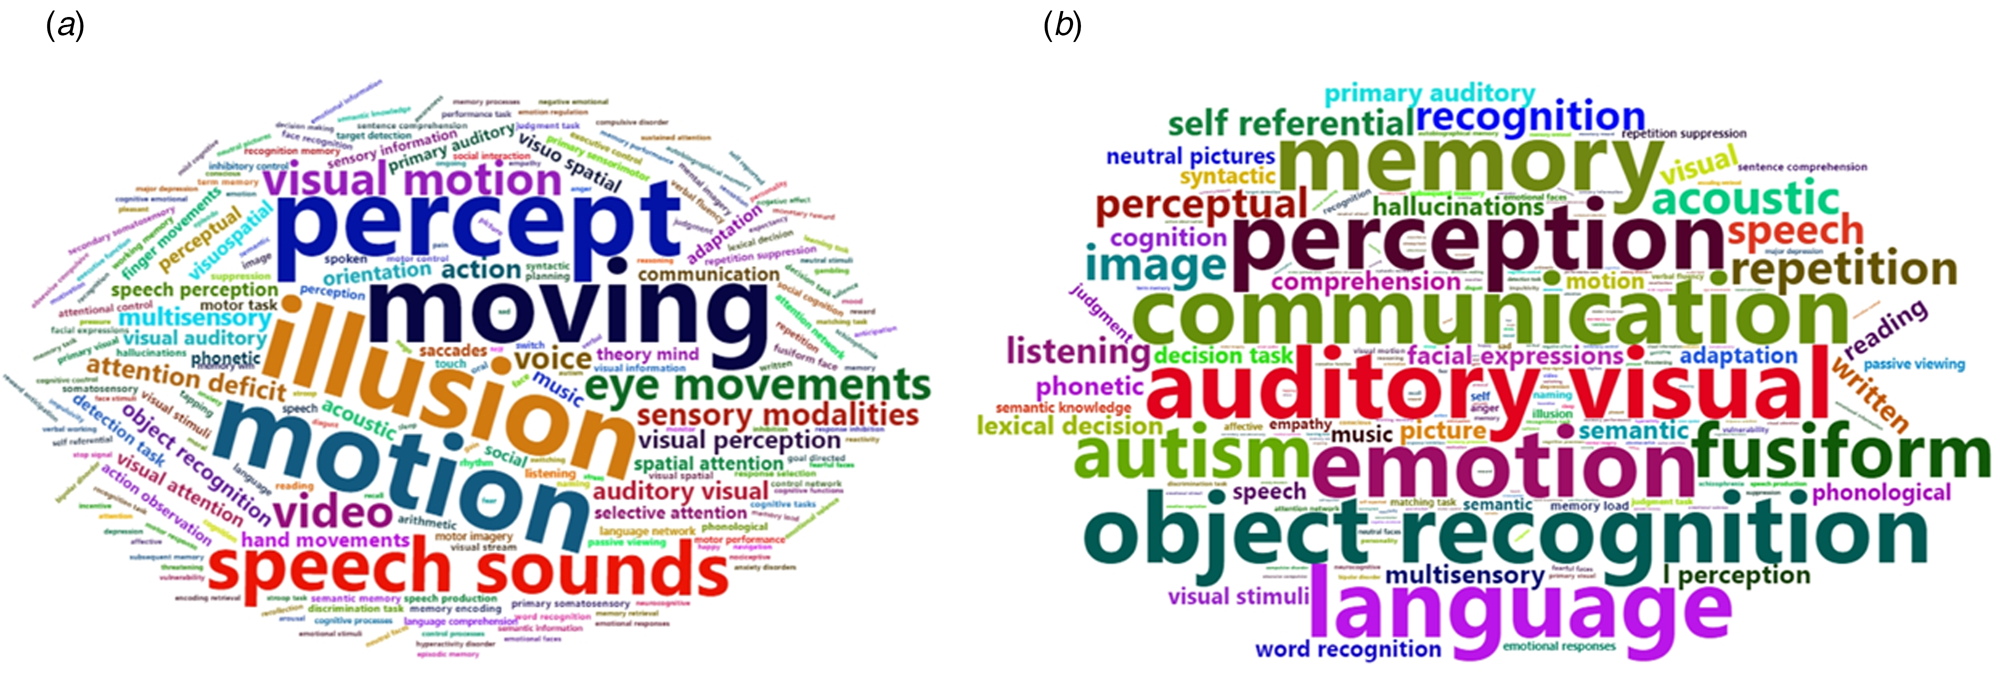
Fig. 4. Word cloud of function annotation based on SMD (a) and s.d. (b). (a) The different ROIs revealed by the meta-analysis based on SMD were significantly associated with five functions, namely, illusion, motion, moving, percept, and speech sounds. (b) The different ROIs revealed by the meta-analysis based on s.d. were significantly associated with seven functions, namely, auditory and visual function, communication, emotion, object recognition, perception, memory, and language.
Discussion
We report widespread, atypical hemispheric lateralization, concurrently affecting brain structure and function in people with autism, using a meta-analysis approach multisite MRI datasets. Hemispheric lateralization was measured using three cortical regional measures (i.e. GMV, fALFF, and ReHo) concurrently for the first time in autism.
We report three major findings: (1) differences in structural laterality (48/56 regions) are more widespread than functional differences (29/56 regions) notable at rest. (2) Any differences in functional lateralization of activation and connectivity closely relate to the changes in structural laterality. Of the 29 regions showing functional laterality differences in autism, 20 also showed atypical laterality in structure and in most cases the changes in function were in the same direction as the changes in structure, suggesting that structural deviations, likely to be developmental, may be a primary feature of atypical asymmetry in autism. (3) We observe a notably higher variance of functional (but not structural) asymmetry in autism, indicating that atypical lateralization in structure may be a primary, invariant feature affecting most people with autism, while functional differences are highly variable among individuals. The regions affected by laterality differences play a key role in language, movement, perception, auditory and visual function, memory, and communication, corroborating our observed correlation between ADI scores in various domains and differences in laterality. By demonstrating that the widespread atypicalities in structural asymmetry are not associated with higher than expected within-group variance, our findings provide an important clue that the neurobiological heterogeneity in autism is likely to be more functional in nature.
Overlapping atypical hemispheric lateralization based on SMD
For all three regional measures, 20 ROIs showed overlapping atypical lateralization based on SMD in people with autism. These ROIs included orbital inferior and posterior frontal gyrus; dorsolateral superior and medial superior frontal gyrus; superior, middle, and inferior temporal gyrus; middle occipital gyrus; superior parietal gyrus; cingulate gyrus; para-hippocampal gyrus; fusiform gyrus; angular gyrus; precentral gyrus; and postcentral gyrus. These brain regions cover almost all lobes, which is consistent with previous findings that autism is characterized by widespread cortical changes and a wide range of comorbidities in neurocognitive disorders (Hawco et al., Reference Hawco, Yoganathan, Voineskos, Lyon, Tan, Daskalakis and Ameis2020). Among them, the orbital posterior frontal gyrus and inferior frontal gyrus are part of Broca's area, and the superior and inferior temporal gyrus and the parietal and inferior angular gyrus are part of Wernicke's area (Cardinale et al., Reference Cardinale, Shih, Fishman, Ford and Müller2013; Gage et al., Reference Gage, Juranek, Filipek, Osann, Flodman, Isenberg and Spence2009; Itahashi et al., Reference Itahashi, Yamada, Watanabe, Nakamura, Ohta, Kanai and Hashimoto2015; Paakki et al., Reference Paakki, Rahko, Long, Moilanen, Tervonen, Nikkinen and Kiviniemi2010). Broca's and Wernicke's areas are important language control areas of the human brain and are involved in the processing and understanding of language information and the generation of words (Mesulam et al., Reference Mesulam, Rader, Sridhar, Nelson, Hyun, Rademaker and Rogalski2019; Połczyńska et al., Reference Połczyńska, Beck, Kuhn, Benjamin, Ly, Japardi and Bookheimer2021; Young, Lee, & Chang, Reference Young, Lee and Chang2021). Previous studies have shown that despite similar features at the time of diagnosis, approximately 30% of children with autism remain non-verbal in adulthood (Hus, Pickles, Cook, Risi, & Lord, Reference Hus, Pickles, Cook, Risi and Lord2007) while 30% of people with autism show verbal IQ in non-autistic range (Anderson et al., Reference Anderson, Lord, Risi, DiLavore, Shulman, Thurm and Pickles2007). In our study, the atypical hemispheric lateralization of brain structure and brain function was significantly positively correlated with differences in social reciprocity and communication in Broca's and Wernicke's areas. This result confirmed that atypicalities in the asymmetry of these areas may cause autism features.
Besides language, the results of the functional annotation analysis showed involvement of regions relevant for motor and sensory perceptual functions in the atypical lateralization seen in autism. Previous research has shown that people with autism also present differential abilities to ‘mindread’, where differences in understanding of other people's feelings, beliefs, or emotions influence subsequent responses to them (Baron-Cohen, Reference Baron-Cohen1995). Another study suggested that formal thought disturbances are a feature of autism that relates more closely to the degree of language differences (Solomon, Ozonoff, Carter, & Caplan, Reference Solomon, Ozonoff, Carter and Caplan2008). However, the study by Weisbrot and colleagues (Weisbrot, Gadow, DeVincent, & Pomeroy, Reference Weisbrot, Gadow, DeVincent and Pomeroy2005) demonstrated that this may relate to higher levels of anxiety. Difference movements are another typical feature of autism. Within the International Statistical Classification of Diseases and Health Related Problems-10th revision criteria (WHO, 1992) and the Diagnostic and Statistical Manual of Mental Disorders-(DSM-IV-TR), 4th edition (Association, 2000), movement impairment is defined as the focused, repetitive, and stereotyped patterns of behavior, interests, and activities, which constitute the core features of autism.
Atypical hemispheric lateralization based on s.d.
There was a significantly lower variability in the lateralization of brain structure in the angular gyrus and significantly higher variability in the lateralization of brain function in those areas involving the orbital posterior and medial superior frontal gyrus, inferior frontal gyrus of triangle, middle and inferior temporal gyrus, superior occipital gyrus, cingulate gyrus, rectus gyrus, angular gyrus, caudate nucleus, and thalamus, which were mainly distributed in Broca's and Wernicke's areas, with the function of mainly controlling the motor language center and auditory center (Mesulam et al., Reference Mesulam, Rader, Sridhar, Nelson, Hyun, Rademaker and Rogalski2019; Połczyńska et al., Reference Połczyńska, Beck, Kuhn, Benjamin, Ly, Japardi and Bookheimer2021; Young et al., Reference Young, Lee and Chang2021). The results of the functional annotation analysis showed that people with autism have obvious functional differences in auditory and visual function, communication, emotion, object recognition, memory, and language.
The angular gyrus is mainly responsible for the processing of auditory information, and it affects the individual's concentration, which is often reported in the previous literature on autism. For example, a meta-analysis of children's GMV differences showed that individuals with autism generally show significant gray matter increases in the right angular gyrus (J et al., 2017). Other studies on adult autism have reported that gray matter decreases in the angular gyrus and medial superior frontal gyrus (Ecker et al., Reference Ecker, Rocha-Rego, Johnston, Mourao-Miranda, Marquand, Daly and Murphy2010; Kosaka et al., Reference Kosaka, Omori, Munesue, Ishitobi, Matsumura, Takahashi and Wada2010).
It is known that individuals with autism have difficulties in various aspects of social communication. They also have a focused imagination and social repertoire, with the latter characteristically displayed as what seems to others to be obsessional behavior and rigidity in their own behavior, as well as in the behavior they require from others in response to their own (Weisbrot et al., Reference Weisbrot, Gadow, DeVincent and Pomeroy2005). Hearing and vision, like language, are important aspects of successful participation in social communication interactions. A previous study found that when there is a defect in the visual processing function of patients with autism, especially the facial expression process, this defect further leads to barriers to social and emotional communication (Lai et al., Reference Lai, Lombardo, Suckling, Ruigrok, Chakrabarti, Ecker and Baron-Cohen2013; Rolls, Reference Rolls2014). A study on young people with autism and executive function impairment showed greater individual variability in the pattern of spatial working memory in autism v. typically developing control individuals (Hawco et al., Reference Hawco, Yoganathan, Voineskos, Lyon, Tan, Daskalakis and Ameis2020). These results are consistent with the greater individual differences in brain function of the patients in our study.
Association between hemispheric lateralization of brain structure and function
A notable correlation in hemispheric lateralization between resting blood oxygen level-dependent oscillatory amplitude (i.e. fALFF) and structure (i.e. GMV) was found; however, there was no significant correlation between localized connectivity and structure (i.e. ReHo and GMV). Some studies on lateralization in brain structure and function provide compelling evidence for the correlation between structural lateralization and cognitive function, thus supporting the ‘bigger is better’ structure–function relationship (Plessen, Hugdahl, Bansal, Hao, & Peterson, Reference Plessen, Hugdahl, Bansal, Hao and Peterson2014; Shaw et al., Reference Shaw, Lalonde, Lepage, Rabin, Eckstrand, Sharp and Rapoport2009; Toga & Thompson, Reference Toga and Thompson2003). They also raise an interesting question regarding the underlying causality. Is structural lateralization the basis or prerequisite of function, or is it only the result of functional training (Shaw et al., Reference Shaw, Lalonde, Lepage, Rabin, Eckstrand, Sharp and Rapoport2009)? In our study, the relationship of function and structure indicates that the occurrence of one structural lateralization and functional lateralization often leads to the occurrence of another. This is consistent with Mitchell and Crow's conclusion about structural and functional hemispheric equivalence (Mitchell & Crow, Reference Mitchell and Crow2005). In addition, it is likely that the typical development of gray matter lateralization may be altered in autism, leading to atypical functional brain lateralization affecting motor behavior (Di Martino et al., Reference Di Martino, Yan, Li, Denio, Castellanos, Alaerts and Milham2014). These results suggest that brain structural and functional measures are theoretically complementary, and that the combination of multimodal data is methodologically necessary for understanding symptom generation in autism. The word cloud can be seen in Fig. 4.
Limitations
This study has several limitations. First, MRI scanners and scanning parameters were different for each dataset; therefore, there was some inevitable heterogeneity among the results. Second, we failed to consider the effects of drugs, which may influence the test results of autism effects to a certain extent. Third, although the comprehensive analysis was based on the largest sample with neuroimaging information, we should note that the participants in this study were younger and that older subjects were not included. Finally, owing to the incomplete handedness information of the subjects in the dataset, the handedness of the subjects was not considered.
Conclusion
In this study, we report widespread atypical hemispheric lateralization of both structure and function in autism, involving regions in the prefrontal, limbic, occipital, and parietal lobes. Our findings indicate primary structural differences with functional asymmetry being atypical mostly in regions that are structurally affected, with these changes relating to the degree of differences in social reciprocity, communication, and motor behaviors. In conclusion, our work positions lateralized cerebral differences as critical for developing features of autism, as well as inter-individual variability in autism-related behavior. This raises the question of using the laterality indices for early detection as well as monitoring the efficacy of biological supports and services.
Supplementary material
The supplementary material for this article can be found at https://doi.org/10.1017/S0033291723000181
Acknowledgments
The authors wish to express their sincere appreciation to all those who made suggestions for improvements of this paper. Use of the ABIDE sample (http://fcon_1000.projects.nitrc.org/indi/abide/abide_I.html) is acknowledged. We also thank Ms Sabrina Ford, London, Ontario, for stylistic corrections.
Author contributions
Conceptualization: QL and SG; data acquisition: QL; formal analysis: QL and SG; funding acquisition: SG and LP; writing the original draft: QL and SG; writing-reviewing and editing: QL, SG, WZ, and LP.
Financial support
Shuixia Guo is supported by the National Natural Science Foundation of China (NSFC) grant (No. 12071124). Lena Palaniyappan acknowledges research support from Monique H. Bourgeois foundation for Developmental Disorders (Faculty of Health Sciences, McGill University) and Graham Boeckh Foundation (Douglas Research Centre, McGill University) and a salary award from the Fonds de recherche du Quebec-Santé (FRQS).
Conflict of interest
The authors declare that they have no conflict of interest.


