


Introduction
The presence of weeds in agricultural areas is one of the main factors limiting the productivity of several crops. Currently, the application of herbicides is the most-used management method for the control of these species, as it has a good cost–benefit ratio. However, the application of these products, when poorly performed, may increase the selection of herbicide-resistant plants, and it also may cause product waste, increasing costs and the risks of environmental contamination (Braga et al. Reference Braga, Barroso, Amaral, Nepomuceno and Alves2018; López-Granados Reference López-Granados2010).
Although there are some sensors available on the market for the identification of weeds, their applicability is still limited, and there is still no way to distinguish the weed species from the crop (Dammer and Wartenberg Reference Dammer and Wartenberg2007; López-Granados Reference López-Granados2010; Souza et al. Reference Souza, Amaral, Medeiros Oliveira, Coutinho and Netto2020). Thus, the improvement of techniques that aid the adoption of specific weed-species control is important to achieve increasingly sustainable agriculture, as these applications may vary according to the plant development stage and species (López-Granados Reference López-Granados2010; Souza et al. Reference Souza, Amaral, Medeiros Oliveira, Coutinho and Netto2020). In this context, near-infrared (NIR) spectroscopy can be an alternative for the identification of weed species in the field, as this technique has been widely used in monitoring and evaluating the quality of several agricultural products (Jamshidi et al. Reference Jamshidi, Mohajerani and Jamshidi2016; Nicolai et al. Reference Nicolai, Beullens, Bobelyn, Peirs, Saeys, Theron and Lammertyn2007). NIR spectroscopy in conjunction with multivariate analyses can differentiate specific sets of molecules, allowing the separation of samples into specific batches based on the “fingerprint” that each sample has and also permitting the association of data from this procedure with species’ physical and anatomic details (Soares et al. Reference Soares, Silva, Bergo, Coradin, Braga and Pastore2017).
This technique has already been successfully used to separate batches of species in nurseries, discriminate nonvisually differentiable cultivars, and identify native tree species (Borraz-Martínez et al. Reference Borraz-Martínez, Simó, Gras, Mestre and Boqué2019; Neto et al. Reference Neto, Lopes, Toledo, Zolnier and Silva2018; Soares et al. Reference Soares, Silva, Bergo, Coradin, Braga and Pastore2017; Wang and Yu Reference Wang and Yu2015). In addition, the high speed of acquisition of NIR spectra, in combination with multivariate calibration techniques, has enabled the online classification (in real time) of fruits and vegetables based on quality attributes; on the other hand, when considering only the appearance of fruit, this technique has not adequately demonstrated the ability to detect differences in quality (Cunha Júnior et al. Reference Cunha Júnior, Teixeira, Nardini and Walsh2016; Souza et al. Reference Souza, Amaral, Medeiros Oliveira, Coutinho and Netto2020).
Despite the potential for using NIR spectroscopy for species classification and characterization, there are still no calibration models and spectral databases for weed species. Thus, the application of this technique to weeds can be a potential tool in in-field differentiation and discrimination of these species. Chemometric studies are essential for this purpose, because the spectral information is complex and requires mathematical models to relate the spectra to the characteristics of interest (Pasquini Reference Pasquini2003). Such studies, combined with a large number of samples, may allow us to understand some chemical properties that will help to differentiate species more quickly at increasingly specific levels (Carvalho et al. Reference Carvalho, Schlerf, van Der Putten and Skidmore2013; López-Granados Reference López-Granados2010; Souza et al. Reference Souza, Amaral, Medeiros Oliveira, Coutinho and Netto2020).
Thus, the objective of this study was to discriminate three weed species, popularly known as morningglory (Ipomoea spp.), using NIR spectroscopy and multivariate analysis.
Materials and Methods
Plant Material
The weed species were selected according to reports on the difficulty of their control in management systems in sugarcane (Saccharum officinarum L.) crops in Sao Paulo State, Brazil. The species selected for this study were ivyleaf morningglory (Ipomoea hederifolia L.), Japanese morningglory [Ipomoea nil (L.) Roth), and hairy woodrose [Merremia aegyptia (L.) Urb.], all belonging to the Convolvulaceae family.
Seeds of these species were sown in 0.5-L plastic pots filled with washed and sieved river sand. One seed was sown per pot. All plants were grown in the experimental area of the Weed Sciences Laboratory (LAPDA) of Sao Paulo State University (Unesp/FCAV), located in the municipality of Jaboticabal, SP, Brazil (21.244473°S, 48.299123°W). The plants were cultivated from March to April 2019, and the climate of the region is Aw, according to the Köppen classification (Rolim et al. Reference Rolim, Camargo, Lania and Moraes2007). One hundred fifty pots were grown per species, totaling 450 pots. Each pot corresponded to an experimental plot (n = 450). The pots were irrigated daily with Hoagland and Arnon (Reference Hoagland and Arnon1938) complete nutrient solution. To promote the adaptation of seedlings to the nutrient solution, a gradual and weekly increase in the ionic strength of the solution was carried out. In the first week, the nutrient solution was adjusted to a concentration of 25%; in the second week, to 50%; and then consecutively until the solution reached 100% of ionic strength.
NIR Spectra Acquisition
The NIR spectra were obtained using an FT-NIR Spectrum 100N spectrometer (PerkinElmer®, Shelton, CT, USA) equipped with the NIR Fiber Optic Probe accessory. The diffuse reflectance spectra were acquired in the form of log(1/R), where R corresponds to reflectance, within the spectral band of 4,000 to 10,000 cm−1 (2,500 to 1,000 nm), with 32 scans performed at a spectral resolution of 4 cm−1 and with an interval of 2 cm−1. At the time of the NIR spectral assessment, the ambient temperature was kept at 23 ± 1 C, remaining constant throughout the spectral acquisition process (Figure 1).

Figure 1. Illustrative scheme of near-infrared (NIR) spectra collection.
The spectra were collected in the middle third of the adaxial part of the last fully expanded leaf, avoiding areas with ribs. Each plant was sampled by positioning the leaf at the exit of the light beam under a black background (of ethylene vinyl acetate) used to prevent the entry of external light (Figure 1). After collection of NIR spectra, the species were characterized as to the number of leaves and fresh and dry shoot biomass to measure the moisture of the samples. To determine dry biomass, the plants were packed in paper bags, dried in an oven with forced-air circulation at 60 C until constant mass, and then weighed on a precision electronic balance.
Development of Classification Models
Spectral data were analyzed using the software Unscrambler® v. 10.3 (CAMO, Oslo, Norway). This software was also used to do the preprocessing of the NIR spectra, that is, Standard Normal Variate (SNV), Detrend, SNV + Detrend, 1st derivative of Savitzky-Golay (1SG) grouped in six and six points and SNV + 1SG (Figure 2).

Figure 2. Multivariate analyses flowchart. SNV, Standard Normal Variate; 1SG, 1st derivative of Savitzky-Golay; PC-LDA, principal component analysis and linear discriminant analysis; PLS-DA, partial least squares regression with discriminant analysis.
A principal component analysis (PCA) of the entire NIR spectrum was performed in selected bands with and without preprocessing to measure the level of spectral variation between samples. Then, classification models were developed to discriminate species using linear principal component discriminant analysis (PC-LDA) and partial least-squares discriminant analysis (PLS-DA) (Figure 2). For this, the three species (I. hederifolia, I. nil, and M. aegyptia) were examined in different spectral bands, which were defined according to the values of the PCA loadings with the raw spectrum, without preprocessing. The selected wavelengths were (1) 4,000 to 10,000 cm−1 (2,500 to 1,000 nm); (2) 4,240 to 7,460 cm−1 (2,358 to 1,340 nm); (3) 6,800 to 7,460 cm−1 (1,471 to 1,340 nm); (4) 4,240 to 5,540 cm−1(2,358 to 1,805 nm); and (5) 6,800 to 7,460 + 4,240 to 5,540 cm−1 (1,471 to 1,340 + 2,358 to 1,805 nm).
Multivariate chemometric techniques are generally based on measuring distances between sample points. In this study, the Mahalanobis distance was chosen, because it had the smallest classification error. The Mahalanobis method considers the correlation of data, calculating the sample mean for each class and the grouped covariance matrix for each variable subset (Pontes et al. Reference Pontes, Cortez, Galvão, Pasquini, Araújo, Coelho, Chiba, Abreud and Madari2009). Ten principal components (PCs) were used, and the cross-validation was segmented randomly, that is, the model did not carry out a validation one by one, it carried out a validation by segment, considering 10% of the spectra (31 segments). Every validation step was performed using the Unscrambler® software.
The supervised models (PC-LDA and PLS-DA) were applied to the sample set of each species individually. For example, to generate a classification model for I. hederifolia, only the I. hederifolia samples were named, the rest of the sample group was called “other species.” The same approach was used for the other species. In the PLS-DA, for each sample in the calibration and validation set, a variable was assigned as a reference value indicating the class to which the sample belongs. The numerical value of 1 was assigned to one class and the value of 0 to the other class; a limit value of 0.5 (or cutoff point) was also defined to determine class assignment (Soares et al. Reference Soares, Silva, Bergo, Coradin, Braga and Pastore2017).
To divide the original spectral data (n = 450) into calibration (n = 315) and validation sets (n = 135), the Kennard-Stone (Kennard and Stone Reference Kennard and Stone1969) algorithm was used in a deterministic sequential approach. This algorithm selects samples evenly distributed in the forecast space. After internal validation (calibration), the forecasting capacity of the models was tested using samples that were not included in this set. In this process, external validation was performed with 30% of the total data set, selecting the best preprocessing for each species, depending on the accuracy and specificity values, in addition to the spectral ranges.
The performance of the models was evaluated using the accuracy values for the calibration and validation database and also the sensitivity, specificity indexes, and Youden’s index (Youden Reference Youden1950), according to Equations 1–4.
 ${\rm{Accuracy}}\,({\rm{\% }}) = 100 - \displaystyle{y \over N}{\rm{\;}} \times 100$
where y is the total number of samples incorrectly classified for a set of N samples.
 ${\rm{Sensitivity}}\,(\% ) = \left( \displaystyle{{{{\rm{TP}}} \over {{\rm{TP}} + {\rm{FN}}}}} \right) \times 100$
where TP is true positive and FN is false negative.
 ${\rm{Specificity}}\,(\% ) = \left( \displaystyle{{{{\rm{TN}}} \over {{\rm{TN}} + {\rm{FP}}}}} \right) \times 100$
where TN is true negative and FP is false positive.
where SENS is the sensitivity and SPEC is the specificity.
Results and Discussion
Reference Analysis and NIR Spectra
There was no statistical difference (P > 0.05) for the leaf moisture values of the three Ipomoea spp. at the time of spectra collection (data not shown). The average leaf moisture of all species was 81% ± 2%.
Figure 3 shows the average NIR spectra of leaves of all three Ipomoea spp. evaluated. In the spectra without preprocessing (Figure 3A), there was a shift in the average spectrum of the species I. hederifolia compared with the other species. In the raw spectra without preprocessing, there is usually a variation of the baseline caused mainly by the presence of additive and multiplicative scattering of light. Thus, the preprocessing of the NIR spectra was used to adjust the variation related to light scattering, baseline shift, and multiplicative dispersion (Cunha Junior et al. Reference Cunha Junior, Nardini, Khatiwada, Teixeira and Walsh2015; Snel et al. Reference Snel, Braga, Silva, Wiedenhoeft, Costa, Soares, Coradin and Pastore2018). As Figure 3A shows, the difference between the NIR spectra was mainly due to a marked deviation from the baseline between species; this difference was corrected by applying SNV preprocessing (Figure 3B). The same spectral adjustment outcome was observed with the other preprocessing methods.

Figure 3. Absorbance data of raw spectra without preprocessing (A) and with standard normal variate (SNV) preprocessing (B) of Ipomoea hederifolia (IH), Ipomoea nil (IN), and Merremia aegyptia (MA) plants.
The peaks of NIR spectra are regions that contain the most information. There were two main peaks in the 4,240 to 5,540 cm−1 and 6,800 to 7,460 cm−1 bands (Figure 3B). The 7,500 to 10,000 cm−1 band is the region with the least information on the samples.
PCA
In the PCA, it was noted the separation of a group of samples of I. hederifolia in relation to the others when the NIR spectra were not preprocessed (Figure 4A). This group of samples was the same that caused an average deviation of the NIR spectrum of this species in Figure 3A. Although this group of samples grouped separately from the others, it was not possible to clearly distinguish all three species studied. In addition, the PCA of the entire NIR spectrum (4,000 to 10,000 cm−1) without any preprocessing was not adequate, as only one component (PC1) represented 100% of the sample set variability, making its application to explain differences between species infeasible.
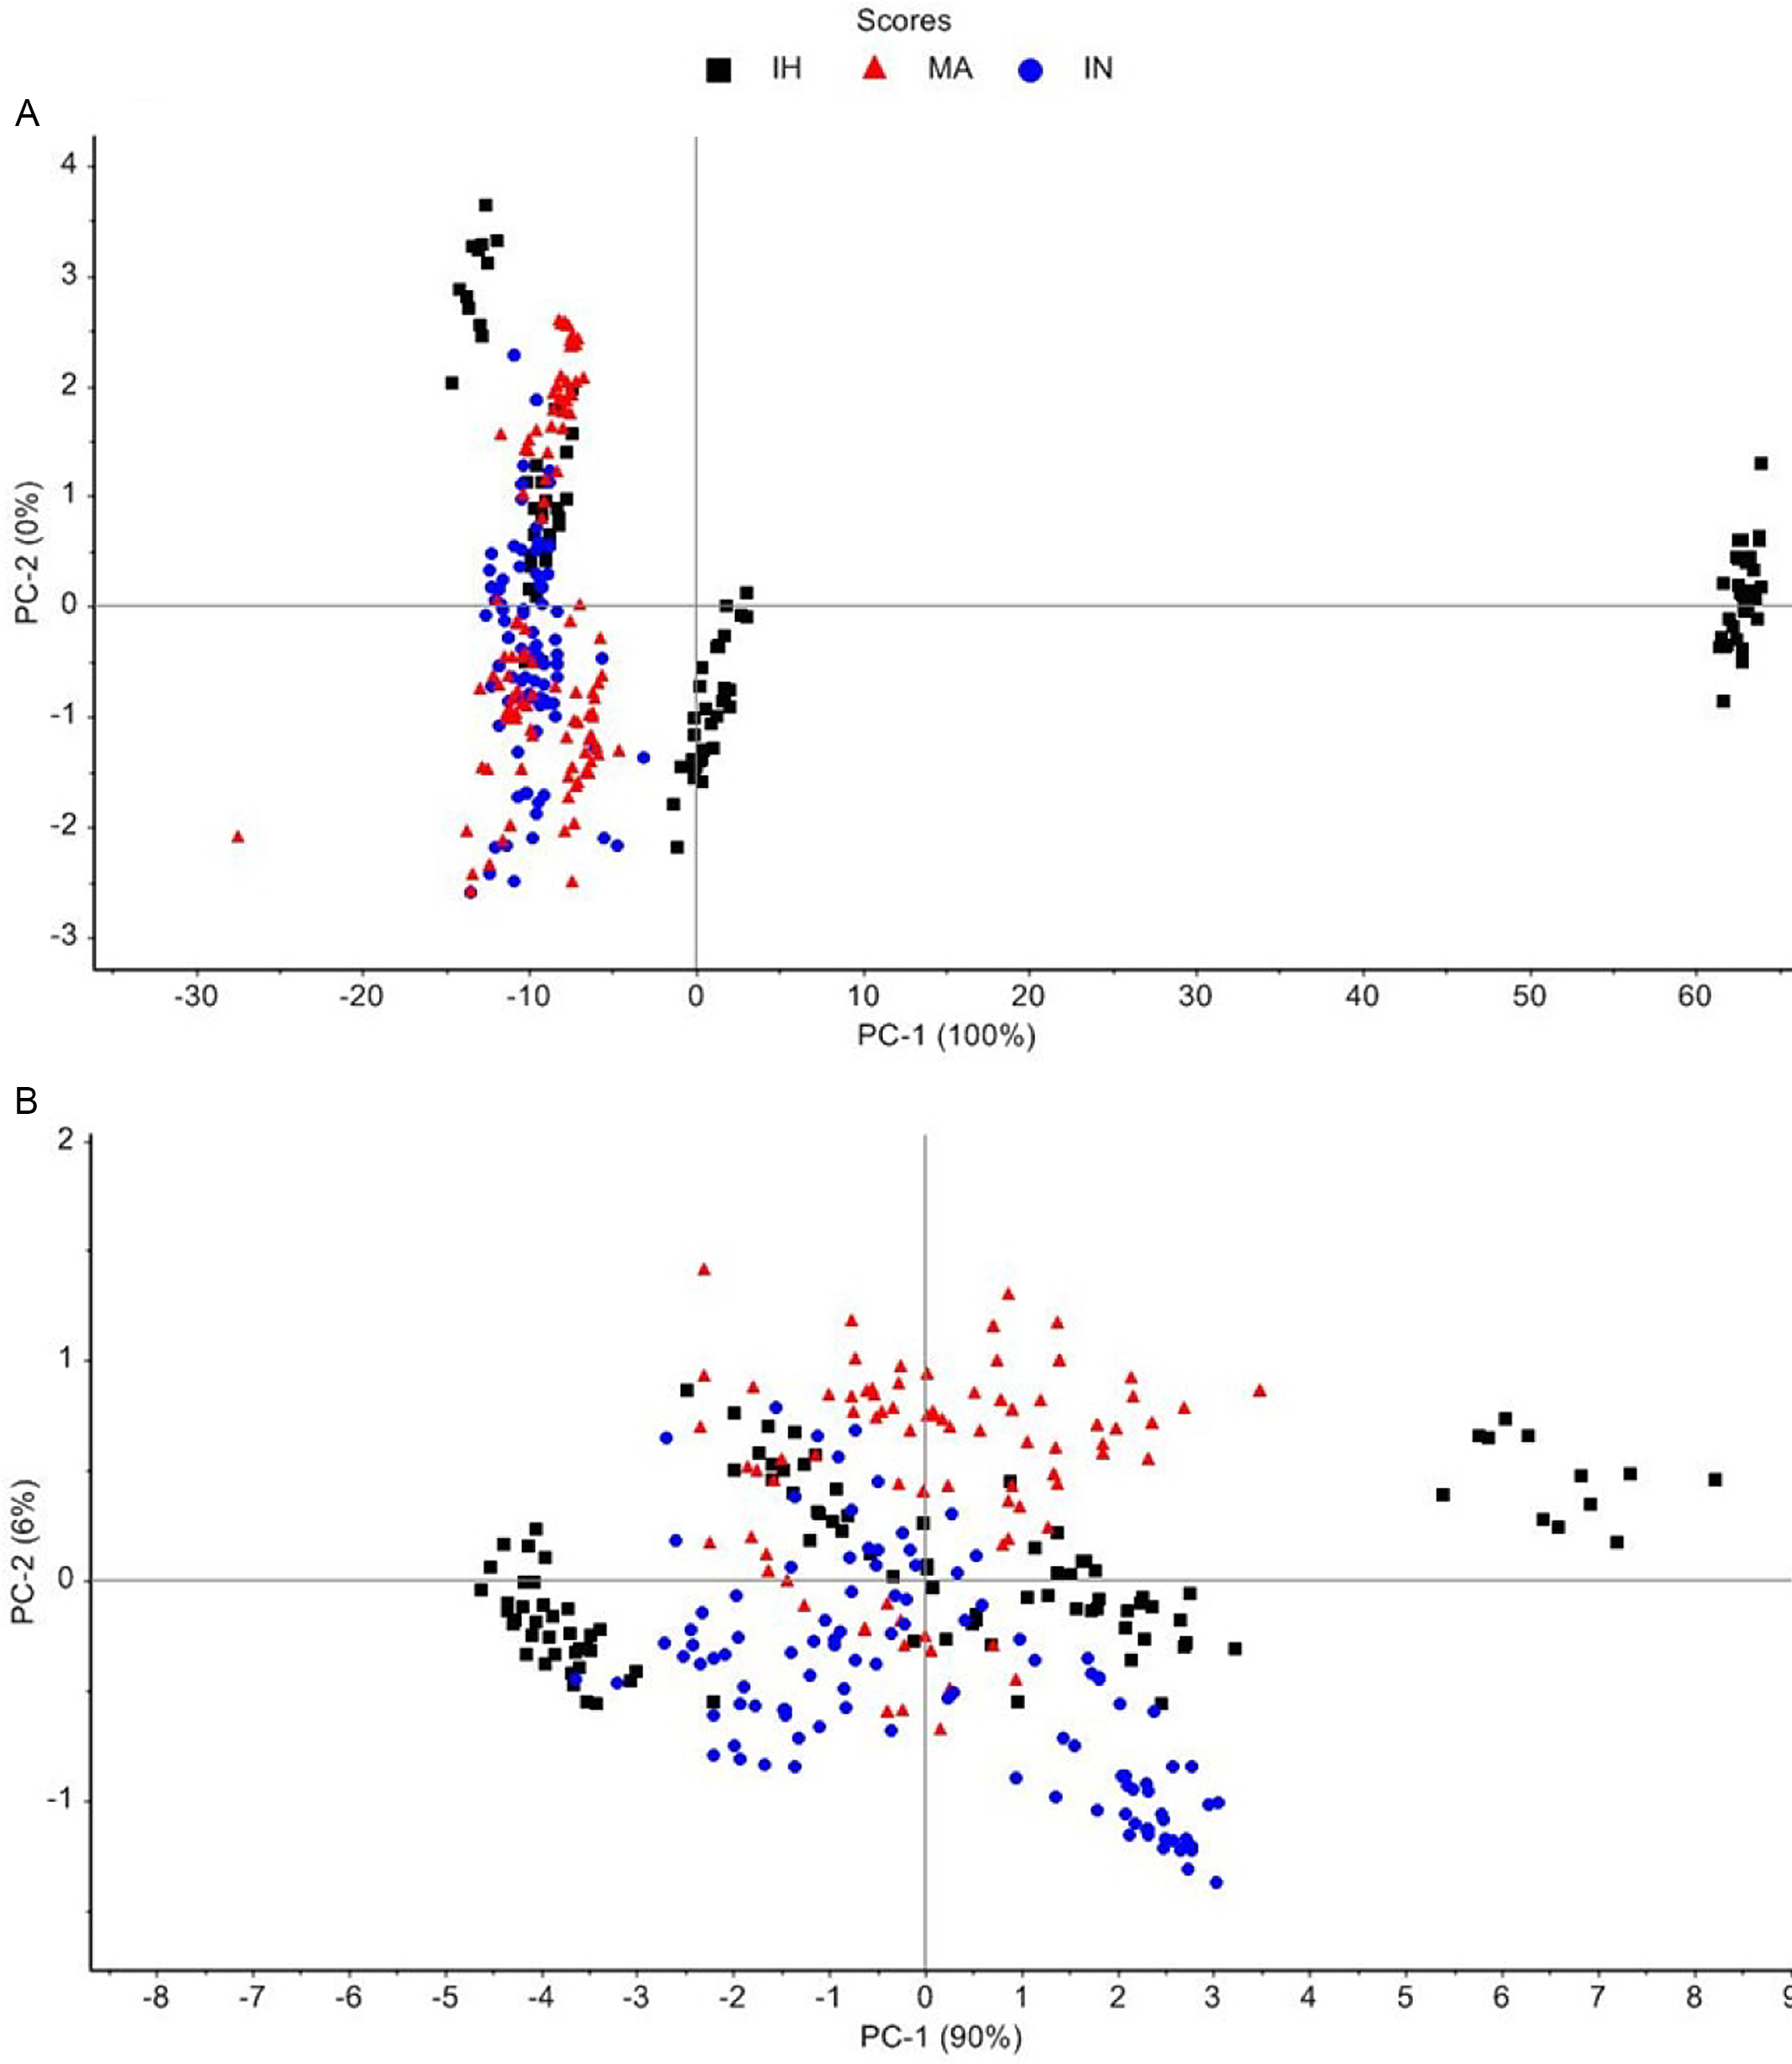
Figure 4. Principal component analysis (PCA) score plots for PC1 and PC2 in the (A) total band of spectra without preprocessing and (B) in the band of 4,240–5,540 cm−1 with standard normal variate (SNV) preprocessing for the species of Ipomoea hederifolia (IH, squares), Merremia aegyptia (MA, triangles) and Ipomoea nil (IN, circles) plants.
Thus, in an attempt to improve the results of the PCA, the selection of bands from the preprocessed NIR spectrum was considered. Figure 4B shows the PCA with the selected band of 4,240 to 5,540 cm−1 with SNV preprocessing. After band selection and data preprocessing, the components better explained variability (PC1 = 90% and PC2 = 6%). For I. hederifolia, it was also possible to clearly observe the formation of subgroups within its sample set.
However, despite the application of preprocessing and selection of bands, it was not possible to observe a clear discrimination of species using only an unsupervised analysis (PCA). The large overlap of samples in PCAs made it difficult to identify the species, which corroborates the results obtained from the NIR spectra (Figure 3). Thus, in an attempt to discriminate species, two supervised techniques of classification were used: PC-LDA and PLS-DA.
Discriminant Analyses
When considering NIR spectra with all spectral bands (4,000 to 10,000 cm−1), only a few preprocessing approaches improved the accuracy of the models in relation to the raw spectra. The PC-LDA and PLS-DA models without preprocessing showed accuracy values and Youden’s index values higher than or very close to those with preprocessing. These data indicate that when analyzing these spectra, the effect of preprocessing did not lead to more accurate models (Table 1).
Table 1. Results of principal component analysis and linear discriminant analysis (PC-LDA) and partial least-squares regression with discriminant analysis (PLS-DA) of the three species of morningglory (Ipomoea hederifolia, Ipomoea nil, Merremia aegyptia) with and without different preprocessing methods in the spectral band of 4,000–10,000 cm−1. a

a Abbreviations: Ac.V., validation accuracy; Sens., sensitivity; Spec., specificity; Youden, Youden’s index; SNV, Standard Normal Variate; 1SG, 1st derivative of Savitzky-Golay. Bold values are highlighted in the results and discussion section.
Through PC-LDA, it was possible to obtain a maximum accuracy of 96.19% for the species I. hederifolia and M. aegyptia and 97.14% for I. nil for the calibration set (Table 1). In the validation set, the highest accuracy values were 96.30%, 88.89%, and 85.93% to discriminate the species I. hederifolia, I. nil, and M. aegyptia, respectively (Table 1).
For PC-LDA, considering the species I. hederifolia and M. aegyptia, it was observed that the preprocessing tested did not positively influence the accuracy of the models compared with the spectra without preprocessing (Table 1). This result may reflect the deviation of the spectra that already existed in the samples without any preprocessing (Figure 3A). For the species I. nil, the SNV preprocessing resulted in better accuracy of the calibration and validation models, in which the validation accuracy increased from 87.41% (without preprocessing) to 88.89% (with preprocessing SNV). Although the discrimination of species by PC-LDA reached satisfactory levels of accuracy, when considering the figures of merit adopted, the PLS-DA was the most adequate for the classification of the three species studied.
Considering the PLS-DA, there were improvements in the validation accuracy using the preprocessing of 1SG and SNV + 1SG for the species I. hederifolia and SNV for I. nil. For M. aegyptia, the best validation accuracy was in the spectrum without preprocessing (94.81%) (Table 1).
However, to study the best ranges for discrimination of each species, the two best preprocessing methods were selected considering all the figures of merit chosen in this study. Therefore, the selected preprocessing approaches were: 1SG and SNV + 1SG for I. hederifolia; SNV and SNV + 1SG for I. nil; and SNV and SNV + Detrend for M. aegyptia.
Spectral Band Selection
Aiming to improve the results of the models obtained, we carried out selection of spectral bands to identify and exclude bands with little information about the species, thus improving the reliability of the models (Borraz-Martínez et al. Reference Borraz-Martínez, Simó, Gras, Mestre and Boqué2019).
For the NIR spectra without preprocessing, the selected bands of 4,240 to 7,460 cm−1 and 6,800 to 7,460 + 4,240 to 5,540 cm−1 presented higher validation accuracy values for all species than those observed for the entire spectrum (Table 2). These bands represented the regions of the main peaks presented in Figure 3.
Table 2. Results of partial least-squares regression with discriminant analysis (PLS-DA) of the three species of morning glory (Ipomoea hederifolia, Ipomoea nil, Merremia aegyptia) with and without different preprocessing methods in different spectral bands. a

a Abbreviations: Train., training set; Ac., training accuracy; Ac.V., validation accuracy; Sens., sensibility; Spec., specificity; Youden, index; SNV, Standard Normal Variate; 1SG, 1st derivative of Savitzky-Golay. Bold values are highlighted in the results and discussion section.
It is important to emphasize that for the selection of the range of 4,240 to 7,460 cm−1, only the ends of the spectrum exposed in Figure 3B were disregarded; on the other hand, for the selection of the 6,800 to 7,460 + 4,240 to 5,540 cm−1 range, the extremities of the spectrum and the interval between the two main peaks were disregarded (Figure 3B). In this case, the range with the best accuracy values was 4,240 to 7,460 cm−1. Thus, it is important to note that although the most information is in the peaks of the response curves, there is also relevant information in the interval between the peaks that can be used to improve the discrimination of the species studied. Thus, when comparing the entire spectrum (4,000 to 10,000 cm−1) with the band of 4,240 to 7,460 cm−1, it was observed that the validation accuracy values increased from 95.56%, 91.11%, and 94.81% to 98.52%, 94.07%, and 96.30% for I. hederifolia, I. nil and M. aegyptia, respectively (Table 2).
However, when considering the specificity in the ranges without preprocessing, there was no considerable difference between the ranges 4,240 to 7,460 cm−1 and 6,800 to 7,460 + 4,240 to 5,540 cm−1 (Table 2).
Contrary to what was observed for the entire NIR spectrum (4,000 to 10,000 cm−1), the preprocessing with the selected spectral bands was important for the optimization of the model parameters (Table 2). This is due to the increase in the values of the figures of merit of all the studied bands (compared with the total spectrum), with the exception of the species M. aegyptia with the SNV preprocessing, which obtained the best Youden’s index (83.33%) for the full spectrum (Table 2).
Considering the values of accuracy, specificity, and Youden’s index, the best spectral ranges evaluated for all preprocessing were between 4,240 to 7,460 (two peaks + interval between peaks), 4,240 to 5,540 (first peak), and 6,800 to 7,460 + 4,240 to 5,540 cm−1 (two peaks – interval between peaks) (Figure 3B). This result is promising, because in the absence of preprocessing, adequate parameters of the models were reached only when considering the evaluation of the entire spectrum or large spectral bands (except for M. aegyptia).
The fact that there was no statistical difference (P > 0.05; data not shown) for the leaf moisture of samples assessed indicated that the moisture of fresh leaves was not the main variation factor responsible for discriminating species using the NIR spectra (Nicolai et al. Reference Nicolai, Beullens, Bobelyn, Peirs, Saeys, Theron and Lammertyn2007; Soares et al. Reference Soares, Silva, Bergo, Coradin, Braga and Pastore2017). The variation observed in Figure 3A is mainly the result of physical effects due to differences in the surface of samples or variations at the time of spectra collection (Pasquini Reference Pasquini2003; Snel et al. Reference Snel, Braga, Silva, Wiedenhoeft, Costa, Soares, Coradin and Pastore2018). This same spectral behavior also occurred in almond [Prunus dulcis (Mill.) D.A. Webb] (Borraz-Martínez et al. Reference Borraz-Martínez, Simó, Gras, Mestre and Boqué2019).
The study of NIR spectral bands (Figure 3) enabled identification of the main chemical groups of certain spectral bands (Cunha Junior et al. Reference Cunha Junior, Nardini, Khatiwada, Teixeira and Walsh2015; Pasquini Reference Pasquini2003). The peaks observed in the region of 5,000 and 7,000 cm−1 corresponded to O-H vibrations; in this case, water is primarily the cause for these peaks. However, peaks in these regions can also indicate groups of compounds with CO2H and CO2R′ radicals (Xiaobo et al. Reference Xiaobo, Jiewen, Povey, Holmes and Hanpin2010).
The main factor limiting the studies using NIR spectroscopy on fresh vegetable products is that, generally, the regions with more information for certain constituents are also the regions that overlap the peaks related to the presence of water, making quantitative analysis and selection of a single-length waveform difficult for a given compound (Borraz-Martínez et al. Reference Borraz-Martínez, Simó, Gras, Mestre and Boqué2019; Cunha Junior et al. Reference Cunha Junior, Nardini, Khatiwada, Teixeira and Walsh2015; Jintao et al. Reference Jintao, Yufei, Liming, Chunyan, Quanwei, Weiying, Yun, Minxiang and Peng2018). The species of the Convolvulaceae family have a wide band of alkaloids and glycoresins, which may vary due to genus, species, and stage of development (Carvalho et al. Reference Carvalho, Schlerf, van Der Putten and Skidmore2013; Jenett-Siems et al. Reference Jenett-Siems, Schimming, Kaloga, Eich, Siems, Gupta, Witte and Hartmann1998; Meira et al. Reference Meira, Silva, David and David2012). There were some alkaloids identified in coptidis rhizome (Coptis chinensis Franch.) by means of NIR spectroscopy using partial least-squares regression (PLSR) at the wavelengths 4,249 to 7,502 cm−1, 4,596 to 7,502 cm−1, and 4,249 to 6,100 cm−1 (Jintao et al. Reference Jintao, Yufei, Liming, Chunyan, Quanwei, Weiying, Yun, Minxiang and Peng2018). These regions correspond to the same regions of peaks observed in this study (Figure 3B); therefore, these substances are relevant to the discrimination of the three weed species studied.
Regarding the PCA, the justification for the subgroups observed in Figure 4B is the same as for the displacement of spectra in Figure 3A. For these species, small variations in leaf thickness probably resulted in differences in the spectrum.
For the PC-LDA, the accuracy of the validation dataset in most cases was lower than that of the calibration dataset (Table 1). This is a situation commonly observed in NIR spectroscopy studies, and indicates that the validation dataset has a sufficient number of samples (n = 315), justifying the high accuracy values observed (Borraz-Martínez et al. Reference Borraz-Martínez, Simó, Gras, Mestre and Boqué2019). In addition, these results elucidate the importance of validating the models generated with external samples (i.e., the ones that were not used for training), in order to avoid making the mistake of selecting overfitted models (Pasquini Reference Pasquini2003).
The evaluation of different figures of merit used in this study (Table 1) is important for the selection of more robust and accurate models. When considering the accuracy of the models, the number of total hits was taken into account, whether they were true positives or true negatives; the Youden’s index contributes to the balance between sensitivity and specificity (Youden Reference Youden1950). From a practical point of view (in the management of weeds under field conditions), it is desirable to select models that are able to identify the target with better accuracy, that is, models with greater specificity. This justification is due to the fact that when a weed is not properly identified and controlled, this specimen may be responsible for generating several other descendants in the next crop year and/or dispersing large quantities of seeds into the soil, which may remain viable for several years (López-Granados Reference López-Granados2010; Souza et al. Reference Souza, Amaral, Medeiros Oliveira, Coutinho and Netto2020).
Considering the ranges without preprocessing, there were no differences between the ranges 4,240 to 7,460 cm−1 and 6,800 to 7,460 + 4,240 to 5,540 cm−1 (Table 2). In this case, the option for the range that comprises only the two peaks, without the interval between them, would be a more suitable option to be applied in field conditions, due to the smaller volume of data needed to distinguish the species. In a study using the visible and infrared spectrum, Souza et al. (Reference Souza, Amaral, Medeiros Oliveira, Coutinho and Netto2020) observed that the use of only four bands showed adequate results in the differentiation of weeds and sugarcane species. As a result, it was possible to use simplified sensors to distinguish between plant species, aiming at the species-specific application of postemergence herbicides (Souza et al. Reference Souza, Amaral, Medeiros Oliveira, Coutinho and Netto2020).
In the present study, it was observed that the range of 4,240 to 5,540 cm−1 (corresponding to the first peak; Figure 3B) allowed the discrimination of the three species, using a smaller volume of data (compared with the largest spectral range) after the application of the preprocessing (Table 2). Using the 1SG preprocessing (to discriminate I. hederifolia) and SNV (for I. nil and M. aegyptia), in the range of 4,240 to 5,540 cm−1, it was possible to obtain high values in the validation accuracy (99.26%, 93.33%, and 91.11%) and specificity (98.94%, 95.18%, and 97.65%) for each species, respectively (Table 2). On the other hand, it was also noted that the worst discrimination results were observed in the range of 6,800 to 7,460 cm−1 (which comprises the area of the second peak; Figure 3B), with and without preprocessing. Despite the fact that the two peaks added together have presented good results, when analyzed separately, the first peak of the spectrum (which corresponds to the range of 4,240 to 5,540 cm−1; Figure 3B), has a better performance in the discrimination of the species compared with the second peak (6,800 to 7,460 cm−1) (Table 2).
Thus, given the high infestation of Ipomoea spp. in sugarcane areas and the high economic importance of this crop (Piza et al. Reference Piza, Nepomuceno and Alves2016; Viator et al. Reference Viator, Griffin and Ellis2002), the results obtained in the present study can serve as a basis for discriminating these weed species through specific bands obtained by NIR spectral analysis (especially 4,240 to 5,540 cm−1). In addition, the best preprocessing to be used was also elucidated, which could provide a basis for the development of sensors with high accuracy in the discrimination of Ipomoea spp. coupled to mechanized sprayers. However, it is important to emphasize that more studies in this direction should be carried out, especially studies that aim to understand the influence of other factors on the spectral behavior of weed species, such as different stages of plant development and variations in abiotic factors (such as water and nutritional stress).
We concluded that NIR spectroscopy associated with PC-LDA and PLS-DA can be used to discriminate three species of morningglory (I. hederifolia, I. nil, and M. aegyptia). The study of the spectral bands as well as the preprocessing promoted a higher success rate of the tested models. Thus, dedicated sensors can be developed for weed control via the species-specific application of postemergence herbicides.
Acknowledgments
The authors would like to thank National Council for Scientific and Technological Development (CNPq grant no. 142375/2017-9) for financial support and the Weed Sciences Laboratory (LAPDA) of Sao Paulo State University (Unesp/FCAV). No conflicts of interest have been declared.


