Introduction
Among total fish biomass in the world, mesopelagic fish are likely dominant with an estimated biomass of over 1000 million tons (Irigoien et al., Reference Irigoien, Klevjer, Røstad, Martinez, Boyra, Acuña, Bode, Echevarria, Gonzalez-Gordillo, Hernandez-Leon, Agusti, Aksnes, Duarte and Kaartvedt2014). From the viewpoint of abundance, the mesopelagic fish genus Cyclothone is likely the most abundant vertebrate on earth (Nelson et al., Reference Nelson, Grande and Wilson2016). Because of their huge abundance and biomass, mesopelagic fish play key roles in trophic linkage and material cycles in the ocean. These fish prey upon many taxa of zooplankton with a preference for crustaceans such as copepods, amphipods, and euphausiids (Beamish et al., Reference Beamish, Leask, Ivanov, Balanov, Orlov and Sinclair1999; Moku et al., Reference Moku, Kawaguchi, Watanabe and Ohno2000). Squids and marine mammals spend a portion of their day feeding in mesopelagic waters, and mesopelagic fish are important prey (Kajimura and Loughlin, Reference Kajimura and Loughlin1988; Phillips et al., Reference Phillips, Jackson and Nichols2001; Watanabe et al., Reference Watanabe, Kubodera, Ichii and Kawahara2004). Not only in midwater but also near the sea surface, mesopelagic fish are also important prey for larger predators such as seabirds and salmonid fish because of their DVMs (Koval and Karpenko, Reference Koval and Karpenko1998; Jacobsen and Hansen, Reference Jacobsen and Hansen2001; Watanuki and Thiebot, Reference Watanuki and Thiebot2018). Mesopelagic fish also play an important role in carbon transport from the surface euphotic zone to the ocean interior. In the equatorial Pacific, the downward carbon flux due to micronekton (mesopelagic fish are the dominant component) respiration was suggested to be at the same level as that by sinking particles (Hidaka et al., Reference Hidaka, Kawaguchi, Murakami and Takahashi2001). The respiratory carbon flux by micronekton was equivalent 53% of the sinking particulate carbon flux at 150 m, based on their larger migratory ranges, micronekton are expected to be the dominant component exporting carbon to deeper waters in the subtropical Atlantic (Ariza et al., Reference Ariza, Garijo, Landeira, Bordes and Hernandez-Leon2015). In addition, mesopelagic fish are one of the main scatterers in the deep scattering layer (Marshall, Reference Marshall1951). Despite their ecological importance, mesopelagic fish remain one of the least investigated components of the midwater ecosystem (Irigoien et al., Reference Irigoien, Klevjer, Røstad, Martinez, Boyra, Acuña, Bode, Echevarria, Gonzalez-Gordillo, Hernandez-Leon, Agusti, Aksnes, Duarte and Kaartvedt2014).
In the subarctic Pacific, the mesopelagic fish have been relatively well investigated. Beamish et al. (Reference Beamish, Leask, Ivanov, Balanov, Orlov and Sinclair1999) summarized the occurrence of a total of 99 mesopelagic fish species in the western and eastern subarctic Pacific gyres. In their report, there were 48 and 13 species unique to the western and eastern gyres, respectively, Myctophidae were the most diverse and abundant, and the Myctophid Stenobrachius leucopsarus was considered as the most ecologically important species there. In the Russian waters of the western subarctic Pacific, Orlov and Tokranov (Reference Orlov and Tokranov2019) listed 80 mesopelagic fish species that accounted for 33% of the total number of fish species and they also summarized depth ranges of observed fish. Combining the results of Beamish et al. (Reference Beamish, Leask, Ivanov, Balanov, Orlov and Sinclair1999) and Orlov and Tokranov (Reference Orlov and Tokranov2019), 119 mesopelagic fish species have been recorded from the western subarctic Pacific gyre. Ecologically, mesopelagic fish species dominated among the fish community on the continental shelf and beyond the shelf break in the Gulf of Alaska (McGowan et al., Reference McGowan, Horne and Parker-Stetter2019) and in the western and eastern subarctic gyres (Beamish et al., Reference Beamish, Leask, Ivanov, Balanov, Orlov and Sinclair1999). There are also reports of feeding habits (Gordon et al., Reference Gordon, Nishida and Nemoto1985; Moku et al., Reference Moku, Kawaguchi, Watanabe and Ohno2000; Kosenok et al., Reference Kosenok, Chuchukalo and Savinykh2006) and predation by larger predators (e.g., Sanger and Ainley, Reference Sanger and Ainley1988; Orlov, Reference Orlov1997; Ohizumi et al., Reference Ohizumi, Kuramochi, Kubodera, Yoshioka and Miyazaki2003). Compared with the studies on trophic linkages, however, vertical distribution and migration of mesopelagic fish have been poorly investigated. For example, Nishikawa et al. (Reference Nishikawa, Nishida, Moku, Hidaka and Kawaguchi2001) reported summertime vertical distributions of bulk biomass for Pisces in the western subarctic Pacific, although no information on species was provided. To understand ecological processes and the roles of mesopelagic fish, knowledge of vertical distribution and migration is crucial baseline information. Vertical distribution patterns are also needed to assess the abundance of these fish because sampling just the upper depths of a species range can lead to substantial underestimates of abundance (Brodeur and Rugen, Reference Brodeur and Rugen1994). In addition, knowledge of larval mesopelagic fish is also quite limited in oceanic areas of the western subarctic Pacific, although these have been well reported from the eastern Pacific from Alaska to Hawaii (Norcross et al., Reference Norcross, McKinnell, Frandsen, Musgrave and Sweet2003), the Sea of Okhotsk (Davydova et al., Reference Davydova, Shebanova and Andreeva2007; Andreeva and Shebanova, Reference Andreeva and Shebanova2010; Mukhametva and Mukhametov, Reference Mukhametva and Mukhametov2022), and the transition region south of the western subarctic Pacific (Sassa et al., Reference Sassa, Kawaguchi, Oozeki, Kubota and Sugisaki2004b, Reference Sassa, Kawaguchi and Taki2007). Previously, most of studies on oceanic fish in the western subarctic Pacific were carried out along the Kamchatka Peninsula, off the Kuril Islands and in Japanese waters off Hokkaido but ecological study inside the Western Subarctic Gyre (WSG) has been limited.
In this study, we investigated seasonal changes of community structure, abundance, vertical distribution, and diel/ontogenetic migrations for both larval and juvenile/adult mesopelagic fish in the WSG of the North Pacific. To understand these topics, sample collections for fish were carried out from eight or nine discrete depths between 1000 m and sea surface by using the opening/closing net system, covering all four seasons. In our collected fish samples, quite a few specimens of non-mesopelagic fish species were also included. Although this study focused on mesopelagic fish, simple descriptions of the non-mesopelagic fish species were also added in this paper.
Methods
The present study was carried out at the time-series station K2 in the western subarctic Pacific (47°N, 160°E, Figure 1) from 2006 to 2012 including all four seasons (Table 1). In this study, the meteorological seasons at K2 are defined in accordance with Matsumoto et al. (Reference Matsumoto, Honda, Sasaoka, Wakita, Kawakami and Watanabe2014): winter (December–February), spring (March–May), summer (June–August), and autumn (September–November). K2 is a time-series station established in 2001 to evaluate long-term changes of the environment of the western subarctic Pacific (Honda et al., Reference Honda, Wakita, Matsumoto, Fujiki, Siswanto, Sasaoka, Kawakami, Mino, Sukigara, Kitamura, Sasai, Sherwood, Hashioka, Yoshikawa, Kimoto, Watanabe, Kobari, Nagata, Hamasaki, Kaneko, Uchimiya, Fukuda, Abe and Saino2017). In addition to the long-term environmental monitoring, many kinds of biological studies have been carried out (e.g., Kobari et al., Reference Kobari, Nakamura, Aita and Kitamura2022; Taniguchi et al., Reference Taniguchi, Amei, Tokuhiro, Yamada, Kitamura and Yamaguchi2023). As regards mesopelagic fish at K2, Kitamura and Murata (Reference Kitamura and Murata2020) reported the vertical distribution and migration of the predominant mesopelagic fish, Leuroglossus schmidti. However, mesopelagic fish other than L. schmidti have not been investigated.
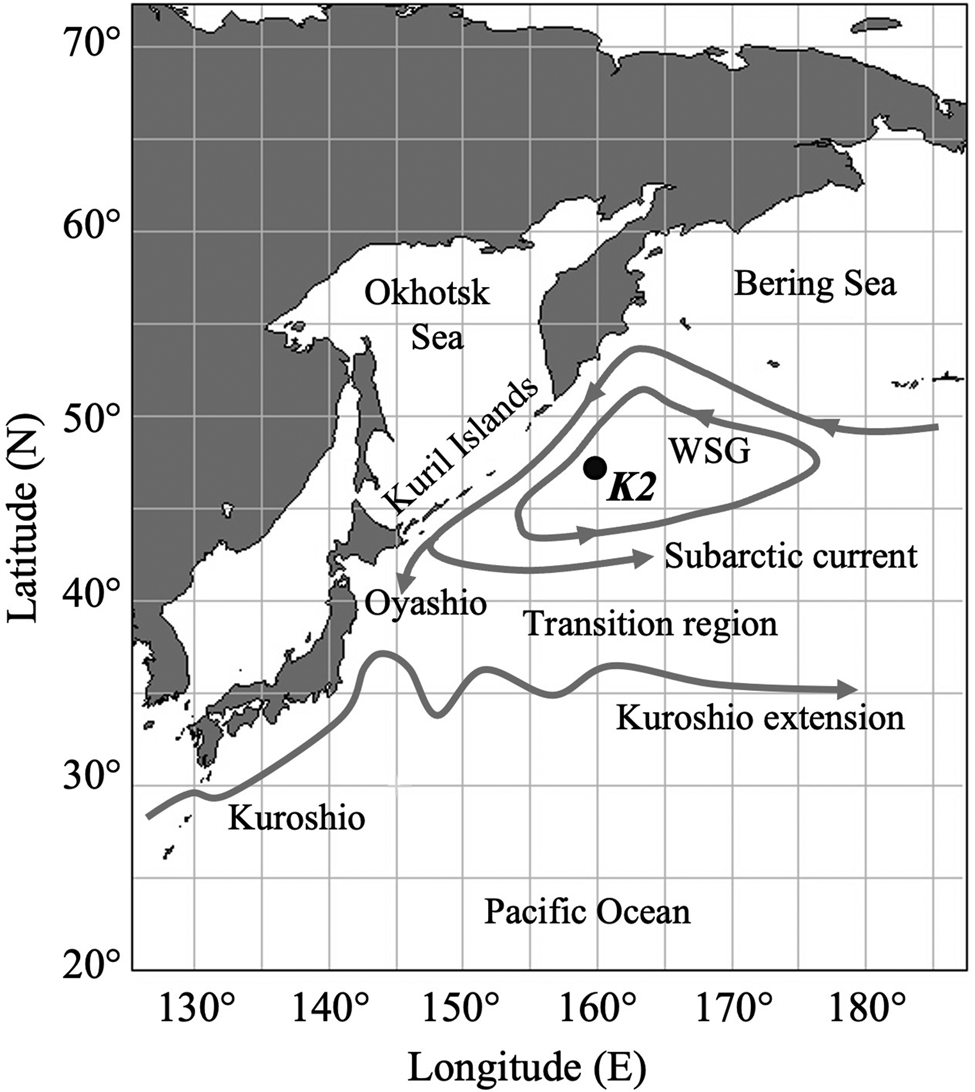
Figure 1. Map of the western North Pacific Ocean showing the study site, time-series station K2 (47°N, 160°E), with the surface current system (modified from Qiu, Reference Qiu2023). WSG is the Western Subarctic Gyre.
Table 1. Sampling of mesopelagic fish at time-series station K2 in the western subarctic Pacific
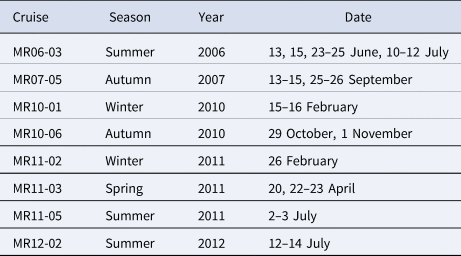
All fish specimens used in this study were obtained from the same cruises and net samples reported by Kitamura and Murata (Reference Kitamura and Murata2020). To collect fish samples, we operated a multiple opening/closing net system (IONESS; SEA Corporation, Chiba, Japan) which was equipped with nine nets of 0.33-mm mesh and 1.5-m2 mouth area each. The net system was towed obliquely at about 2 knots and fish samples were collected during the upcast of the system at discrete depth intervals from 0 to 1000 m during both the day and night. The discrete depth intervals were changed from the 2006 and 2007 cruises (nine layers: 1000–750, 750–500, 500–400, 400–300, 300–200, 200–150, 150–100, 100–50, and 50–0 m) to cruises during and after 2010 (eight layers: 1000–750, 750–500, 500–300, 300–200, 200–150, 150–100, 100–50, and 50–0 m). In the data analysis, fish abundances in the two sampling layers 300–400 and 400–500 m of 2006 and 2007 cruises were combined into a 300–500-m abundance to compare with data collected from cruises during and after 2010. The volume of water filtered by each net was estimated by using a calibrated flowmeter mounted on the net frame. Larger fish were immediately sorted from the net samples and fixed in 5–10% formalin-seawater; the remaining subsamples were also fixed and preserved in 5% formalin-seawater. To obtain typical vertical profiles of water temperature, salinity, and dissolved oxygen (DO), a conductivity–temperature–depth (CTD) instrument cluster (SBE 911plus; Sea-Bird Scientific, Bellevue, WA, USA) with a DO sensor (SBE43; Sea-Bird Scientific) was deployed during every cruise.
After our return to the laboratory on land, smaller fish were sorted out from the formalin-preserved subsamples. All fish samples were morphologically identified and enumerated. To understand body sizes of all fish species, we measured the standard length (SL) of the collected specimens to the nearest 0.1 mm using a Vernier caliper. For larvae, the length from snout tip to notochord tip was defined as the SL (Dunn, Reference Dunn1983). We also measured wet weight of juvenile and adult specimens to the nearest 0.001 g using an electronic balance (GR-202; A & D Company, Limited, Tokyo, Japan). Vertically integrated abundances (ind. m−2) within each sampling layer and through the 0–1000-m water column were calculated, respectively. Mean abundance for each cruise was calculated (cruise mean). Then, seasonal mean abundances were obtained by averaging the cruise means in each season. In this study, larvae and juvenile/adult stages for each species were separately enumerated. Among the collected species, standard lengths of some specimens for Cyclothone pallida and Stenobrachius leucopsarus exceeded lengths at maturity which reported by a website of FishBase (Froese and Pauly, Reference Froese and Pauly2024) and Smoker (Reference Smoker1970), respectively. Unfortunately, length of maturity seems to be not reported for other species collected in this study, some of our specimens of Stenobrachius nannochir, Cyclothone atraria and Melamphaes lugubris were over 90% of their maximum lengths reported by the FishBase. Although we didn't observe maturation of specimens anatomically, we considered that adult specimens were also included in our materials. We dealt with specimens after metamorphosis as ‘juvenile and adult’ in this study.
To quantify species diversity of the mesopelagic fish community, we counted species richness (number of species collected) and calculated Simpson's index of diversity (SID) based on the seasonal means of vertically integrated abundances through the 0–1000-m water column. SID is expressed as
where b is the abundance of a particular taxon and B is the total abundance of the mesopelagic fish community. Both abundances are vertically integrated through the 0–1000-m water column. The value of this diversity index ranges between 0 and 1 and higher values indicate greater sample diversity.
To understand seasonal changes in the fish community, cluster analyses were performed independently for larval and juvenile/adult fish communities throughout the 0–1000-m water column. Abundance data were normalized via square root transformation, and the Bray–Curtis similarity matrix (Bray and Curtis, Reference Bray and Curtis1957) between seasons was obtained. Based on the similarity matrix, significant groups within the hierarchical clustering using group average linkage were established with the SIMPROF test (Clarke et al., Reference Clarke, Somerfield and Gorley2008) at 5% significance level. To minimize the effect of net avoidance by fish, only nighttime abundances were used for each species in this similarity analysis. This analysis was carried out using PRIMERv6 software (PRIMER-E, Ltd., Auckland, New Zealand).
To evaluate the presence/absence and extent of DVM, we calculated weighted mean depth (WMD, m) for each species:
where di is the depth of sample i (centre of the depth interval, m), ni is the population density of each species in the depth interval (ind. m−3), and zi is the thickness of the depth interval (m) (Andersen et al., Reference Andersen, Devey, Gubanova, Picheral, Melnikov, Tsarin and Prieur2004). The amplitude of the migration (ΔWMD) was calculated as day WMD minus night WMD. In this study, juvenile/adult fish of three species (Leuroglossus schmidti, Lipolagus ochotensis, and Stenobrachius leucopsarus) undertook opportunistic DVM, in which only a part of the population swam up to the surface layer, but others stayed at mesopelagic depths at night. For these three species, nighttime WMDs were calculated separately for both the migratory and non-migratory populations. Furthermore, ΔWMD of only the migratory population was obtained as day WMD minus night WMD in the surface layer.
Results
Hydrography
Seasonal changes in water temperature and salinity were detected shallower than about 100 m (Figure 2). In this layer, two phases of the vertical profiles of temperature and salinity were apparent: vertical mixing during the cold seasons from winter to spring and stratification during warm seasons from summer to autumn. During the cold seasons, water temperature and salinity in this mixed layer were recorded as 1.7°C and 32.9–33.0, respectively. During the warm seasons when stratification was observed, the maximum water temperature (10.2°C) and the minimum salinity (32.6) were detected at the sea surface in an autumn cruise. In the warm stratified seasons, intermediate cold water was observed at around 100 m depth. The minimum water temperature in this water mass ranged from 1.2 to 1.5°C. Seasonal variability of DO was also detected in the surface layer (Figure 2). During the cold seasons, DOs between 0 and 100 m were homogenized as 325 μmol kg−1 which was the highest value through the annual DO variability. In the warm seasons, DOs above 30 and 40 m were homogenized in summer (312 μmol kg−1) and autumn (286 μmol kg−1), respectively, and both were lower than those in the cold seasons.
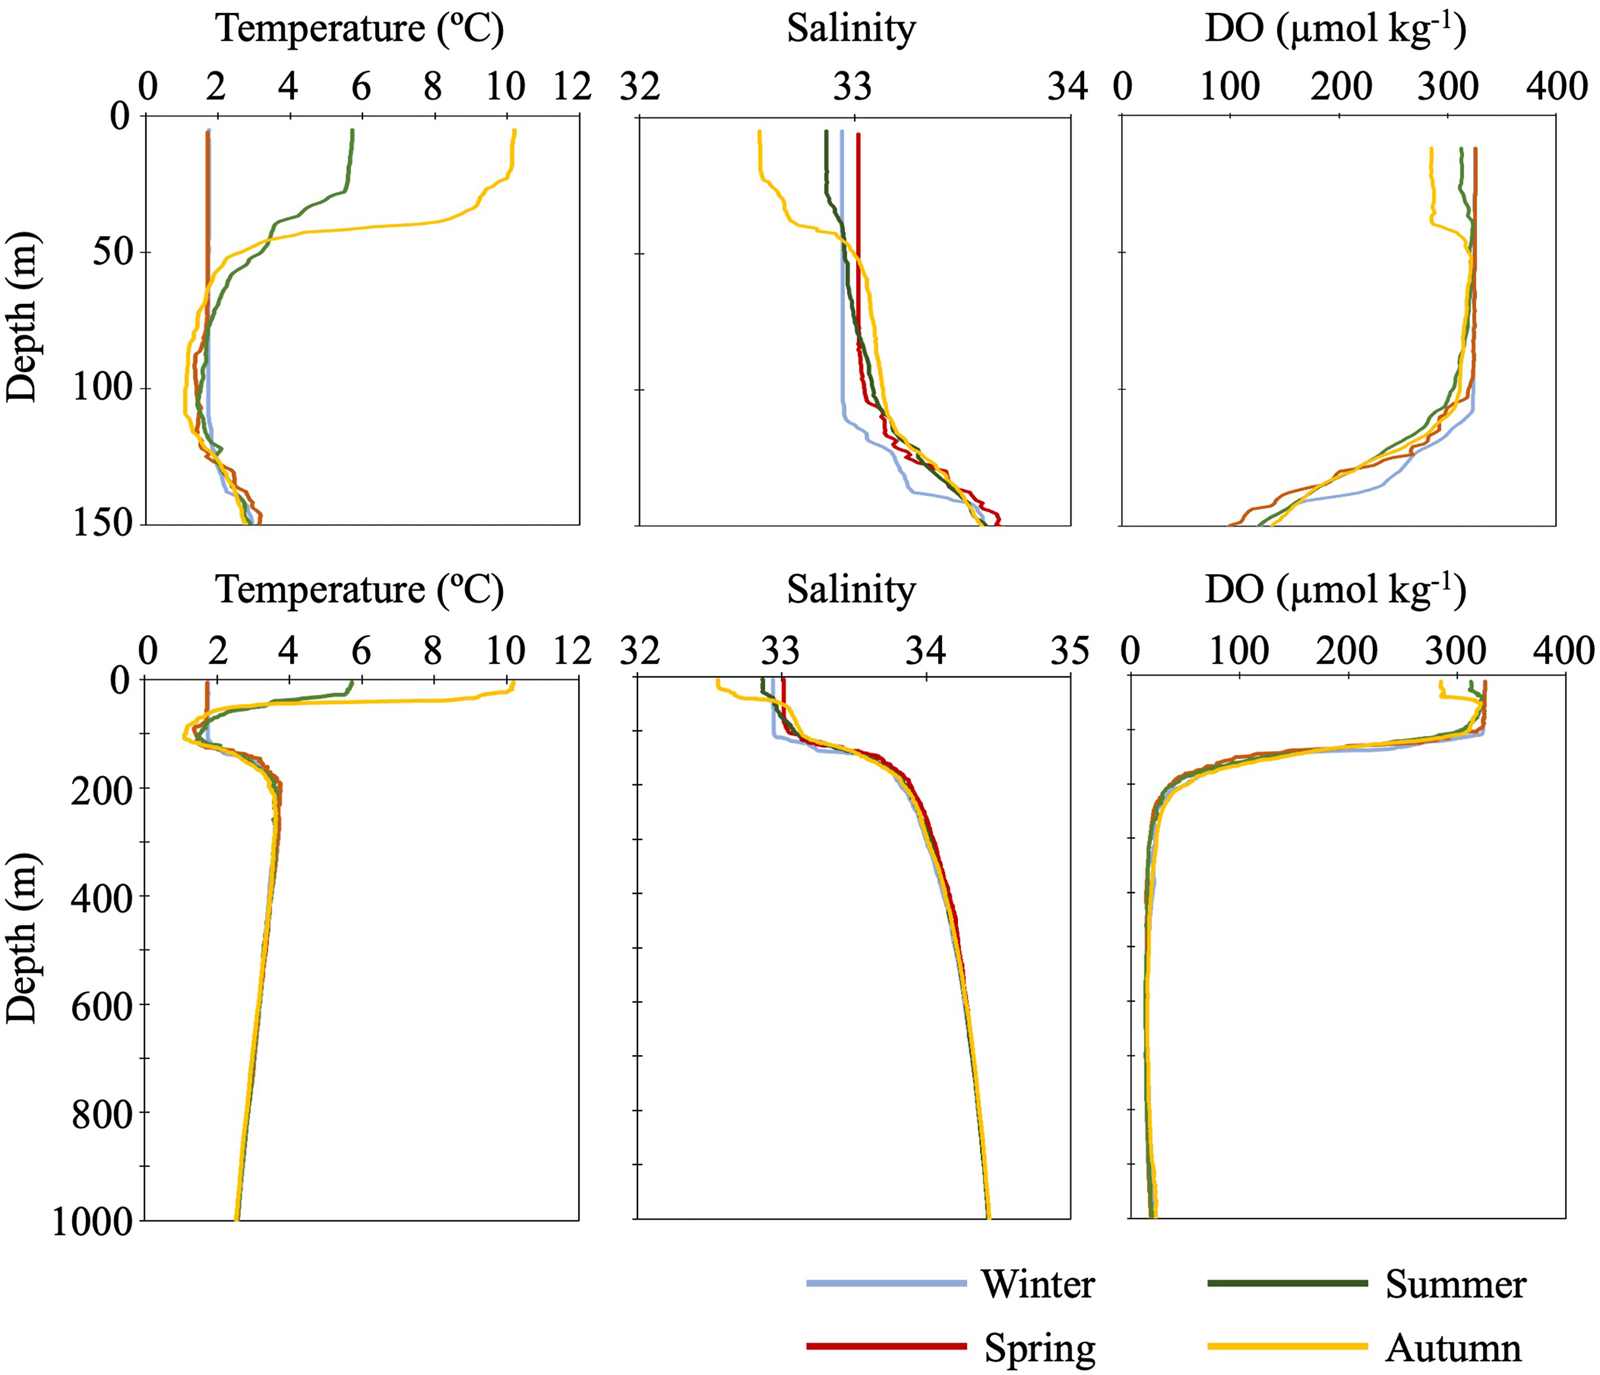
Figure 2. Vertical profiles of seasonal mean water temperature (°C), salinity and dissolved oxygen (μmol kg−1) at the time-series station K2. Top three panels are enlarged drawings of the profiles in surface layer (0–150 m) and bottom three panels indicate profiles between 0 and 1000 m in depth. Note that summertime profiles are means of data collected during cruises MR11-05 and MR12-02, data obtained from cruise MR06-03 are omitted.
Below 100 m depth, no seasonal variability in water temperature, salinity, and DO was observed. Between 100 and 200 m depth, there were permanent thermo- and haloclines, where both temperature and salinity increased with depth. On the other hand, DOs were decreasing in this depth layer. Intermediate warm water was detected just below the permanent thermocline: the maximum water temperature in this water mass was around 3.6°C at around 250 m depth. Below the intermediate warm water, temperature gradually decreased to 2.5°C at 1000 m depth. Salinity gradually increased below the permanent halocline: the maximum observed salinity of 34.4 was recorded at 1000 m depth. And quite low DOs were observed below the permanent halocline: the minimum DO (ca 13–14 μmol kg−1) was recorded between 595 and 620 m depth.
During summer in 2006, vertical profiles of water temperature, salinity, and DO were slightly differed from those obtained during the summers of 2011 and 2012.
Seasonality for occurrence and community structure
Larval fish
Ten species of fish larvae belonging to six families were collected (Table 2): among them, seven species (Bathylagus pacificus, L. schmidti, Macropinna microstoma, Protomyctophum thompsoni, Pseudobathylagus milleri, S. leucopsarus, and Tarletonbeania sp.) were larvae of mesopelagic fish whereas three (Coryphaenoides sp., Hemilepidotus gilberti and Malacocottus sp.) were demersal, as defined by Orlov and Tokranov (Reference Orlov and Tokranov2019). The most and second-most abundant L. schmidti and Coryphaenoides sp. were collected throughout the four seasons with the highest abundance in summer (Figure 3A, B). Larvae of H. gilberti were detected only in the cold seasons (Figure 3C) whereas those of P. milleri (Figure 3D) and the other five species (B. pacificus, M. microstoma, S. leucopsarus, P. thompsoni, and Tarletonbeania sp.) were restricted to the warm seasons (Table 2); among these five species, three myctophid larvae (P. thompsoni, S. leucopsarus and Tarletonbeania sp.) were collected. Although we collected seven species of juvenile/adult myctophids (see Result section ‘Juvenile/adult fish' in ‘Seasonality for occurrence and community structure’), species richness and abundances of their larvae were quite limited. Malacocottus sp. occurred in all seasons except summer with relatively high abundance in the cold seasons (Figure 3E). Standard lengths of the collected Malacocottus larvae increased from autumn to spring: 10.2 mm in autumn (n = 1), 14.8 ± 2.0 mm in winter (mean ± standard deviation, n = 3), and 20.1 mm in spring (n = 1). We categorized seasonal occurrences of larvae into four types: (1) in all four seasons with summer peak (L. schmidti, Coryphaenoides sp.), (2) in the cold seasons only (H. gilberti), (3) in the warm seasons only (B. pacificus, M. microstoma, P. milleri, P. thompsoni, S. leucopsarus, Tarletonbeania sp.), and (4) from autumn to spring with relatively high abundance during the cold seasons (Malacocottus sp.).
Table 2. Seasonal and annual mean abundances of larval fish through the 0–1000-m water column (ind. m−2) at time-series station K2 in the western subarctic Pacific, with standard length (mm) for each species and seasonal variability of diversity indexes
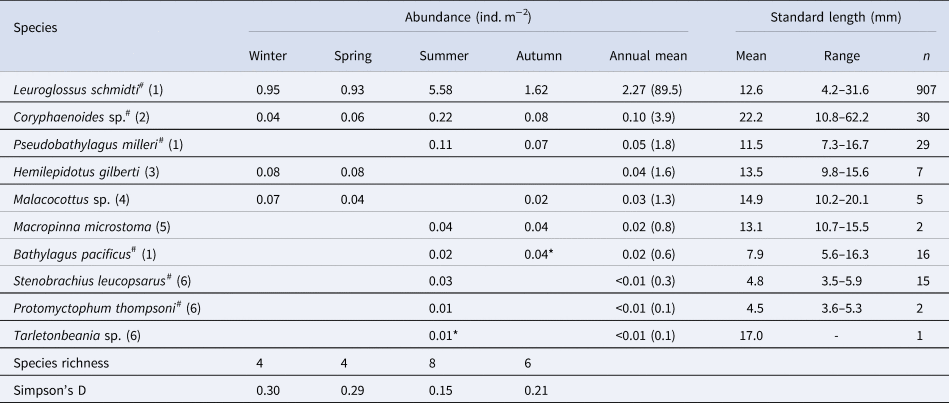
As for species with hashtags, both larval and juvenile/adult specimens were collected in this study. Numbers within parentheses in the column of species indicate family for each species: (1) Bathylagidae, (2) Macrouridae, (3) Cottidae, (4) Psychrolutidae, (5) Opisthoproctidae and (6) Myctophidae. Although abundances were primarily calculated based on the nighttime samples, data with asterisks were collected during day because of no sample collected during night. A column of annual mean contains annual mean abundance with its percentage in parentheses for each species
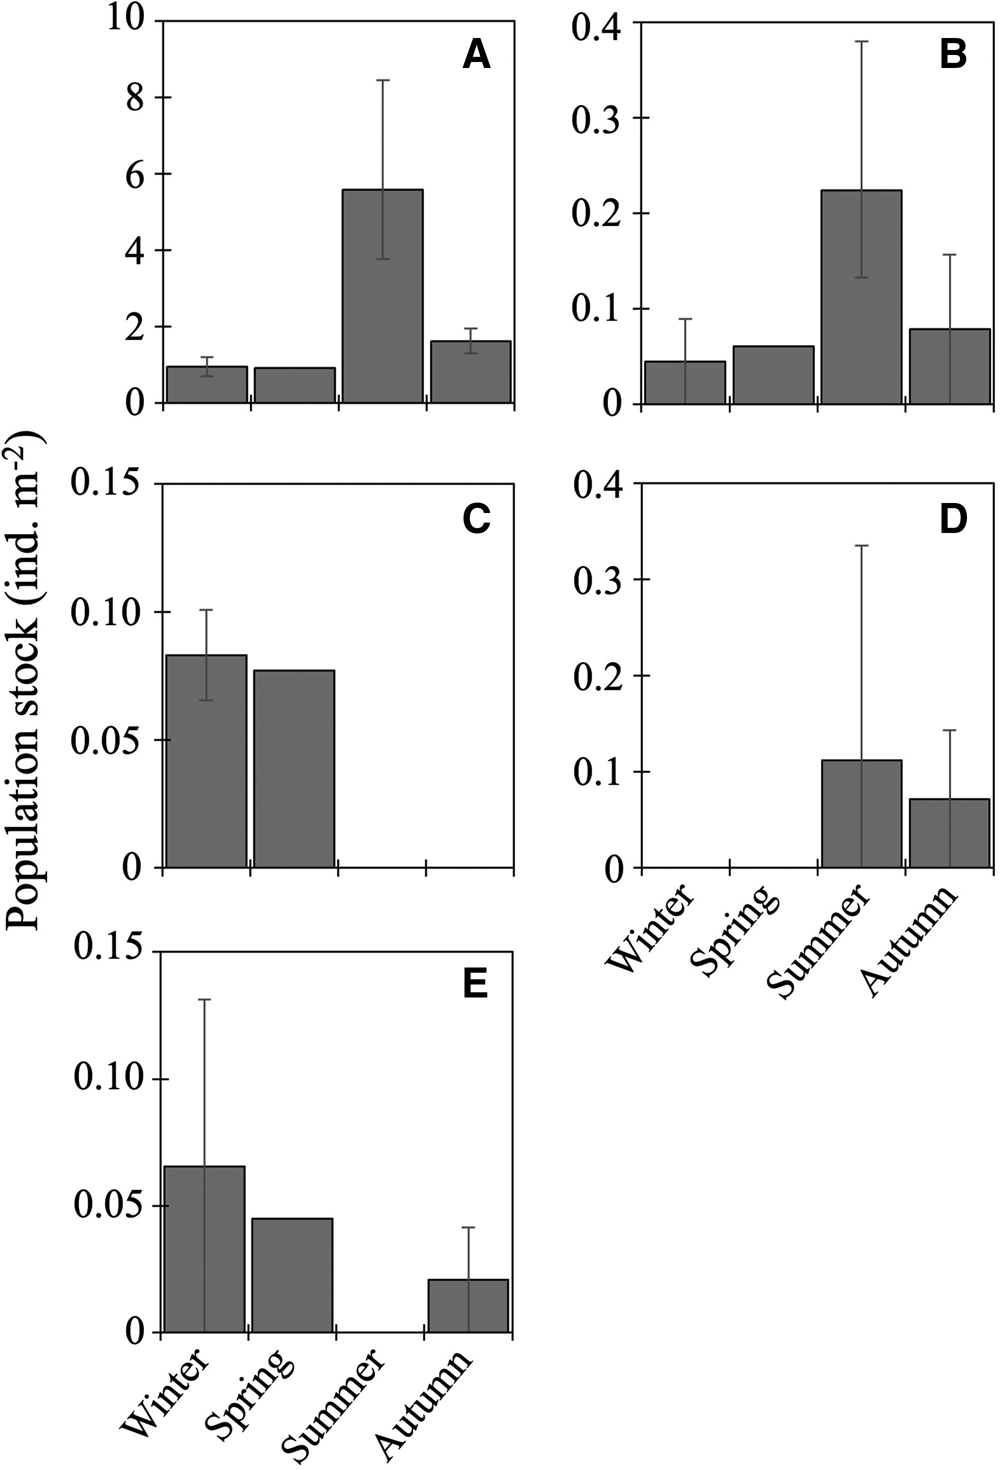
Figure 3. Seasonal vertically integrated abundance through the 0–1000-m water column (ind. m−2) for five dominant fish larvae at time-series station K2: Leuroglossus schmidti (A), Coryphaenoides sp. (B), Hemilepidotus gilberti (C), Pseudobathylagus milleri (D) and Malacocottus sp. (E). Abundances are based on the nighttime data to reduce the influence of net avoidance by fish. Whiskers show range of the cruise mean abundances (n = 2 for winter and autumn, n = 3 for summer). Data for L. schmidti are from Kitamura and Murata (Reference Kitamura and Murata2020).
Total abundance of larvae in the 0–1000-m water column was high in summer but low in other seasons (Figure 4). From the cluster analysis based on Bray–Curtis similarity, larval fish were seasonally classified into three communities: summer, autumn, and the cold seasons (Figure 5). Leuroglossus schmidti was the most abundant larva detected among the three communities, whereas abundances of the other species were relatively low (Figure 5). The summer community was characterized by high species richness (eight species) and total abundance. The larval community in the cold seasons had low species richness (four species) and total abundance, and relatively high percentages of abundance for H. gilberti and Malacocottus sp. The autumn community had moderate species richness and total abundance. Although a pie chart showing species composition in autumn is similar to that in summer (Figure 5), presence of Malacocottus sp. and composition of rare species shown by bar chart are different from the summer community. Species diversities based on SID were low (0.15–0.30) throughout the four seasons (Table 2).
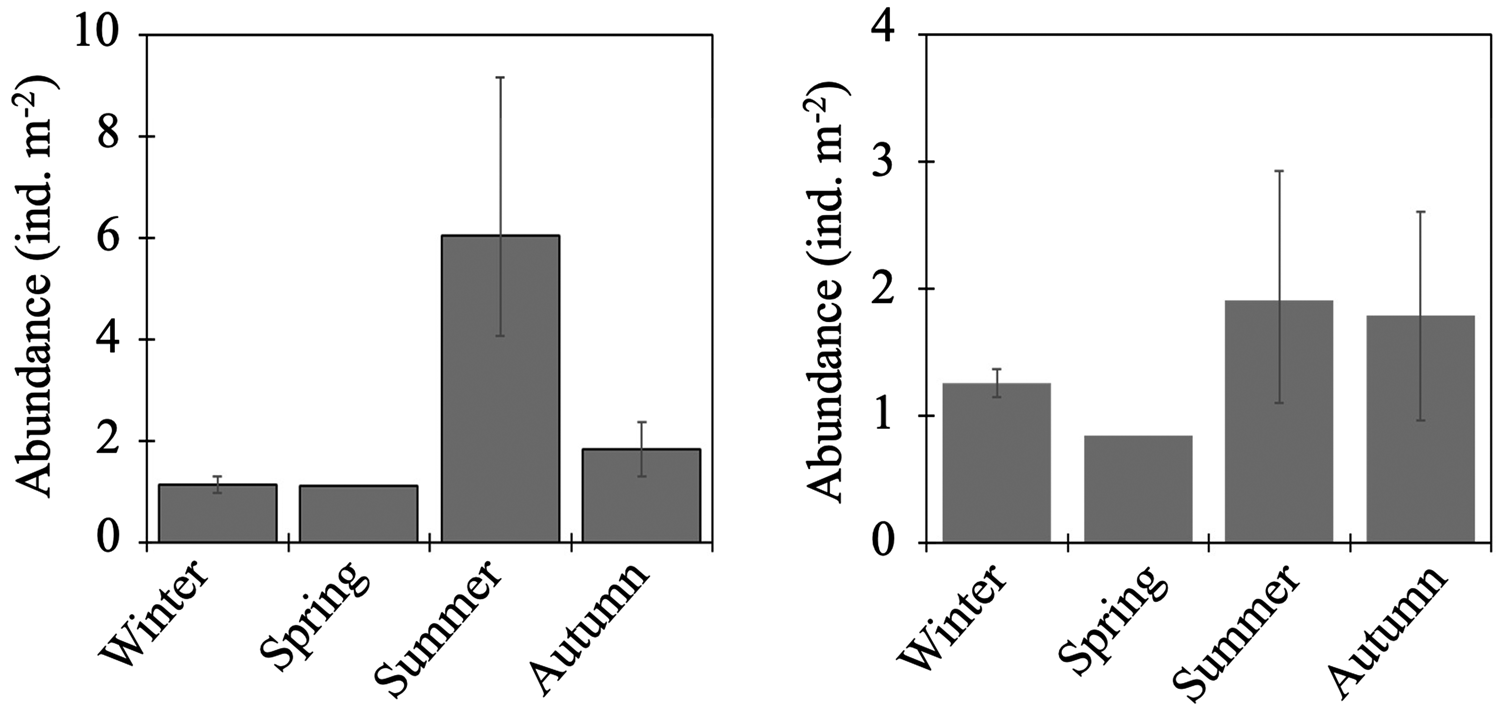
Figure 4. Seasonal vertically integrated total abundance through the 0–1000-m water column (ind. m−2) for fish larvae (left) and juvenile/adult fish (right) at time-series station K2. Whiskers show range of the cruise mean abundances (n = 2 for winter and autumn, n = 3 for summer).
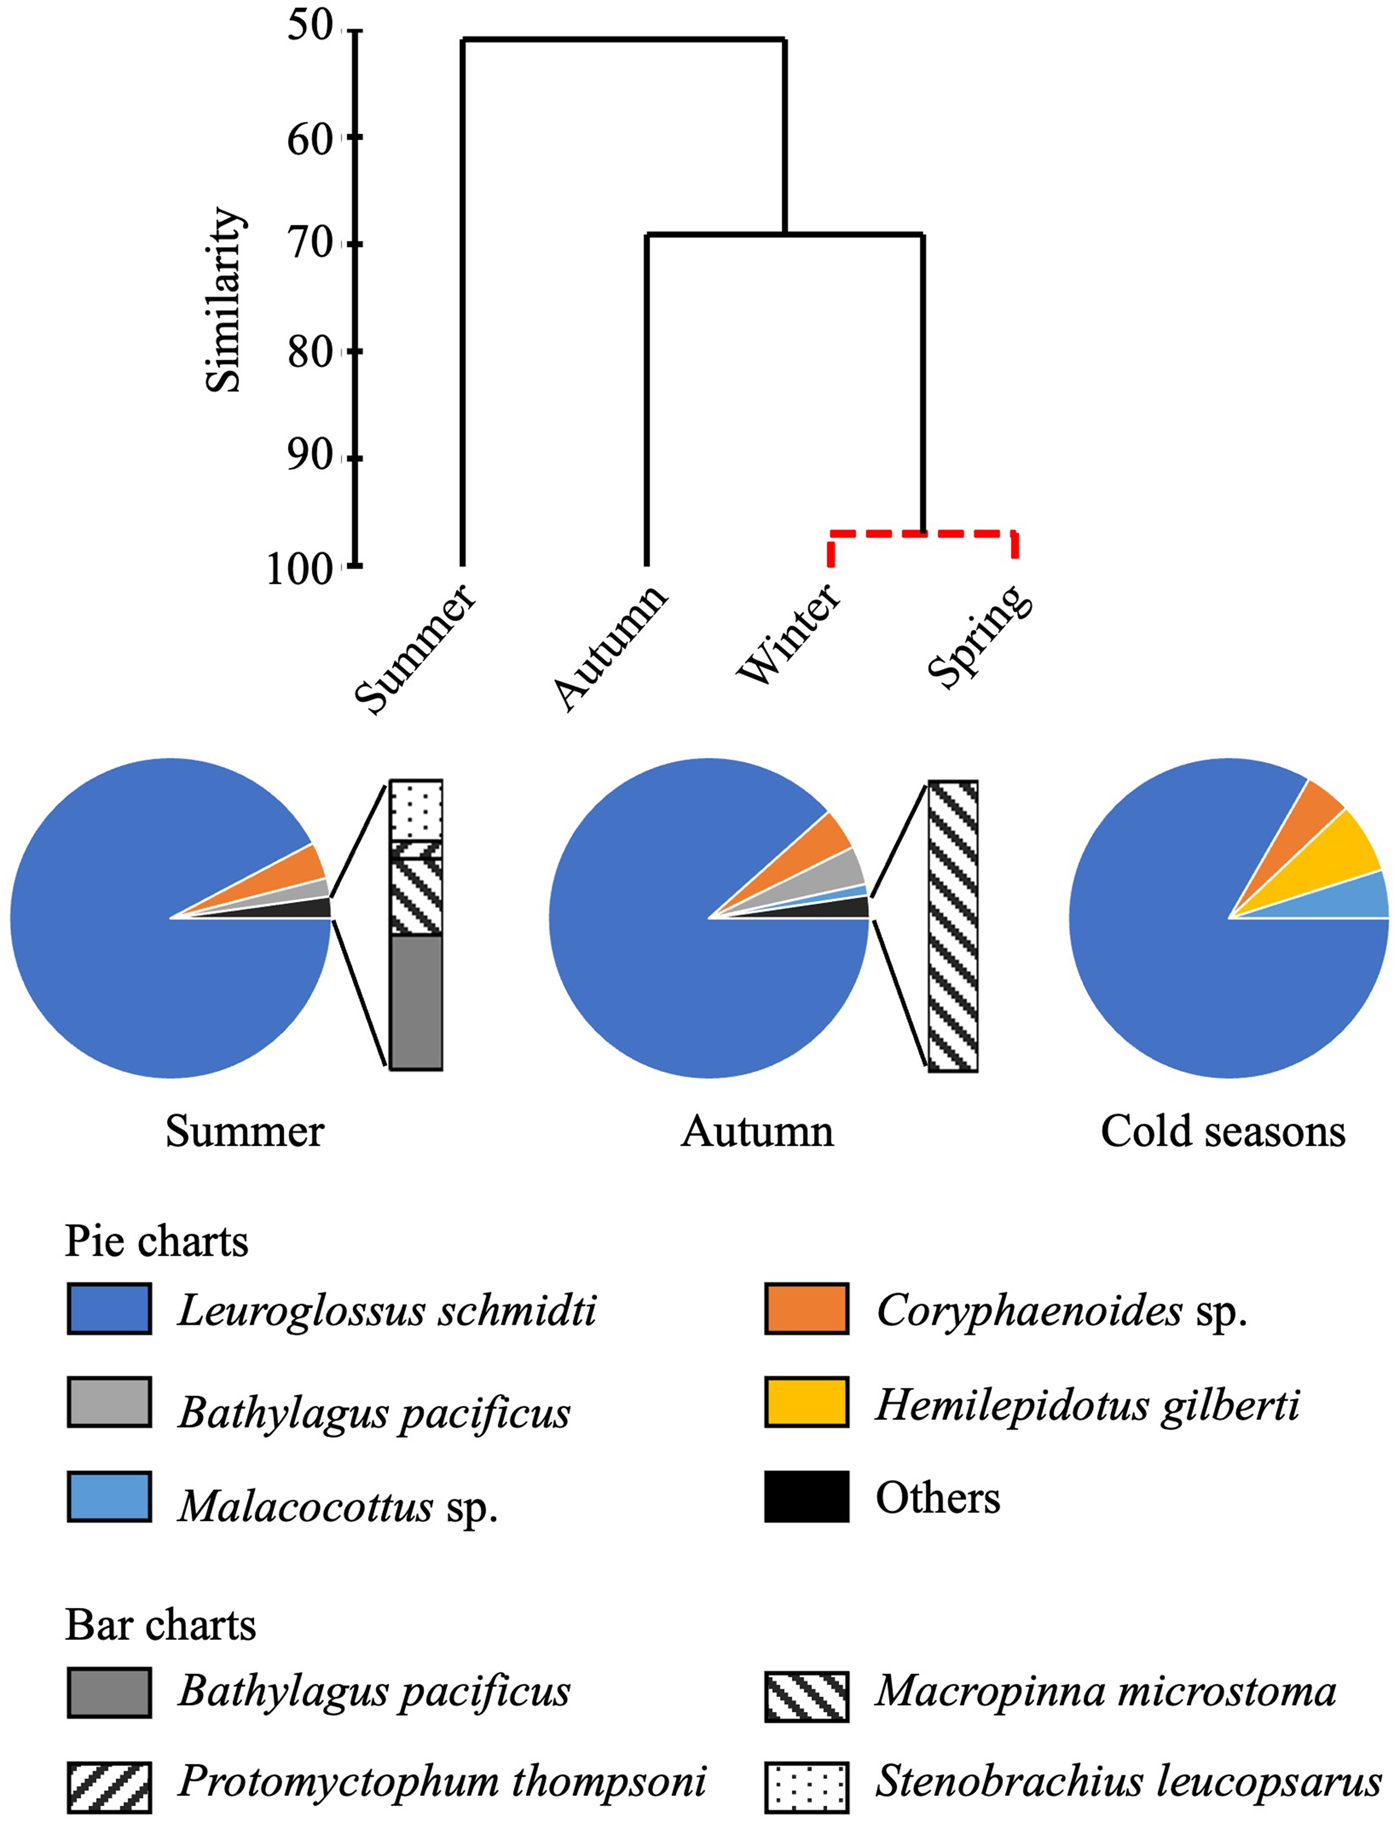
Figure 5. Seasonal change of larval fish communities. Similarity of larval fish communities in different seasons at time-series station K2 derived from hierarchical clustering with the SIMPROF test (top). Solid lines of the dendrogram indicate significantly different communities and groups of communities (P < 0.05) and the red dashed line indicates groups of communities for which the null hypothesis could not be rejected (P > 0.05). Species composition in each group of communities (bottom); composition of the cold season community is based on mean abundances between winter and spring.
Juvenile/adult fish
The 20 species of juvenile/adult fish belonging to seven families were collected (Table 3). The most abundant three species (Stenobrachius nannochir, S. leucopsarus, and L. schmidti) along with Chauliodus macouni occurred throughout the four seasons (Figure 6A–C). The fourth through sixth most abundant species (P. thompsoni, Cyclothone atraria, and Sigmops gracilis) along with P. milleri and Lampanyctus jordani occurred in both the cold and warm seasons, but not in all four seasons (Figure 6D–F). The other 11 species were collected only during the warm seasons; there was no species collected during only the cold seasons. Only for S. leucopsarus in the warm seasons, standard lengths of the collected specimens during day were significantly shorter than nighttime ones (Student's t test, P < 0.05) (Figure 7), that probably affected net avoidance by larger fish. In the warm seasons, the largest specimen collected during day was 56.6 mm SL whereas specimens larger than 57 mm SL occupied 31% of the nighttime community of S. leucopsarus. On the other hand, the large specimens of this species (>57 mm, SL) were collected both during day and night in the cold seasons.
Table 3. Seasonal and annual mean abundance of juvenile/adult fish through the 0–1000-m water column (ind. m-2) at time-series station K2 in the western subarctic Pacific, with standard lengths (mm), wet weights (g) and seasonal variability of diversity indexes
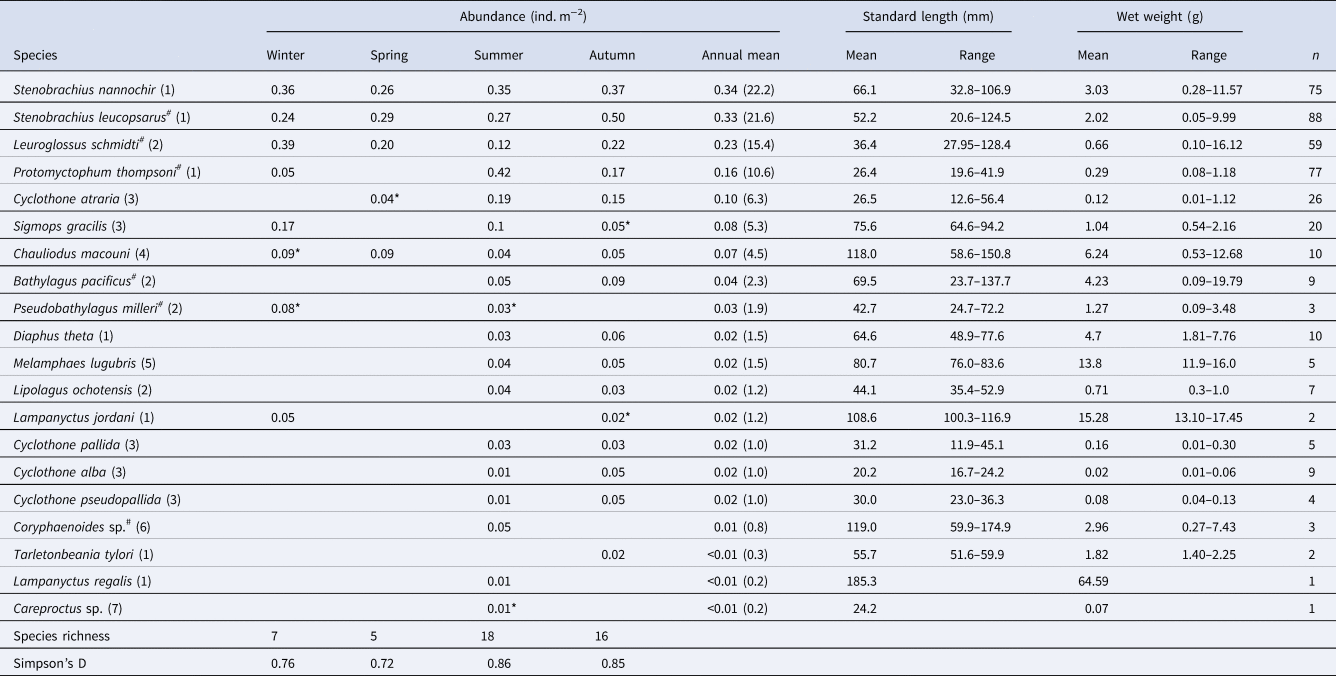
As for species with hashtags, both larval and juvenile/adult specimens were collected in this study. Numbers within parentheses in the species column indicate family for each species: (1) Myctophidae, (2) Bathylagidae, (3) Gonostomatidae, (4) Stomiidae, (5) Melamphaidae, (6) Macrouridae and (7) Liparidae. Although abundances were primarily calculated based on the nighttime samples, data with asterisks were collected during day because of no sample collected during night. A column of annual mean contains an annual mean abundance with its percentages within parentheses for each species.
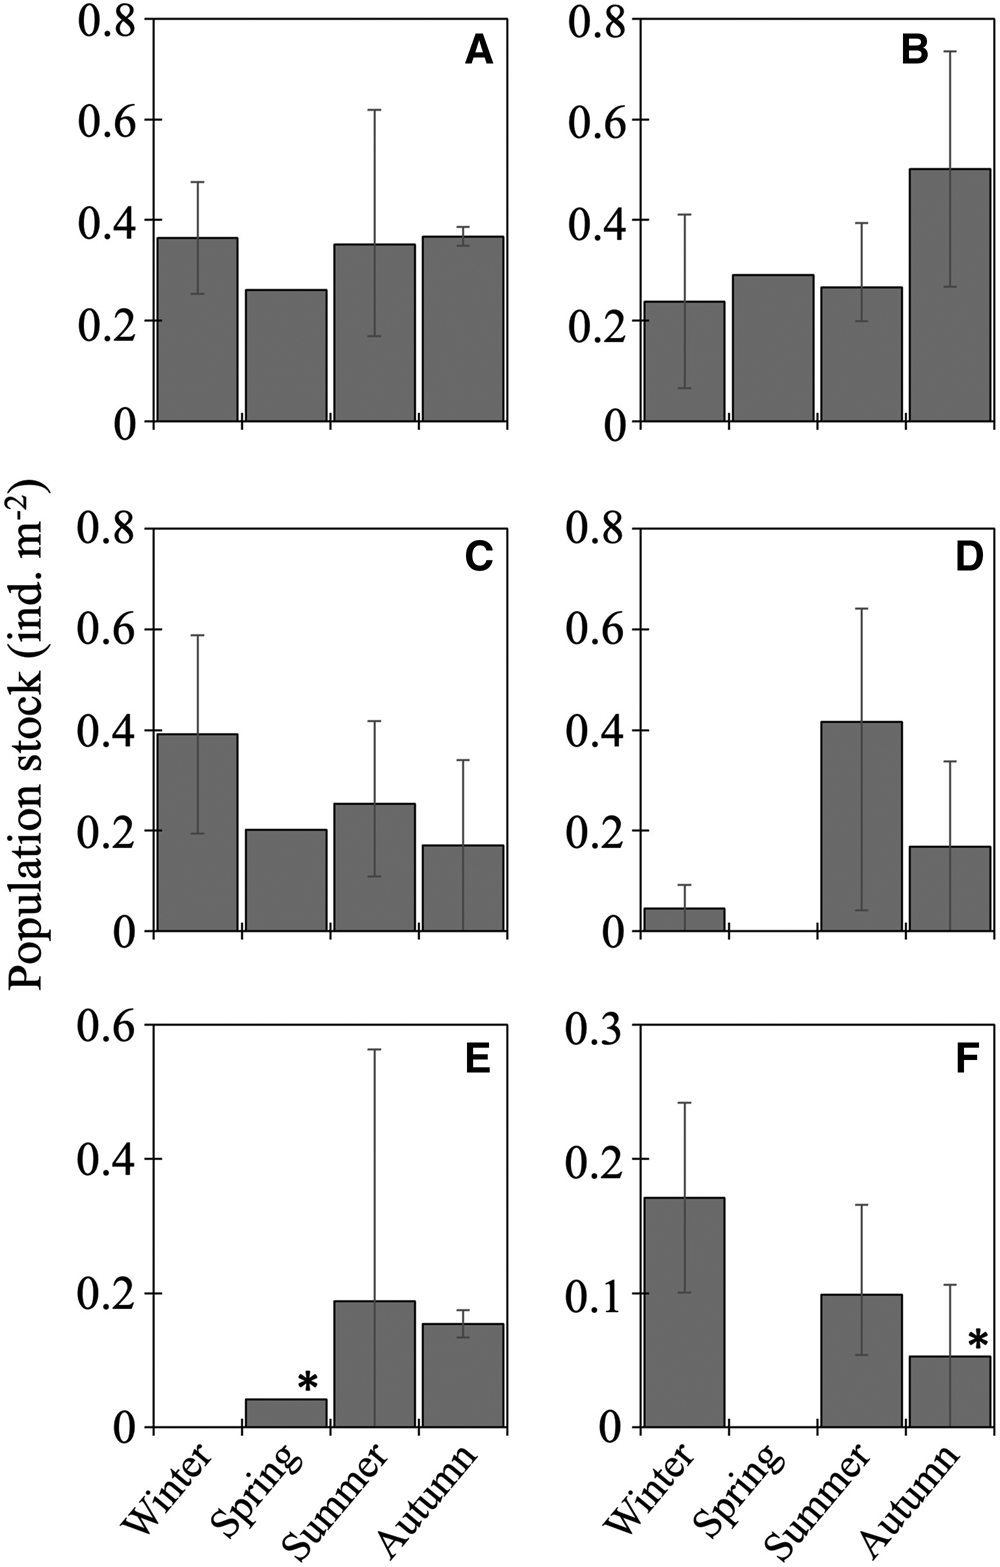
Figure 6. Seasonal vertically integrated abundance through the 0–1000-m water column (ind. m−2) for six dominant juvenile/adult fish at time-series station K2: Stenobrachius nannochir (A), Stenobrachius leucopsarus (B), Leuroglossus schmidti (C), Protomyctophum thompsoni (D), Cyclothone atraria (E), and Sigmops gracilis (F). Abundance is based on nighttime data to reduce the influence of net avoidance by fish except for two data marked with asterisks that were collected in the daytime because no specimen were collected during night. Whiskers show range of the cruise mean abundances. Data for L. schmidti are from Kitamura and Murata (Reference Kitamura and Murata2020).
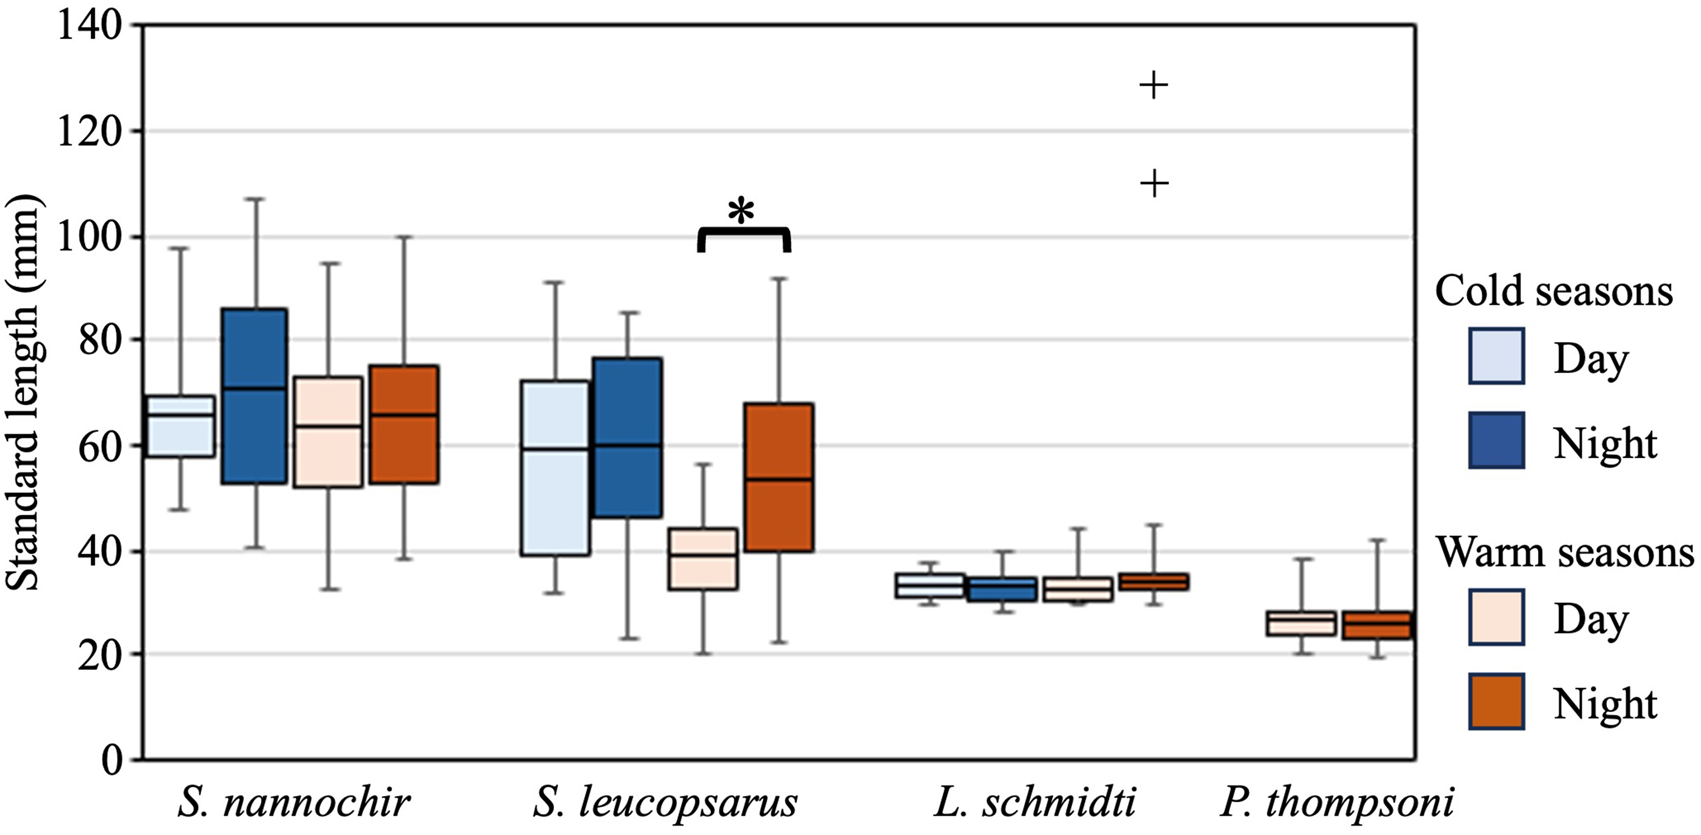
Figure 7. Diel changes of standard lengths of the collected juvenile/adult specimens for four abundant species, Stenobrachius nannochir, Stenobrachius leucopsarus, Leuroglossus schmidti, and Protomyctophum thompsoni at K2. Boxes indicate ranges of the standard lengths where 50% of the population are included in, and horizontal bars in the boxes are the mean standard lengths. Whiskers show the ranges of the standard lengths. Cold seasons include winter and spring whereas warm seasons have summer and autumn. Although two specimens of L. schmidti larger than 100 mm were collected in the warm seasons (shown by plus marks), these were excluded from the comparison as outliers. A significant diel difference is detected in S. leucopsarus during the warm seasons (as shown by asterisk).
Total abundance of juvenile/adult fish through the 0–1000-m water column varied seasonally, with high abundance in the warm seasons and low in the cold seasons (Figure 4). The seasonal variability of abundance of juvenile/adult fish, however, was lower than that of larvae. We classified the juvenile/adult fish based on the Bray–Curtis cluster analysis into cold- and warm-season communities (Figure 8). In the cold season community, the most abundant three species (L. schmidti, S. leucopsarus, and S. nannochir) accounted for 83% of the juvenile/adult fish abundance (Figure 8). In contrast in the warm season community, the proportion of the three species decreased to 52% whereas the abundance of P. thompsoni increased to 16% of total abundance. Species richness was high (16–18 species) and low (5–7 species) during the warm and cold seasons, respectively; species diversities revealed by SID were also high in the warm seasons (0.85–0.86) whereas those in the cold seasons were slightly lower (0.72–0.76) (Table 3).
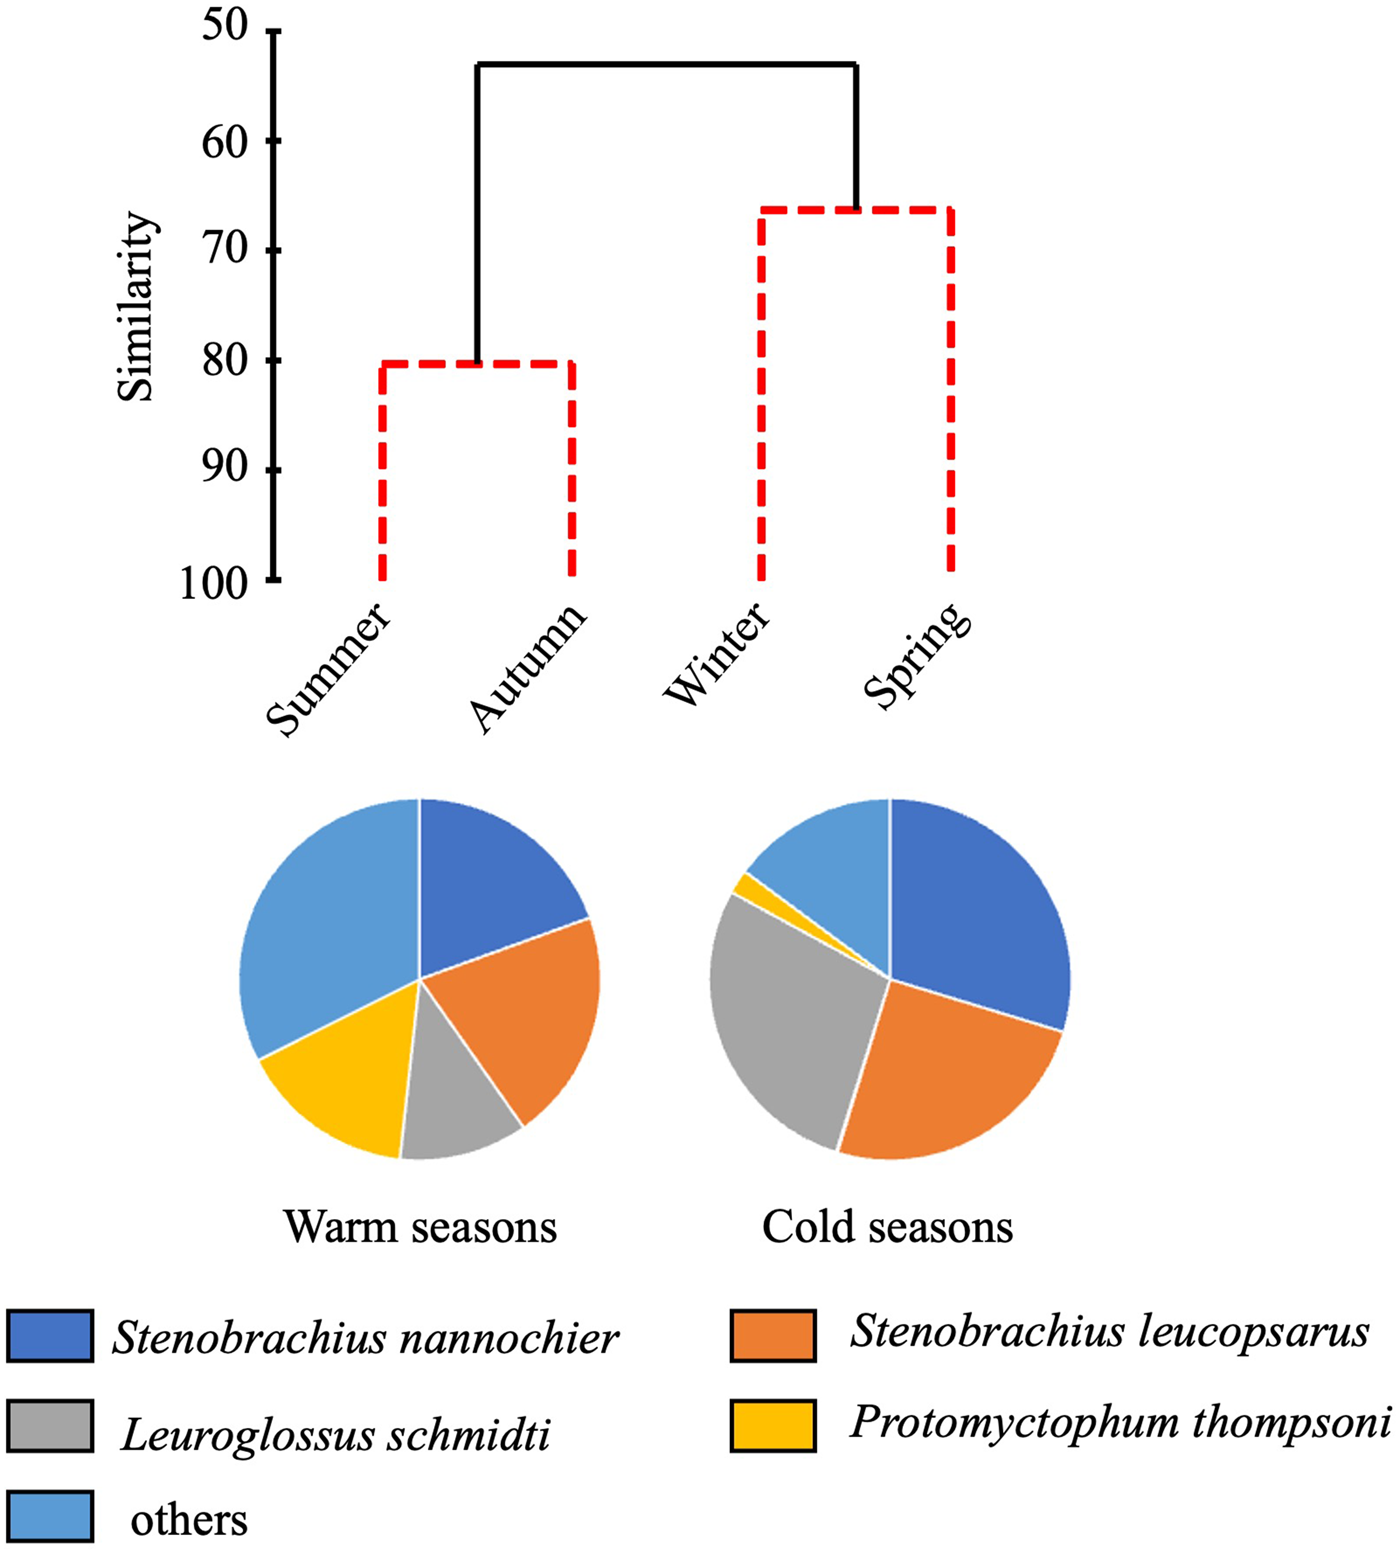
Figure 8. Seasonal change of juvenile/adult fish communities. Similarity of fish communities in different seasons at time-series station K2 derived from hierarchical clustering with the SIMPROF test (top). Solid lines of the dendrogram indicate significantly different groups of communities (P < 0.05) and red dashed lines indicate groups of communities for which the null hypothesis could not be rejected (P > 0.05). Species composition of the warm season community is based on mean abundances between summer and autumn and the cold season community based on mean abundances between winter and spring.
Vertical distribution and migration
Larval fish
Although vertical distributions of fish larvae varied diurnally and seasonally, L. schmidti was the most abundant in almost all depth strata during both day and night throughout the four seasons (Figure 9). In the cold seasons, vertical distributions of fish larvae below 300 m were quite limited. Larval distributions were vertically elongated during the warm seasons, especially in autumn. Peaks in abundance were observed at 100–150 or 200–300 m depth. Although the euphotic layer at K2 was restricted to the upper 50 m (Kitamura et al., Reference Kitamura, Kobari, Honda, Matsumoto, Sasaoka, Nakamura and Tanabe2016), the total abundance of fish larvae in this layer was quite low throughout the four seasons.
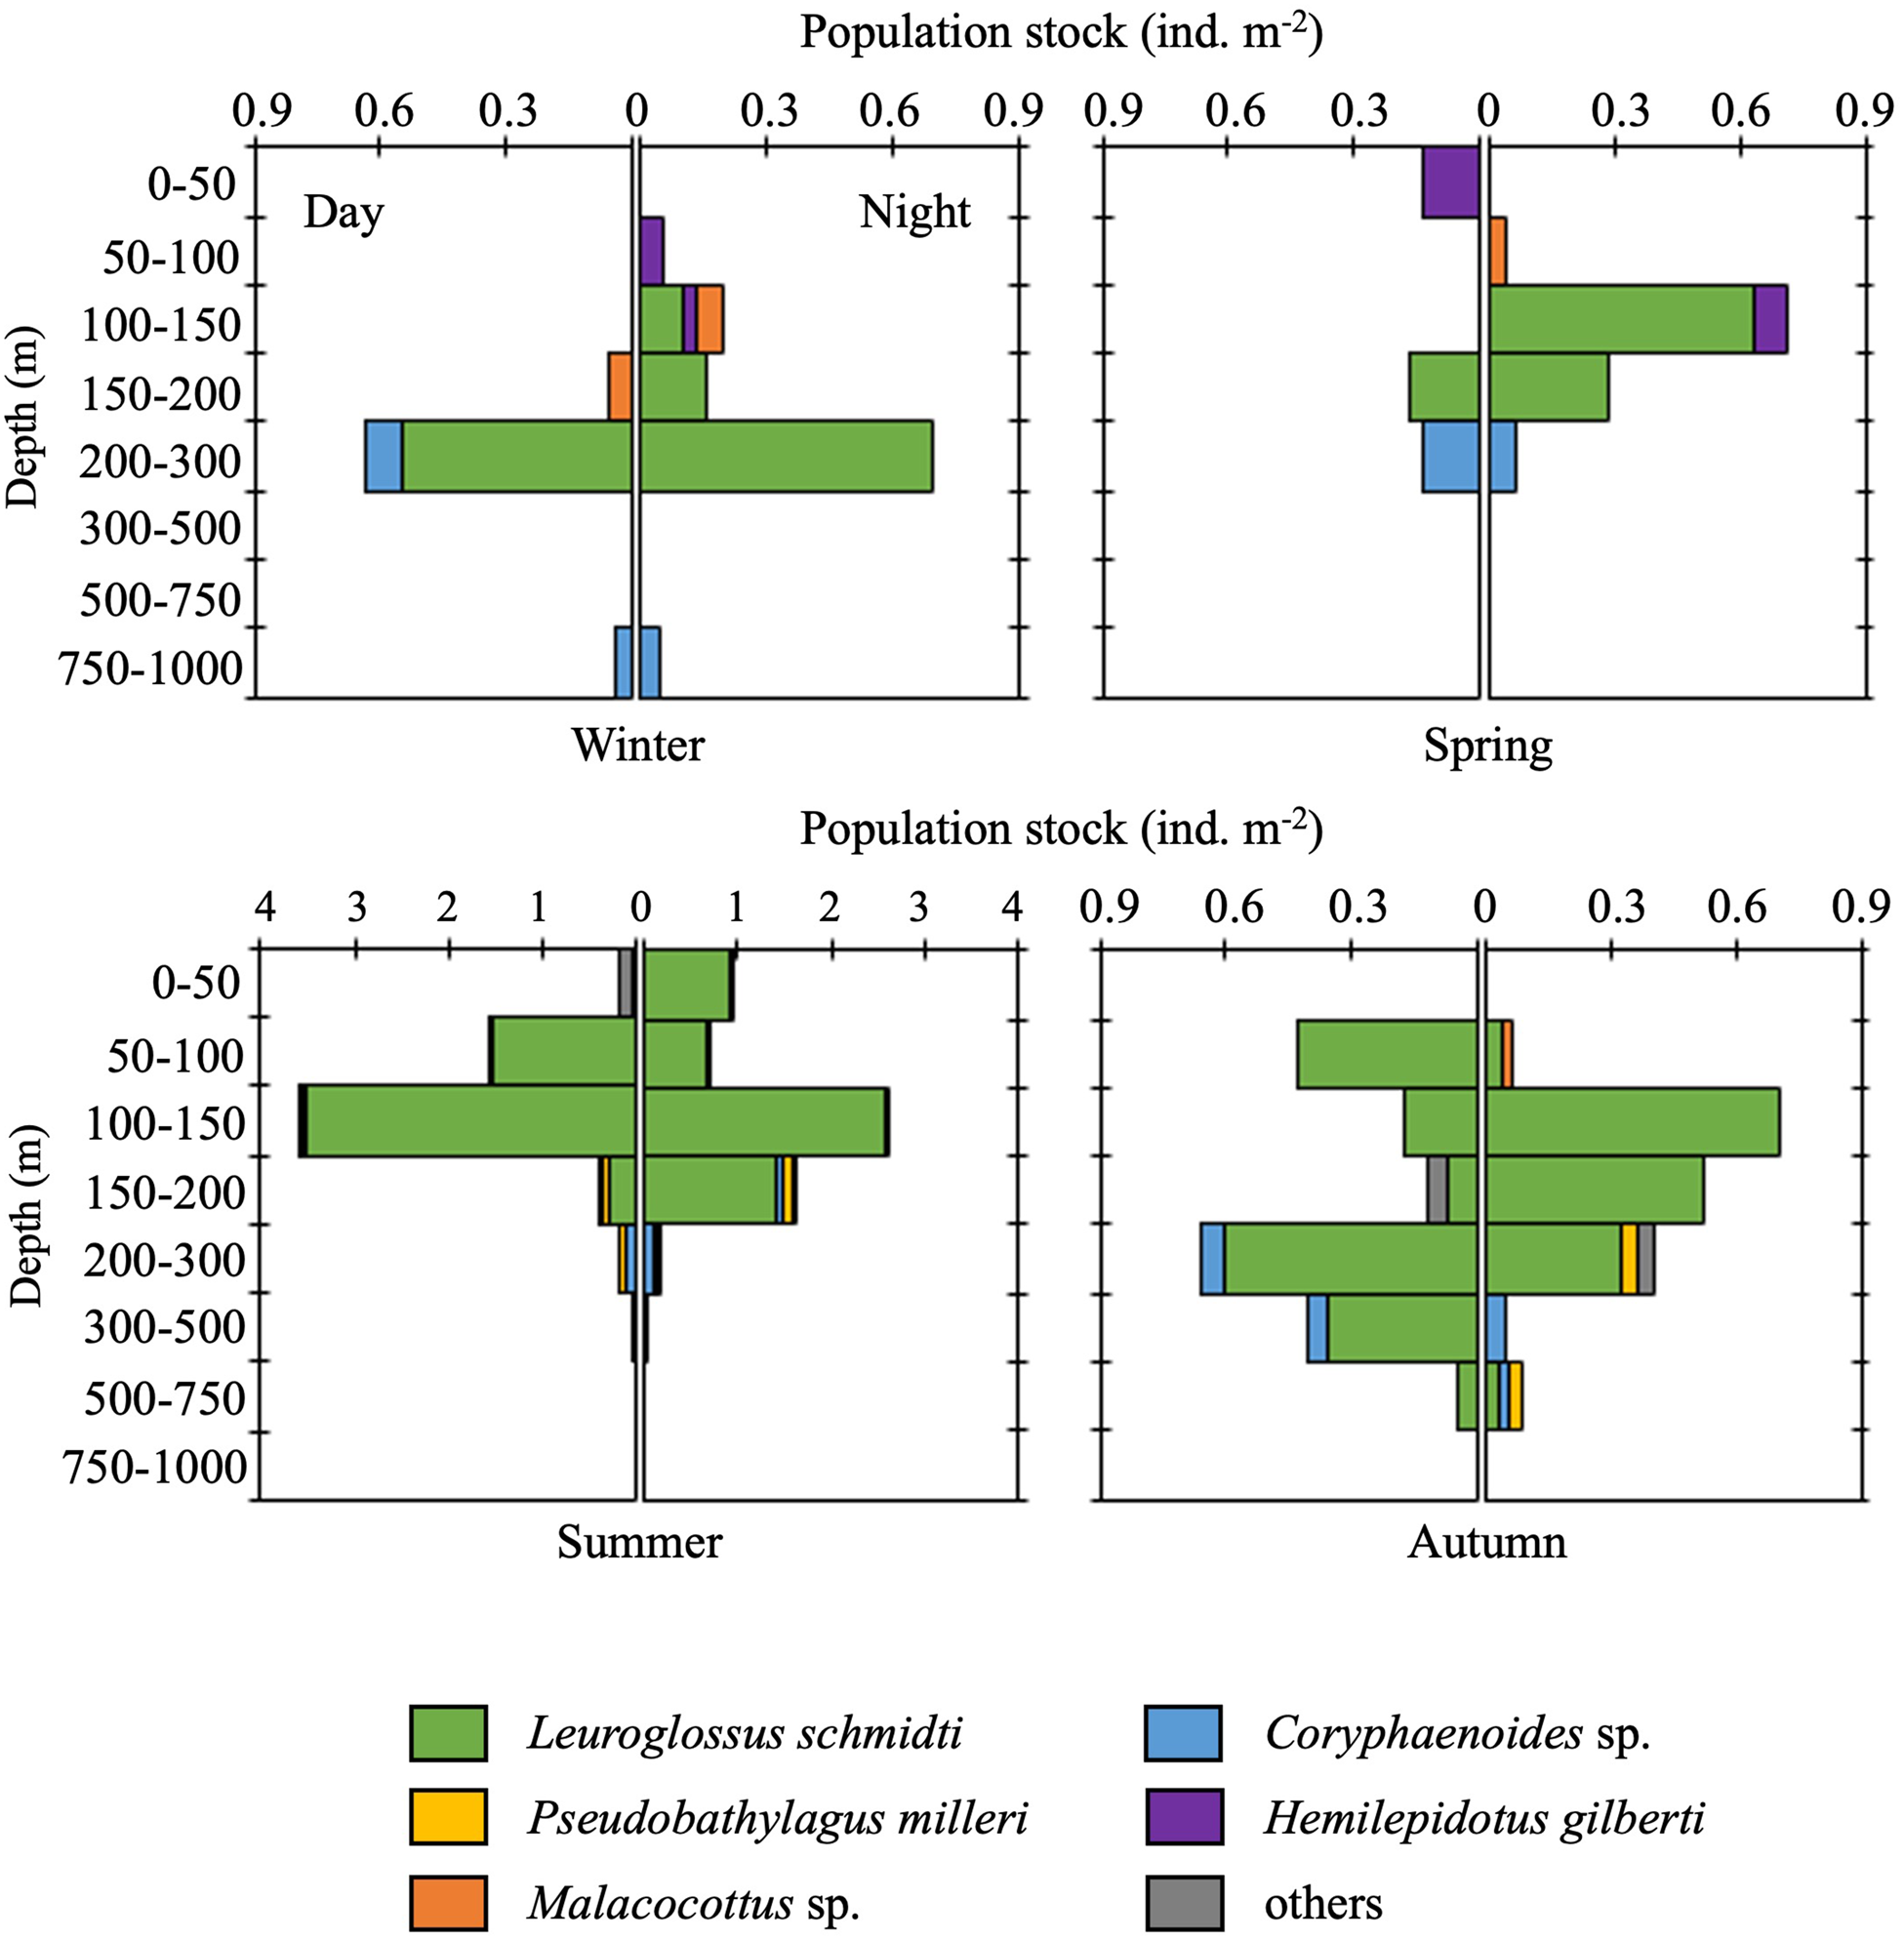
Figure 9. Diel and seasonal vertical distributions of fish larvae at time-series station K2. Note that the scale of the horizontal axes for summer is larger than that in other seasons.
Vertical distribution and migration of the most abundant fish, L. schmidti, and their seasonal changes are here cited briefly from Kitamura and Murata (Reference Kitamura and Murata2020). From summer to autumn, L. schmidti is distributed widely from the surface to 750 m. Hatched larvae at the subsurface (mainly 100–150 m) migrated towards the surface as they grew. Once larvae reached 20 mm in length, they migrated down to midwater, and some of the larger larvae (>24 mm) exhibited DVM. On the other hand, some of the larval population overwintered at depths between 100 and 300 m.
The second most abundant, Coryphaenoides sp., was widely collected from 50 to 1000 m, and their vertical distribution changed not diurnally but ontogenetically (Figure 10). During summer, Coryphaenoides larvae, which were 10–27 mm SL, were distributed from 50 to 500 m with no relationship between depths and standard lengths. After that, they seemed to migrate down with growth (up to 62 mm SL) to below 750 m until winter (Figure 10A, B). In addition, small larvae (<20 mm SL) were also collected at 200–300 m from autumn to spring. We found no evidence of larvae of this species exhibiting DVM. The third most abundant larvae, P. milleri, were primarily distributed at 150–300 m (Table S1); only one specimen was collected from 500 to 750 m. In this species, ontogenetic migration was also recognized: larger larvae were distributed deeper (10.7 ± 2.5 mm SL at 150–200 m, 13.3 ± 2.3 mm SL at 200–300 m, and 35.5 mm SL at 500–750 m, n = 32). This species did not show DVM during summer (daytime and nighttime WMDs were 209 and 198 m, respectively) although DVM during autumn was unclear because none were collected during the day.

Figure 10. Seasonal vertical distribution ranges (A) and standard lengths (B) for larvae of Coryphaenoides sp. at time-series station K2.
Among rare species, H. gilberti, which occurred in the cold seasons only, was distributed above 150 m (Table S1); diel or ontogenetic migration was not recognized due to low abundance. Malacocottus sp., which occurred in all seasons except summer, was collected at 50–200 m (Table S1). Although seasonal increase in their standard lengths was detected (see Result section ‘Larval fish' in ‘Seasonality for occurrence and community structure’), presence or absence of ontogenetic migration was not clear because of the low number of specimens collected. DVM of this species also was not recognized. Bathylagus pacificus and M. microstoma were distributed at 100–200 m and 200–300 m, respectively, without DVM (Table S1). The depths at which three myctophids (P. thompsoni, S. leucopsarus, and Tarletonbeania sp.) were collected differed slightly from each other: 0–50 m for S. leucopsarus, 0–100 m for P. thompsoni, and 100–150 m for Tarletonbeania sp. (Table S1).
Juvenile/adult fish
Unlike larval fish, no juvenile/adult fish was collected from surface layers during daylight (above 300 m in the cold seasons or above 150 or 200 m in the warm seasons); a few species migrated up into epipelagic depths during the night (Figure 11). In the cold seasons, only S. leucopsarus and L. schmidti showed DVM; in the warm seasons, the two species together with Diaphus theta, Tarletonbeania taylori, and Lipolagus ochotensis showed DVMs (Table 4). Note that, results of D. theta, T. taylori, and L. ochotensis were based on the small numbers of materials (Table S3). Among these, the DVMs of S. leucopsarus and L. schmidti were opportunistic; that of L. ochotensis seemed to be opportunistic although collected materials were quite few (n = 7). Total abundances of diel vertical migrants swimming up above 200 m were low (0.14–0.27 ind. m−2) and high (0.38–0.54 ind. m−2) in the cold and warm seasons, respectively. The diel vertical migrants correspond to 17–30% of juvenile/adult mesopelagic fish communities through the 0–1000-m water column.

Figure 11. Diel and seasonal vertical distributions of juvenile/adult mesopelagic fish at time-series station K2.
Table 4. Vertical distribution and diel vertical migration of juvenile/adult of five mesopelagic fish species at time-series station K2
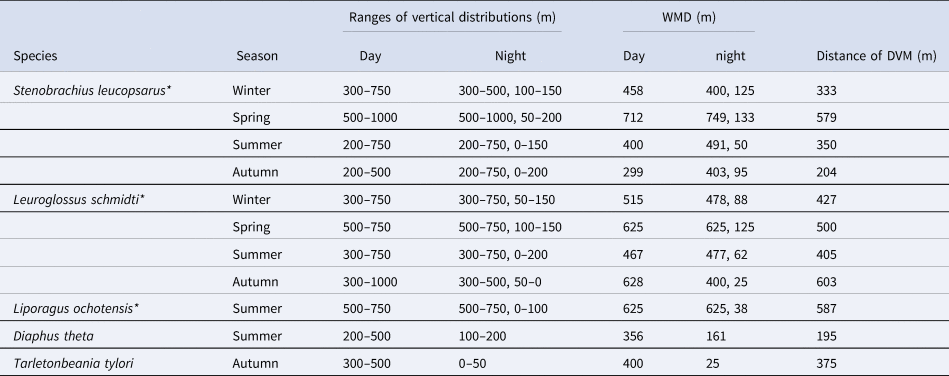
Three species marked with asterisks had opportunistic diel vertical migration (only a part of the population swam up to the surface layer, but others stayed at mesopelagic depths at night). For the three species, nighttime weighted mean depths (WMDs) were calculated separately for both the migratory and non-migratory populations.
Two abundant Stenobrachius species, S. leucopsarus and S. nannochir, had different distribution/migration patterns (Figure 12). During the day, S. leucopsarus was collected from 200 to 750 m in the warm seasons whereas their vertical distribution ranges went down to 300–750 m in winter and 500–1000 m in spring. Dynamic seasonal change of their daytime vertical distribution was also clearly shown by WMDs in the four seasons: 400 (summer), 299 (autumn), 458 (winter), and 712 m (spring). Note that daytime vertical distributions of larger specimens (>57 mm SL) of this species were still not clear during the warm seasons because they were not collected as previously noted (see Result section ‘Juvenile/adult fish' in ‘Seasonality for occurrence and community structure’ and Figure 7). This species showed opportunistic DVM through the four seasons. But percentages of migratory individuals among their population varied seasonally: 84–94% in the warm seasons and 40–58% in the cold seasons. The nighttime distribution of diel vertical migrants was reached to the shallowest sampling layer (0–50 m) in the warm seasons but they did not swim above 50 m depth in the cold seasons. This seasonal difference seemed to have relation to body sizes: smaller specimens were observed in the shallower depths (Figure 13). In 0–50 m layer, only specimens up to 44 mm SL distributed there during night of the warm seasons. In the cold seasons, however, abundance of such small specimens was quite low, no specimen of this species was collected from the shallowest sampling layer. Distances of DVM varied seasonally from 204 m (autumn) to 579 m (spring). Stenobrachius nannochir, whose mean body size was larger than that of S. leucopsarus (Table 3), was distributed deeper than S. leucopsarus without DVM throughout the year (Figure 12). Its vertical distribution also shifted seasonally: averages of day- and nighttime WMDs of this species were 658 (summer), 638 (autumn), 715 (winter) and 851 m (spring). Similar to S. leucopsarus, S. nannochir was distributed in its shallowest depths during autumn, whereas it shifted to its deepest layer during spring. Although the vertical distributions of the two Stenobrachius species only partially overlapped, the seasonal changes of their WMDs were synchronous.

Figure 12. Diel and seasonal vertical distributions for juvenile/adult Stenobrachius leucopsarus (top row) and Stenobrachius nannochir (bottom row) at time-series station K2. Bars show seasonal mean abundances (ind. m−2) which are vertically integrated through each sampling layer.

Figure 13. Diel and vertical changes of standard lengths (mm) for Stenobrachius leucopsarus collected from K2 during the warm (top panels, summer and autumn) and cold seasons (bottom panels, winter and spring). Boxes indicate ranges of the standard lengths where 50% of the population are include in, and vertical bars in the boxes are the mean standard lengths. Whiskers show the ranges of the standard lengths. In the sampling depths where total numbers of the collected materials are less than 10 individuals, all data are plotted. The sample sizes (n) are the total numbers measured.
The third most abundant fish, L. schmidti, was distributed below 300 m during daylight and a part of this population (13–38%) showed DVM (Figure 11). ΔWMD changed from 405 m in summer to 603 m in autumn. Details of the DVM of this species were reported by Kitamura and Murata (Reference Kitamura and Murata2020). During their DVM, nighttime distribution depths in the epipelagic layer changed seasonally. Migrating specimens swam up to the shallowest sampling depths (0–50 m) during the warm seasons, whereas no fish migrated into this layer during the cold seasons. Smaller juveniles tended to have lower DVM activity than larger ones.
Among three other diel vertical migrants, D. theta and T. taylori migrated between the upper part of the mesopelagic and surface layers: from 200–500 to 50–200 m for the former species and from 300–500 to 0–50 m for the latter species (Table S2). For these two species, no specimen was collected from the mesopelagic layer at night. In contrast, L. ochotensis seasonally changed its DVM manner (Table S2). In summer, it was distributed at 500–750 m during the day, whereas most of the population (94%) migrated up to above 100 m during the night. Although this species was also collected in autumn, then it was distributed from 500 to 750 m during both the day and night.
The fourth most abundant fish, P. thompsoni, was distributed between 150 and 500 m without DVM. During the warm seasons, a peak in its abundance was recognized at 200–300 m (Figure 11) and it accounted for 60–87% of the total fish abundance in this layer. In the cold seasons, however, this species was collected only from 150 to 200 m with quite low abundance during winter. For Cyclothone, four species were collected mainly in the warm seasons and their vertical distributions fell into two patterns. Cyclothone alba and C. pseudopallida were distributed above 500 m without DVM, and their vertical distributions mostly overlapped each other during both the day and night (Table S2). The other two Cyclothone species were distributed in deeper layers. Cyclothone atraria was distributed below 500 and 300 m during the day and night, respectively (Table S2). Although the vertical range of its distribution was elongated upward at night, ΔWMDs did not support the presence of upward migration for C. atraria. Cyclothone pallida was collected at 500–750 and 300–1000 m during the day and night, respectively, but DVM was not clear because the numbers of specimens collected at night were quite low.
Vertical distributions of S. gracilis and P. milleri were limited to within 300–500 m and 500–750 m, respectively, whereas those of Bathylagus pacificus (500–1000 m), Chauliodus macouni (300–1000 m), Coryphaenoides sp. (200–1000 m) and Melamphaes lugubris (300–500 and 750–1000 m) were wide (Table S2). Among them, Coryphaenoides sp. and M. lugubris were collected only at night. One of the P. milleri specimens (24.7 mm SL) collected during winter was just metamorphosing, although a larval P. milleri specimen of 35.5 mm was also collected between 500 and 750 m (see Result section ‘Larval fish' in ‘Vertical distribution and migration’).
Discussion
Limitations and advantages of this study
We used a relatively smaller net system (1.5-m2 mouth area) compared with other sampling gear for fish, such as the Issacs–Kidd midwater trawl with up to 7.5-m2 mouth area (Issacs and Kidd, Reference Issacs and Kidd1953). Although underestimation due to net avoidance by fish is inevitable in abundance estimation based on trawl sampling (Gjøsaeter and Kawaguchi, Reference Gjøsaeter and Kawaguchi1980), it is probably more substantial in the present study. The total number of mesopelagic fish species obtained in this study (27 species) was lower than those in previous records in the western part of the subarctic Pacific (86 species by Beamish et al., Reference Beamish, Leask, Ivanov, Balanov, Orlov and Sinclair1999). This was probably due to higher net avoidance by fish, a restricted research area (only at K2) in the present study, or both. However, Willis et al. (Reference Willis, Pearcy and Parin1988) reported that only seven species (C. macouni, C. atraria, D. theta, L. schmidti, P. thompsoni, S. leucopsarus, and S. nannochir) accounted for 91.8% of the individuals captured from the western subarctic Pacific. These seven species were also abundant in the juvenile/adult community observed by the present study that accounted for 82.1%. We considered that basic structure of mesopelagic fish community was successfully described in this study.
In the present study, vertical distributions and migrations of all the abundant species as well as other species are shown. Due to use of smaller sampling gear, numbers of collected materials for the latter species were relatively small (Table S3). Although we obtained species-specific vertical distribution and migration patterns for them, further study based on much more materials collected by using larger net system is needed. On the other hand, the vertical resolution of the distributions we observed (eight layers through the 0–1000-m water column) was finer than those in previous studies, such as Beamish et al. (1999; three layers between 0 and 1000 m). And our field samplings successfully covered in all four seasons that revealed seasonal changes in fauna and in vertical distribution of and migration by mesopelagic fish. In addition, we investigated not only juvenile/adult fish but also larval fish. Research on fish larvae has been limited in oceanic areas of the western subarctic Pacific, unlike in the Okhotsk Sea (Davydova et al., Reference Davydova, Shebanova and Andreeva2007; Andreeva and Shebanova, Reference Andreeva and Shebanova2010) or the transition region (Kubota et al., Reference Kubota, Ooseki and Kimura2001; Tsukamoto et al., Reference Tsukamoto, Zenitani, Kimura, Watanabe and Oozeki2001; Sassa et al., Reference Sassa, Kawaguchi, Oozeki, Kubota and Sugisaki2004b). Thus, this study also provides useful baseline information for larval fish ecology there.
Community
Larvae
In the Okhotsk Sea and the Pacific waters along the Kurils/Kamchatka, 64 taxa of fish larvae have been recorded, and coastal and demersal species were numerically abundant (Davydova et al., Reference Davydova, Shebanova and Andreeva2007; Andreeva and Shebanova, Reference Andreeva and Shebanova2010; Mukhametva and Mukhametov, Reference Mukhametva and Mukhametov2022). In comparison, the larval fish community at K2 had lower species richness (10 species) and a higher percentage of mesopelagic species (93%). Only H. gilberti was common to both K2 and the Okhotsk/Kuril/Kamchatka waters. In addition, the larval fish community at K2 also differed from those at the transition region located south of our study site. In the transition region, 37 species of larval mesopelagic fish were recorded, myctophid larvae dominated, and the myctophid community was more diverse (28 species) (Sassa et al., Reference Sassa, Kawaguchi, Oozeki, Kubota and Sugisaki2004b; Reference Sassa, Kawaguchi and Taki2007). Furthermore, Kubota et al. (Reference Kubota, Ooseki and Kimura2001) reported 80 species of larval and early stage juvenile fish in the transition region: myctophids (11–45%) as well as Japanese anchovy (41–79%) were dominant in the community. Compared to the larval fish community in the transition region, the K2 community had lower species diversity and lower myctophid abundance; the absence at K2 of epipelagic fish larvae such as Japanese anchovy was also a big difference. Between the transition region and K2, larvae of four mesopelagic fish (B. pacificus, L. schmidti, P. milleri, and P. thompsoni) occurred in common.
On the eastern side of the subarctic Pacific, mesopelagic bathylagids and myctophids together with walleye pollock and deep-sea pleuronectids formed the larval fish community in the continental slope area, where abundances of these mesopelagic fish larvae tended to be high (Doyle et al., Reference Doyle, Mier, Busby and Brodeur2002; Lanksbury et al., Reference Lanksbury, Duffy-Anderson, Mier and Wilson2005). However, the oceanic community in the eastern subarctic Pacific contained larvae of only mesopelagic fish, such as Myctophidae and Chauliodonitidae, with low diversity and their abundances were lower than those in the shelf break areas (Norcross et al., Reference Norcross, McKinnell, Frandsen, Musgrave and Sweet2003). Unfortunately, Norcross et al. (Reference Norcross, McKinnell, Frandsen, Musgrave and Sweet2003) showed a species list not in the oceanic area of the eastern subarctic Pacific but in the subarctic domain including the shelf break area. Between the subarctic domain and K2, however, four larvae (L. schmidti, P. milleri, P. thompsoni, and S. leucopsarus) occurred in common. Characteristics of the larval fish community at K2 (dominance of the mesopelagic fish species, low species diversity and low abundance) were relatively similar to those in the oceanic area of the eastern subarctic Pacific.
Although 20 species of juvenile/adult fish were collected in this study, larvae of 14 of the 20 species were not found at K2. Among these 14 species, four myctophids (D. theta, Lampanyctus jordani, S. nannochir, T. taylori) and a bathylagid (L. ochotensis) are known to migrate southward across the subarctic front for reproduction, and the hatched larvae grow in the Kuroshio or transition regions (Moku et al., Reference Moku, Tsuda and Kawaguchi2003; Sassa et al., Reference Sassa, Kawaguchi, Oozeki, Kubota and Sugisaki2004b; Sassa, Reference Sassa, Nagai, Saito, Suzuki and Takahashi2019). Larvae of Lampanyctus regalis and S. gracilis were abundant in the transition region (Sassa et al., Reference Sassa, Kawaguchi, Oozeki, Kubota and Sugisaki2004b, Reference Sassa, Kawaguchi and Taki2007) and those of M. lugubris were observed only in the subarctic front in the eastern subarctic Pacific (Norcross et al., Reference Norcross, McKinnell, Frandsen, Musgrave and Sweet2003). Thus, these species also probably migrate horizontally between southern spawning/nursery areas and subarctic feeding grounds. These horizontal migrations may decrease the species richness of the larval fish community at K2. In addition, the abundance of all of the mesopelagic fish larvae collected at K2 was very low except for L. schmidti. In the Gulf of Alaska, larvae of P. thompsoni and S. leucopsarus were abundant over the slope area (Lanksbury et al., Reference Lanksbury, Duffy-Anderson, Mier and Wilson2005) and mesopelagic fish larvae were more abundant in the shelf break stations compared to the oceanic area (Norcross et al., Reference Norcross, McKinnell, Frandsen, Musgrave and Sweet2003). For many mesopelagic fish species that spawn in the subarctic oceans, the main nursery grounds may be distributed in slope areas rather than oceanic areas. Perhaps prey resources in the slope area are more appropriate for these larvae. Primary productivity in the WSG, including K2, is low compared with the Kamchatka/Kuril area, especially during spring (Kitamura et al., Reference Kitamura, Kobari, Honda, Matsumoto, Sasaoka, Nakamura and Tanabe2016). Also, the copepods that dominate the epipelagic layer in the WSG are large oceanic Neocalanus and Eucalanus (Yamaguchi et al., Reference Yamaguchi, Watanabe, Ishida, Harimoto, Furusawa, Suzuki, Ishizaka, Ikeda and Takahashi2002; Kitamura et al., Reference Kitamura, Kobari, Honda, Matsumoto, Sasaoka, Nakamura and Tanabe2016). Furthermore, the nauplius larvae of the dominant Neocalanus do not occur in the epipelagic layer because they hatch in the meso- or bathypelagic layers (Miller et al., Reference Miller, Frost, Batchelder, Clemons and Conway1984). In slope waters, in contrast, small copepods such as Pseudocalanus spp. were dominant together with large copepods (Coyle and Pinchuk, Reference Coyle and Pinchuk2005).
Unlike in the Okhotsk or transition region waters, only limited fish species use the interior area of the WSG around K2 as their nursery ground. In contrast, spawning and larval growth of L. schmidti has been widely observed not only in coastal waters, but also in oceanic areas all over the subarctic Pacific (Dunn, Reference Dunn1983; Mason and Philips, Reference Mason and Philips1985; Sobolevsky and Sokolovskaya, Reference Sobolevsky and Sokolovskaya1996). Low abundance of competitors may allow L. schmidti to dominate the larval fish community at K2. Larvae of L. schmidti are distributed mainly from subsurface to upper mesopelagic layers (Kitamura and Murata, Reference Kitamura and Murata2020). Although they show ontogenetic upward migration to the sea surface, larvae larger than 20 mm sink down to the mesopelagic layer again. Thus, they are distributed near the sea surface only during a limited span of their larval stage. At K2, the second most abundant larvae, Coryphaenoides sp., also were not collected near the sea surface. Dominance by larvae that are not strongly associated with the surface layer is a characteristic feature of the larval fish community at K2.
Juvenile/adult fish
In the present study, 18 of 20 collected species were identified to the species level and all of them were previously reported from the WSG, Russian waters along the Kamchatka/Kuril area, or both (Beamish et al., Reference Beamish, Leask, Ivanov, Balanov, Orlov and Sinclair1999; Ivanov and Sukhanov, Reference Ivanov and Sukhanov2015; Orlov and Tokranov, Reference Orlov and Tokranov2019). Numerically, L. schmidti, P. thompsoni, S. leucopsarus, and S. nannochir were the most abundant members of the juvenile/adult fish community at K2, which is consistent with previous research in the western subarctic Pacific (Willis et al., Reference Willis, Pearcy and Parin1988; Beamish et al., Reference Beamish, Leask, Ivanov, Balanov, Orlov and Sinclair1999). In addition, other dominants (C. macouni, C. atraria, and D. theta) listed by Willis et al. (Reference Willis, Pearcy and Parin1988) were also abundant at K2.
As noted in Discussion section ‘Larvae' in ‘Community’, only limited fish species use the WSG area as their nursery ground. Thus, the juvenile/adult fish community at K2 is thought to be formed by overlapping of three types of species: species hatched and grown in the WSG (Coryphaenoides sp. and L. schmidti), horizontal migratory species from the southern area (D. theta, L. jordani, L. ochotensis, L. regalis, M. lugubris, S. gracilis, S. nannochir, and T. tylori), and those from the slope area in the subarctic Pacific (P. thompsoni and S. leucopsarus). But the types of other eight species collected at K2 (C. macouni, B. pacificus, P. milleri, C. alba, C. atraria, C. pallida, C. pseudopallida, and Careproctus sp.) are still not clear.
Insights into the fish fauna during the cold seasons is one of the important results of this study. In the mesopelagic layer below the permanent thermocline at K2, physical conditions did not change seasonally. The zooplankton community at K2 had a mesopelagic biomass peak where dormant copepods such as Neocalanus and diel vertical migratory Metridia pacifica dominated; the peak was maintained through the year (Kitamura et al., Reference Kitamura, Kobari, Honda, Matsumoto, Sasaoka, Nakamura and Tanabe2016). So, from warm to cold seasons, physical and trophic conditions in the mesopelagic layer at K2 are thought to be largely static, especially for species without DVM, but both the species richness and total abundance are low. One of the possible reasons for the low species richness and total abundance is the previously mentioned horizontal migration for reproduction. In fact, S. nannochir, L. jordani, and T. taylori, are thought to migrate southward from autumn to winter (Sassa et al., Reference Sassa, Kawaguchi, Oozeki, Kubota and Sugisaki2004b). Moku et al. (Reference Moku, Tsuda and Kawaguchi2003) suggested that D. theta matures and migrates for spawning one year after hatching. At K2, this species occurred in the warm seasons only. The suggestion by Moku et al. (Reference Moku, Tsuda and Kawaguchi2003) could explain the absence of this species at K2 during the cold seasons. In contrast, the most abundant S. nannochir, which is also a southward migratory species, occurred at K2 throughout the four seasons. Although maturation size and age of this species are not known, the closely related S. leucopsarus becomes reproductively mature when it reaches about 65 mm in length, which corresponds to four years of age (Smoker, Reference Smoker1970). Immature population of S. nannochir probably stay at K2 throughout the year if the age of their maturation is similar to that of S. leucopsarus. The presence or absence of southward migratory fish at K2 during the cold seasons is partially explained by their maturation strategies.
Vertical distribution, migration, and their seasonality
Larval fish
In the world's oceans, many larval fish, including mesopelagic species, are distributed in the epipelagic layer during both day and night (e.g., Sabates, Reference Sabates2004; Sassa, Reference Sassa, Nagai, Saito, Suzuki and Takahashi2019; Nagaiwa et al., Reference Nagaiwa, Tachibana and Moteki2023). At K2, however, abundances of larval fish were low, especially in the most productive euphotic layer shallower than 50 m. This low abundance was a characteristic feature of the larval fish community there; consequently, grazing and feeding pressures by the larval fish community on primary producers and zooplankton seems to be low. The low abundances of mesopelagic fish larvae in the epipelagic layer at K2 are probably caused by multiple factors. Survival and growth of fish larvae are influenced by water temperature and food resources (e.g., Houde, Reference Houde1989; Cushing, Reference Cushing1990; McCormick and Molony, Reference McCormick and Molony1995). Mesopelagic fish species whose larvae cannot thrive in the water temperatures of the subarctic ocean probably migrate southward before spawning; even for fish species whose larvae are well adapted to subarctic water temperatures, the prey resources in the epipelagic layer at K2 are probably unsuitable for larval fish (see Discussion section ‘Larvae’ in ‘Community'). In addition, competition with large zooplankton such as Neocalanus or Eucalanus for prey resources may influence the abundance of larval fish. Because euphausiids are the major invertebrate predators on pollock larvae (Bailey et al., Reference Bailey, Brodeur, Merati and Yoklavich1993), they may predate other larvae at night (Brodeur and Rugen, Reference Brodeur and Rugen1994).
In the mesopelagic layer, ontogenetic vertical migration of Coryphaenoides sp. larvae was clearly detected. Seven species of Coryphaenoides were previously reported from the western subarctic Pacific and all of them were demersal fish from bathyal to abyssal depths (Orlov and Tokranov, Reference Orlov and Tokranov2019); so, this species probably uses the mesopelagic layer as its nursery and the larvae change their distribution from shallower to deeper waters with growth. Ontogenetic downward migration was already reported off Oregon for Coryphaenoides acrolepis (Stein, Reference Stein1980). At K2, the abundance of Coryphaenoides sp. larvae was the highest during summer and their greatest abundance was observed at 200–300 m. These results suggest that the hatching of larvae mainly occurs at this depth during summer. In addition to the larval population sinking down to greater depths, small larvae were also collected at 200–300 m from autumn to spring, although population densities at the 200–300 m were low. This occurrence pattern suggests two possibilities: (1) spawning of this species occurs throughout the year, or (2) some of the larval population (probably hatched later in the reproduction season) overwinter. Unfortunately, because of the small numbers of collected specimens, the reason for this continuous occurrence of Coryphaenoides sp. larvae remains unclear; further investigations are needed. In addition, because the total length of the largest larva was 62.2 mm whereas that of the smallest juvenile was 59.9 mm, this species probably metamorphoses at around 60 mm.
At K2, DVM by larval fish was recognized for larger larvae of L. schmidti (>24 mm SL) between the upper mesopelagic and surface layers (Kitamura and Murata, Reference Kitamura and Murata2020) but we could not detect it in other species. Previously, many researchers suggested no DVM for mesopelagic fish larvae (e.g., Sassa et al., Reference Sassa, Kawaguchi, Hirota and Ishida2004a; Watanabe et al., Reference Watanabe, Sassa and Ishida2010), but Sabates (Reference Sabates2004) described reverse DVM. Larval fish have limited capacity to migrate vertically (Sassa, Reference Sassa, Nagai, Saito, Suzuki and Takahashi2019) and the vertical distances of DVM seem to be several dozens of metres as in the larvae described by Sabates (Reference Sabates2004). To detect DVM for larval fish, the stratified sampling in the present study (an interval of 50 m in the upper 200 m of the water column) was likely too coarse.
Juvenile/adult fish
The vertical distributions and migrations of the two abundant myctophids, S. leucopsarus and S. nannochir, differed. The former species was distributed at shallower depths with opportunistic DVM and the latter at greater depths without DVM, although their vertical distributions partially overlapped. These same differences in vertical distributions and DVMs among these two species were also recognized in the transition region (Watanabe et al., Reference Watanabe, Moku, Kawaguchi, Ishimaru and Ohno1999) and the Bering Sea (Furuhashi and Shimazaki, Reference Furuhashi and Shimazaki1989) and were interpreted as niche partitioning (Moku et al., Reference Moku, Kawaguchi, Watanabe and Ohno2000). In addition, we found that daytime WMDs of S. leucopsarus and day–night means of WMDs for S. nannochir changed in synchrony through the seasons: shallowest in autumn and deepest in spring. In reality, it was possible that daytime WMDs of S. leucopsarus during the warm seasons were somewhat different from those estimated in this study because our sample collections in these seasons were affected by net avoidance by larger fish. However, the larger specimens of S. leucousarus only occupied 31% of their population in the warm seasons. In addition, most of the larger specimens likely distributed above 750 m (same as the smaller ones) in the warm seasons because their vertical distribution was not extended below the 750 m even in winter. So, we consider that estimated daytime distributions for S. leucopsarus during the warm seasons were probably reasonable and there are synchronous migrations by the two Stenobrachius species. The vertical distributions of these two species rarely overlap and they distributed each other in different niches in any season. For S. leucopsarus and S. nannochir, the presence of high levels of wax esters in their body was well known (Butler and Pearcy, Reference Butler and Pearcy1972; Saito and Murata, Reference Saito and Murata1996). Although wax esters may play an important role in buoyancy (Phleger, Reference Phleger1998), Butler and Pearcy (Reference Butler and Pearcy1972) suggested another role: a long-term energy reserve. And Vollenweider et al. (Reference Vollenweider, Heintz, Schaufler and Bradshaw2011) revealed a seasonal change of lipid content, peaked in autumn and declined to a minimum in spring, in more than half of mesopelagic fish species which they observed in the eastern North Pacific. The seasonal change in lipid content probably resulted from metabolic consumption during the cold seasons, and we speculate that specific gravities of the mesopelagic fish are also changed seasonally. In addition, swimming with pectoral fins spreading provides lifting force (Tsukamoto, Reference Tsukamoto1993). During the cold seasons, however, the swimming activity seems to be decreased down at least for S. leucopsarus as shown by their lower DVM activity. The lower lipid content and the lower swimming activity may affect deepening of vertical distributions for S. leucopsarus and S. nannochir synchronously during the cold seasons observed in the present study. Or the deepening distribution of S. leucopsarus may depress down the S. nannochir distribution. This hypothesis still lacks quantitative proof, further research is needed.
We detected DVM by S. leucopsarus throughout the four seasons at K2, but it stopped during winter in the Bering Sea (Brodeur and Yamamura, Reference Brodeur and Yamamura2005). Another geographical difference in DVM possibly exists in D. theta although number of our collected specimens is quite low (n = 10, Table S3): it swam up into the upper 50 m in the Gulf of Alaska (Frost and McCrone, Reference Frost and McCrone1979) but did not migrate into the surface layer in the western Pacific (Watanabe et al., Reference Watanabe, Moku, Kawaguchi, Ishimaru and Ohno1999; present study). One possible explanation could be geographical differences in predation pressures. That is, several piscivorous sea birds such as the northern fulmar and Laysan albatross are much more abundant in the western subarctic Pacific compared with the eastern side (Sydeman et al., Reference Sydeman, Thompson, Santra, Henry, Morgan and Batten2010). In this study, DVM was also recognized in L. ochotensis, and its DVM seems to be opportunistic. Although opportunistic DVM has been known only from S. leucopsarus and L. schmidti (Brodeur and Yamamura, Reference Brodeur and Yamamura2005; Kitamura and Murata, Reference Kitamura and Murata2020), this type of DVM seems to be more common in mesopelagic fish than previously thought. During the cold seasons at K2, DVMs were detected in only two species: S. leucopsarus and L. schmidti, but compared to the warm seasons, smaller portion of populations showed DVM. Activities of DVMs seem to be decreased down in the cold seasons.
Among non-diel migratory species, P. thompsoni was distributed between 150 and 500 m at K2, which is similar to the vertical distribution reported from the transition region of the western Pacific (Watanabe et al., Reference Watanabe, Moku, Kawaguchi, Ishimaru and Ohno1999), off Oregon (Frost and McCrone, Reference Frost and McCrone1979), and in the Alaskan Gyre (Pearcy et al., Reference Pearcy, Krygier, Mesecar and Ramsey1977). Sigmops gracilis at K2 was collected only from 300 to 500 m depth without seasonal variability. Although this species is widely distributed in the subarctic and subtropical Pacific, mainly on the western side, detailed vertical distribution with its seasonal change seems to not have been investigated before the present study. Previously, the vertical range of its distribution was simply reported as 100–500 m around Japan (Nakabo, Reference Nakabo2013) or 300–800 m in the western Pacific and its marginal seas (Orlov and Tokranov, Reference Orlov and Tokranov2019). Chauliodus macouni was widely collected from 300 to 1000 m at K2 and WMDs of this species were observed as 400–500 m except during winter. Although the depth range of its distribution was previously reported as 25–4231 m (Allen and Smith, Reference Allen and Smith1988), the peak in its abundance was observed above 500 m off Oregon (Pearcy et al., Reference Pearcy, Krygier, Mesecar and Ramsey1977; Willis and Pearcy, Reference Willis and Pearcy1982). The vertical distribution of C. macouni at K2 was similar to that off Oregon.
At K2, the vertical distributions of four Cyclothone species had two patterns: C. alba and C. pseudopallida were distributed in the shallower layer (above 500 m) whereas C. atraria and C. pallida were observed at greater depths (below 500 and 300 m during day and night, respectively), which is consistent with the vertical distributions of these species off Japan (Nakabo, Reference Nakabo2013). The vertical distributions of Cyclothone at K2 are also similar to those off Oregon (Willis and Pearcy, Reference Willis and Pearcy1982): peaks in abundance of C. atraria were observed at 600–1000 m at K2 and at 600–800 m off Oregon, and WMDs of C. pseudopallida were at 400 m at K2, whereas it was most abundant at 500 m off Oregon. For DVM in Cyclothone species, although many investigations showed an absence of DVM (e.g., Miya and Nemoto, Reference Miya and Nemoto1987; Brodeur and Yamamura, Reference Brodeur and Yamamura2005), Willis and Pearcy (Reference Willis and Pearcy1982) reported DVM. The suggestion by Willis & Pearcy was based on horizontal net sampling during both day and night: the abundance of Cyclothone species at a particular depth during night was significantly higher than that at the same depth during day (at 500 m for C. pseudopallida, at 800 m for C. atraria). The authors concluded that the increasing abundance during night corresponded to populations that swam up to those depths from deeper layers. At K2, WMDs without diel variability suggest the absence of DVM, but depth ranges of the two species (C. atraria and C. pallida) elongated upward during night. We categorize the two species as non-migratory species at this time, but the diel variabilities of depth ranges could suggest the presence of DVM. Further investigation is needed to understand the biology and ecology of the most abundant vertebrate on the earth.
Recently, vertical transport of carbon from the epipelagic into mesopelagic layers by vertical migrants has attracted attention as the mesopelagic migrant pump (Boyd et al., Reference Boyd, Claustre, Levy, Siegel and Weber2019). Although the western subarctic Pacific is known as a hot spot of biological draw-down of atmospheric carbon into the ocean (Takahashi et al., Reference Takahashi, Sutherland, Sweeney, Poisson, Metzl, Tilbrook, Bates, Wanninkhof, Feely, Sabine, Olafsson and Nojiri2002), the roles of mesopelagic fish in the mesopelagic migrant pump there have not been evaluated. Consistent with global warming, sea surface temperatures at K2 show decadal increase (Kitamura & Sasaoka, unpublished data). Furthermore, a marine heat wave was observed in the western subarctic Pacific, including the K2 area (Pak et al., Reference Pak, Noh, Park, Jin and Park2022). However, the biological response to ocean warming has not been studied in this region. In the future, investigations to understand these issues are required. We believe that the present study showing community structure, seasonal occurrences, and the vertical distribution and migration of mesopelagic fish provides important baseline information for future studies.
Supplementary material
The supplementary material for this article can be found at https://doi.org/10.1017/S0025315424000845.
Acknowledgements
We thank the captains, crews, field technicians, and other scientists onboard R/V Mirai for their support during sample collections. We also express our appreciation to Dr M.C. Honda at the Japan Agency for Marine-Earth Science and Technology (JAMSTEC) for his leadership on the project of K2 biogeochemical time series. And we are grateful to the editor and three anonymous reviewers for constructive review comments.
Author Contributions
MK designed the study, carried out field sampling onboard, identification and enumeration of materials, analysed data, and wrote the initial manuscript. NM contributed to identification and enumeration of materials. Both authors have read and approved the final manuscript.
Financial Support
Field and lab support for this study was provided by Japan Agency for Marine-Earth Science and Technology (JAMSTEC) through the K2S1 project and the K2 biogeochemical time-series study.
Competing interest
The authors declare no competing interests.
Data Availability
Vertical distributions of seasonal mean abundances of mesopelagic fish are available within the supplementary materials. Other data that support the findings of this study are available from the corresponding author, MK, upon reasonable request.


