


1. Introduction
An intracranial aneurysm is a localized dilation of the wall of an intracranial artery, forming a cavity connected to the curved parent vessel (i.e. the intracranial artery). Pulsatile blood flow applies stresses on this cavity's wall, which result in growth, through biomechanics-driven remodelling processes (Wang et al. Reference Wang, Uhlmann, Vedula, Balzani and Varnik2022). This remodelling can lead to the rupture of the aneurysmal wall and consequently to subarachnoid haemorrhage, with high morbidity and mortality (Ajiboye et al. Reference Ajiboye, Chalouhi, Starke, Zanaty and Bell2015).
Flow in intracranial aneurysms can be studied as the combination of two canonical flows: flow over a cavity (i.e. the aneurysmal sac) and flow in a curved pipe (i.e. the parent vessel). As separate flows, these have been extensively studied (Eustice Reference Eustice1910; Dean Reference Dean1928; Weiss & Florsheim Reference Weiss and Florsheim1965; Burggraf Reference Burggraf1966; Pan & Acrivos Reference Pan and Acrivos1967; McConalogue & Srivastava Reference McConalogue and Srivastava1968; Collins & Dennis Reference Collins and Dennis1975; Karl, Henry & Tsuda Reference Karl, Henry and Tsuda2004; Faure et al. Reference Faure, Adrianos, Lusseyran and Pastur2007; Hammami et al. Reference Hammami, Ben-Cheikh, Ben-Beya and Souayeh2018; Mignot, Cai & Riviere Reference Mignot, Cai and Riviere2019; Najjari, Cox & Plesniak Reference Najjari, Cox and Plesniak2019; Guo, Gong & Zhang Reference Guo, Gong and Zhang2020).
The main characteristic of steady flow in curved vessels is the shift of the peak of the velocity profile towards the outer wall, which can lead to the development of secondary vortices (Williams, Hubbell & Fenkell Reference Williams, Hubbell and Fenkell1902; Eustice Reference Eustice1910, Reference Eustice1911). The flow solution depends on a single non-dimensional number: the Dean number  $De = Re \sqrt {\kappa ({D}/{2})}$ (Dean Reference Dean1927, Reference Dean1928; McConalogue & Srivastava Reference McConalogue and Srivastava1968), where
  $D$ is the diameter of the tube,
  $\kappa$ the curvature of the centreline and
  $Re$ the Reynolds number. However, the flow in arteries is pulsatile, and thus depends on another non-dimensional number: the Womersley number (Womersley Reference Womersley1955)
  $Wo = R \sqrt {{2{\rm \pi} }/(T\nu)}$, where
  $R$ is the radius of the tube,
  $T$ the period of the flow and
  $\nu$ the kinematic viscosity.
Flow over different cavity geometries has been studied for different geometries (sphere and rectangle), with different aspect ratios (Weiss & Florsheim Reference Weiss and Florsheim1965; Burggraf Reference Burggraf1966; Pan & Acrivos Reference Pan and Acrivos1967; Karl et al. Reference Karl, Henry and Tsuda2004; Faure et al. Reference Faure, Adrianos, Lusseyran and Pastur2007; Mignot et al. Reference Mignot, Cai and Riviere2019; Guo et al. Reference Guo, Gong and Zhang2020). Flow patterns vary with respect to the cavity aspect ratio and  $Re$. At low
  $Re$, the flow expands into the cavity but does not separate from the wall. As
  $Re$ increases (
 $Re \geq 100$), the flow separates and recirculates in the cavity forming a vortex, which grows as
  $Re$ increases. If the cavity's depth is much larger than its width, secondary vortices can be formed at the bottom of the cavity (counter-rotating with the main vortex) (Pan & Acrivos Reference Pan and Acrivos1967; Shen & Floryan Reference Shen and Floryan1985). The majority of studies have focused on square cavities, with few focused on ellipsoidal cavities. Higdon (Reference Higdon1985) showed the influence of the opening angle of a circular cavity on flow separation for steady inflow: for a wide opening, the flow in the cavity remains attached, whereas a smaller opening leads to flow separation and the formation of a vortex in the cavity. Transient effects on flow in a cavity were studied by Sobey (Reference Sobey1980) and Gillani & Swanson (Reference Gillani and Swanson1976), showing that the separation depends on the Reynolds and Strouhal (or Womersley) numbers.
Computational fluid dynamics (CFD) and particle image velocimetry (PIV) are the most common approaches to investigate the fluid dynamics in aneurysms, in idealized or patient-specific geometries, before and after treatment. Asgharzadeh & Borazjani (Reference Asgharzadeh and Borazjani2019) created idealized aneurysm geometries, with varying dome shapes and neck sizes, resulting in different aneurysm volumes. They characterized flow patterns for different geometries before treatment. However, they focused their analysis on the ratio of the neck width and the diameter of the parent vessel, but did not consider any other geometrical parameters of the aneurysmal cavity (e.g. aneurysmal sac size or aspect ratio). Moriwaki, Tajikawa & Nakayama (Reference Moriwaki, Tajikawa and Nakayama2020) investigated the effect of the sac morphology as well as the neck size and shape on haemodynamics, using PIV measurements in several aneurysm models attached to a straight vessel, before and after treatment. They showed that stagnation was less likely to happen in aneurysms with large necks and lower aneurysm heights, as well as smaller dome size. However, the geometry of the dome is not the only influencing geometrical parameter. Indeed, the haemodynamics in the sac also depends on the geometry of the parent vessel (Imai et al. Reference Imai, Sato, Ishikawa and Yamaguchi2008). Previous research has highlighted the important role of the parent vessel curvature (Xu et al. Reference Xu, Wu, Yu, Lv, Wang, Karmonik, Liu and Huang2015; Shojima Reference Shojima2017; Barbour et al. Reference Barbour, Chassagne, Chivukula, Machicoane, Kim, Levitt and Aliseda2021; Chassagne et al. Reference Chassagne, Barbour, Chivukula, Machicoane, Kim, Levitt and Aliseda2021; Mandrycky et al. Reference Mandrycky2023). Curvature and bending angles of the artery impact not only the pre-treatment haemodynamics, but also the success of treatment (Larrabide et al. Reference Larrabide, Geers, Morales, Aguilar and Rüfenacht2015; Rinaldo et al. Reference Rinaldo, Brinjikji, Cloft, Kallmes and Rangel-Castilla2019). After having analysed the geometry and the outcomes after treatment with flow-diverting stents (FDS) of 105 aneurysms, Sunohara et al. (Reference Sunohara2021) concluded that an aneurysm neck located on the outer wall of the curved artery is a predictor for incomplete occlusion after treatment. Additionally, numerical simulation of 23 patient aneurysms (Larrabide et al. Reference Larrabide, Geers, Morales, Aguilar and Rüfenacht2015) showed that flow reduction induced by the FDS was greater for aneurysms located further away from the curvature peak or on the inner side of the bend.
Recently, endovascular treatments have been developed that induce the formation of a stable thrombus filling the cavity, isolating its wall from blood flow mechanical stresses. Coils can be placed inside the aneurysm or a stent can be deployed along the parent vessel (Pierot & Wakhloo Reference Pierot and Wakhloo2013), reducing flow into the cavity and increasing stasis, leading to the formation of a stable thrombus (Rayz et al. Reference Rayz, Boussel, Ge, Leach, Martin, Lawton, McCulloch and Saloner2010; Ngoepe et al. Reference Ngoepe, Frangi, Byrne and Ventikos2018). Flow-diverting stents are high-porosity tubular meshes deployed along the parent artery wall, across the aneurysmal neck. The mesh increases the resistance to flow into the aneurysm, reducing aneurysmal inflow. The porosity of the FDS is a key aspect of the treatment as high blockage may lead to occlusion of side branches (Bhogal et al. Reference Bhogal, Ganslandt, Bäzner, Henkes and Pérez2017), but a too high porosity may lead to little resistance to flow and incomplete embolization of the aneurysm. About 15 %–25 % of treatments with FDS fail to form a thrombus filling the entire cavity, leaving the aneurysm at risk of rupture (Lubicz et al. Reference Lubicz, Collignon, Raphaeli, Pruvo, Bruneau, De Witte and Leclerc2010; Brinjikji et al. Reference Brinjikji, Cloft, Fiorella, Lanzino and Kallmes2013; Adeeb et al. Reference Adeeb2017; Luo et al. Reference Luo2020; Hanel et al. Reference Hanel, Monteiro, Nelson, Lopes and Kallmes2022; Simgen et al. Reference Simgen, Roth, Kulikovski, Papanagiotou, Roumia, Dietrich, Mühl-Benninghaus, Kettner, Reith and Yilmaz2022). A recent study, focusing on 445 patients treated with FDS (Pipeline Embolization Device; Medtronic, Dublin, Ireland), reported that complete aneurysm occlusion was achieved for 72 %, 78 % and 87 % of the patients at 6, 12 and 24 months after treatment, respectively (Bender et al. Reference Bender, Colby, Lin, Jiang, Westbroek, Xu, Campos, Huang, Tamargo and Coon2018). The outcome of the treatment with FDS depends on numerous parameters such as location (Sunohara et al. Reference Sunohara2021), aneurysm size or shape (Daou et al. Reference Daou, Atallah, Chalouhi, Starke, Oliver, Montano, Jabbour, Rosenwasser and Tjoumakaris2019) and neck size (Cebral et al. Reference Cebral, Mut, Raschi, Hodis, Ding, Erickson, Kadirvel and Kallmes2014; Su et al. Reference Su, Reymond, Brina, Bouillot, Machi, Delattre, Jin, Lövblad and Vargas2020). These geometrical parameters also play a very important role in predicting aneurysm rupture (Fung et al. Reference Fung2019; Kocur et al. Reference Kocur, Przybyłko, Niedbała and Rudnik2019). A recent meta-analysis revealed that aneurysm size and aspect ratio were the parameters with the strongest correlation with aneurysm rupture (Liang et al. Reference Liang, Steinman, Brina, Chnafa, Cancelliere and Pereira2019). For all these reasons, a better understanding of the role of fluid dynamics, and how it is influenced by aneurysm geometry, in the success or failure of stent treatment is crucial to better predict treatment outcomes.
Haemodynamics, heavily influenced by the anatomy of the aneurysm, plays a large role in the prediction of aneurysm occlusion after treatment (Cebral et al. Reference Cebral, Mut, Raschi, Hodis, Ding, Erickson, Kadirvel and Kallmes2014). Using CFD, Mut et al. (Reference Mut, Raschi, Scrivano, Bleise, Chudyk, Ceratto, Lylyk and Cebral2015) observed that fast aneurysm embolization was associated with lower values of post-treatment mean velocity, inflow rate and shear stress. More specifically, mean velocity in the aneurysm (Mut et al. Reference Mut, Raschi, Scrivano, Bleise, Chudyk, Ceratto, Lylyk and Cebral2015) and its reduction induced by stent placement (Zhang, Chong & Qian Reference Zhang, Chong and Qian2013) could be used to predict occlusion. Experimental measurements with a plasma-based fluid, which had the capability of coagulating, showed that the presence of vortices and areas of high velocity after treatment would prevent thrombus formation (Gester et al. Reference Gester, Lüchtefeld, Büsen, Sonntag, Linde, Steinseifer and Cattaneo2016; Clauser et al. Reference Clauser, Knieps, Büsen, Ding, Schmitz-Rode, Steinseifer, Arens and Cattaneo2018).
Recent work analysed the effect of the aneurysm geometry on haemodynamics after FDS treatment. A study of 19 aneurysms treated with FDS observed that a decreasing dome-to-neck ratio was a predictor of treatment failure (Shapiro, Becske & Nelson Reference Shapiro, Becske and Nelson2017). Similarly, a numerical study of six patient aneurysm geometries showed that aspect ratio impacted flow stasis after treatment (Altındağ et al. Reference Altindağ, Bahadir Olcay, Furkan Tercanli, Bilgin and Hakyemez2023). However, in another study of 21 patients treated with FDS, no geometric parameters (aneurysm size or volume and neck size) were found to influence treatment outcomes (Pereira et al. Reference Pereira2013), which highlights the gap in the understanding of the effect of geometry on haemodynamics before and after treatment.
Finally, other important parameters in post-treatment haemodynamics are the stent porosity and permeability. Numerous experimental studies have investigated different stent designs (Dorn et al. Reference Dorn, Niedermeyer, Balasso, Liepsch and Liebig2011), showing that porosity (Liou & Liou Reference Liou and Liou2004; Liou, Li & Wang Reference Liou, Li and Wang2008; Rayepalli et al. Reference Rayepalli, Gupta, Lum, Majid and Koochesfahani2013), stent ‘patterns’ (Lieber et al. Reference Lieber, Livescu, Hopkins and Wakhloo2002; Liou, Liou & Chu Reference Liou, Liou and Chu2004; Moriwaki, Tajikawa & Nakayama Reference Moriwaki, Tajikawa and Nakayama2018) and deployment (Babiker et al. Reference Babiker, Gonzalez, Ryan, Albuquerque, Collins, Elvikis and Frakes2012; Roloff & Berg Reference Roloff and Berg2022) impact intra-aneurysmal haemodynamics. Yu et al. (Reference Yu, Matsumoto, Shida, Kim and Ohta2012) repeated PIV measurements for a steady inflow in an aneurysm attached to a straight parent vessel, with four porosity values. They observed that the velocity reduction was already very high ( $\approx$94 %) for a high porosity
  $\phi = 80\,\%$. However, FDS inhibition of flow in an aneurysm attached to a straight vessel is stronger than that in a curved vessel (Augsburger et al. Reference Augsburger, Farhat, Reymond, Fonck, Kulcsar, Stergiopulos and Rüfenacht2009; Barbour et al. Reference Barbour, Chassagne, Chivukula, Machicoane, Kim, Levitt and Aliseda2021). As previously mentioned, CFD can be an efficient tool to assess the effect of FDS treatment but requires a model for the treatment, either based on the simulation of the stent deployment in the parent vessel (Suzuki et al. Reference Suzuki, Takao, Fujimura, Dahmani, Ishibashi, Mamori, Fukushima, Yamamoto and Murayama2017) or using porous membrane models (Abdehkakha et al. Reference Abdehkakha, Hammond, Patel, Siddiqui, Dargush and Meng2021; Li et al. Reference Li, Song, Wang, Liu, Ji, Guo, Qiao, Liu and Wang2021).
Even though the literature on the haemodynamics of aneurysms treated with FDS is rich, it leaves significant open questions. We have conducted a parametric study to assess the combined effects of sac geometry and parent vessel curvature on the haemodynamics before and after treatment with FDS. Its goal is to quantify the effect of each parameter separately, as well as their coupling, on the haemodynamics in the sac before and after treatment with FDS. This study builds on two previous experimental studies focused on the haemodynamics in spherical aneurysms, with varying curvature of the parent vessel (Barbour et al. Reference Barbour, Chassagne, Chivukula, Machicoane, Kim, Levitt and Aliseda2021; Chassagne et al. Reference Chassagne, Barbour, Chivukula, Machicoane, Kim, Levitt and Aliseda2021). The present study investigates the effect of geometrical parameters (neck size, sac aspect ratio and parent vessel curvature) and haemodynamics parameters ( $Re$ and Womersley numbers). For this, time-resolved PIV measurements are performed in flow phantoms pre- and post-treatment with FDS.
2. Experimental methods
2.1. Flow model
Eight idealized aneurysm geometries were created (table 1). Consistent with a previous study (Barbour et al. Reference Barbour, Chassagne, Chivukula, Machicoane, Kim, Levitt and Aliseda2021; Chassagne et al. Reference Chassagne, Barbour, Chivukula, Machicoane, Kim, Levitt and Aliseda2021), the volume of the aneurysmal sac was kept constant. The sac aspect ratio, defined as  $AR={a}/{b}$, was 0.4–1.6 (
 $AR=1$ corresponding to the spherical geometry in the previous study) (figure 1). The neck size
  $D_{neck}$ was 3–5 mm, matching physiological neck sizes (Khorasanizadeh et al. Reference Khorasanizadeh2022), and resulting in an opening angle of the cavity
  $\alpha$ equal to 73.7
 $^{\circ }$ and 102.7
 $^{\circ }$, respectively. Curvature of the parent vessel was also investigated. Each aneurysmal sac geometry was attached to parent vessels with two different curvatures:
  $\kappa = {1}/{r_C} = 0.0625$ and
  $0.22$ mm
 $^{-1}$ (
 $r_C = 16$ or
  $4.5$ mm). The angle between the straight sections of the parent vessel upstream and downstream of the aneurysm was kept constant. These eight idealized geometries correspond to a full factorial experimental design with three parameters (Tinsson Reference Tinsson2010), similar to Nair et al. (Reference Nair, Chong, Indahlastari, Ryan, Workman, Haithem Babiker, Yadollahi Farsani, Baccin and Frakes2016), who used the same approach for basilar tip aneurysms.
Table 1. Nomenclature for the different geometries and their corresponding geometrical parameters: curvature of the parent vessel  $\kappa$, aspect ratio
  $AR$ and neck diameter
  $D_{neck}$.


Figure 1. (a) Illustration of the idealized aneurysm geometry and the different geometrical parameters. (b) Four idealized aneurysm geometries ( $\kappa = 0.22$ mm
 $^{-1}$) with different aspect ratios (
 $AR$) and neck sizes (
 $D_{neck}$).
The lumen geometries were three-dimensionally printed to create a transparent silicone model (Sylgard 184, Dow Corning Corp., Auburn, MI, USA) via a methodology previously described (Chivukula et al. Reference Chivukula2019). We used a mixture of water, glycerine and NaCl (weight ratio 47.5:35.8:16.7) as working fluid, with a viscosity of 3.8 cP, matching the viscosity of blood, and index of refraction matching that of the silicone, to prevent optical distortion.
After the first round of experimental measurements, the models were treated with FDS by an experienced neurosurgeon. These FDS ( $4\ {\rm mm}\times 20\ {\rm mm}$, Pipeline Embolization Devices, Medtronic) are tubular meshes, composed of braided platinum–tungsten and cobalt–chromium–nickel alloy wires (
 $\text {diameter} = 33\ \mathrm {\mu }{\rm m}$). The geometry of the FDS deployed in each model was imaged by synchrotron X-ray micro-tomography at ESRF, Grenoble, France, as previously described (Chivukula et al. Reference Chivukula2019).
2.2. Flow analysis
The models were studied with physiological unsteady waveforms in a flow loop with a pulsatile pump (Harvard Apparatus, Boston, MA, USA). The acceleration phase was set up to be shorter than the deceleration phase to match physiological waveforms (40 %/60 % of the period  $T$). Two frequencies
  $f$ were selected for the periodic inflow, 0.8 and 1.6 Hz (50 and 100 beats per minute), corresponding to Womersley numbers
  $Wo = ({D_{PV}}/{2})\sqrt {{2{\rm \pi} f}/{\nu }} = 2.5$ and 3.2, respectively.
For each frequency, measurements were repeated for four different time-averaged flow rates  $\bar {Q}_{PV} = 100 \unicode{x2013}400$ ml min
 $^{-1}$. These flow rates correspond to parent vessel Reynolds numbers
  $\overline {Re}_{PV}= 138$, 276, 414, 552, covering the full range of
  $Re$ in the human internal carotid artery (Ford et al. Reference Ford, Alperin, Lee, Holdsworth and Steinman2005). These experimental conditions result in Dean numbers
  $De=\overline {Re}_{PV} \sqrt {\kappa ({D}/{2})}$ from 50.9 to 384.0.
Two-dimensional, three-component velocity fields in the aneurysmal sac were obtained via stereoscopic PIV measurements in the plane of symmetry of the models, which were immersed in a tank filled with the working fluid. A full description of the optical set-up can be found in Chassagne et al. (Reference Chassagne, Barbour, Chivukula, Machicoane, Kim, Levitt and Aliseda2021). This approach provided 7653 image pairs for each experimental condition ( $n=128$), achieving fully converged phase-averaged statistics.
2.3. Analysis of the velocity fields
The two-dimensional, three-component velocity fields  $\boldsymbol {u} (x,y)$ obtained via stereo PIV measurements were eventually averaged onto one cycle. The Reynolds number in the aneurysmal sac,
  $Re_A$, was computed as the spatial average of the magnitude of the velocity fields
  $|\boldsymbol {u}|$. The circulation in the sac
  $\varGamma$ was computed as the spatial integral of the vorticity in the sac. The location of the centre of the vortex was estimated with the location of the minimum velocity magnitude in the cavity (Chassagne et al. Reference Chassagne, Barbour, Chivukula, Machicoane, Kim, Levitt and Aliseda2021).
The neck was defined as the curved line that completed the outline of the missing parent vessel in the images. The velocity at the neck,  $\bar {u}_N$, was computed as follows:
 \begin{equation} \bar{u}_N=\frac{1}{2 L_{neck}} \int_{0}^{L_{neck}} | \boldsymbol{u}\boldsymbol{\cdot}\boldsymbol{n}| \,{\rm d}l, \end{equation}
where  $L_{neck}$ is the neck line length. From this, the neck
  $Re$ can be computed as follows:
  $Re_{N} = {\bar {u}_N D_{neck}}/{\nu }$. If the velocity in some parts of the aneurysm was not captured properly by the measurement, because it was much lower than that of the main flow patterns, it was conservatively zeroed in the analysis.
2.4. Analysis of the effect of the different parameters on the haemodynamics
A statistical approach was used to assess the influence of the different parameters on the haemodynamics before and after treatment with FDS. The goal of this approach, whose detailed description and implementation can be found in previous publications (Tinsson Reference Tinsson2010; Frauziols et al. Reference Frauziols, Chassagne, Badel, Navarro, Molimard, Curt and Avril2016), is to quantify the fraction of the total observed changes that is induced by the variation of each isolated parameter, as well as their possible coupling. Based on previous work on intra-aneurysmal flow in spherical geometries with fixed neck areas (Barbour et al. Reference Barbour, Chassagne, Chivukula, Machicoane, Kim, Levitt and Aliseda2021; Chassagne et al. Reference Chassagne, Barbour, Chivukula, Machicoane, Kim, Levitt and Aliseda2021), which demonstrated the small influence of the Womersley number compared with the Dean number, it was decided to focus on three parameters and their interactions:  $De$,
$De$,  $D_{neck}$,
  $AR$,
$AR$,  $De*D_{neck}$,
  $De*AR$ and
  $D_{neck}*AR$.
These three parameters were first scaled between  $-1$ and
  $1$. Then, a response function
  $Y$ was fitted to the values of the average intra-aneurysmal velocity
  $\langle \bar {u}\rangle$ before and after treatment separately:
 \begin{align} Y &= \beta_0 + \beta_1 * De + \beta_2 * D_{neck} + \beta_3 * AR + \beta_4 * De*D_{neck}\nonumber\\ &\quad + \beta_5 * De * AR + \beta_6 * D_{neck}*AR. \end{align}
 An analysis of variance approach was then used to evaluate how well the response function fits the experimental data (i.e.  $R^2 = 0.XX$ means that
  $XX\,\%$ of the experimental variance is replicated with this response function). Finally, the effect of each parameter
  $\beta _{1},\dots, \beta_{6}$ was normalized by the range of variation of the experimental data, quantifying the fraction of the total change induced by a variation of each parameter (i.e. the ‘influence’ of each parameter).
3. Results
3.1. Flow without FDS
3.1.1. Flow topology
Figure 2 shows examples of the velocity field  $\boldsymbol {u}$ in the aneurysmal sac for a subset of conditions at four time points of the cycle (
 $\overline {Re}_{PV} = 414$,
  $Q_{PV}=300$ ml min
 $^{-1}$). A single counter-rotating vortex exists for the entire cycle, consistent with previous studies (Aenis et al. Reference Aenis, Stancampiano, Wakhloo and Lieber1997; Meng et al. Reference Meng, Wang, Kim, Ecker and Hopkins2006; Liou et al. Reference Liou, Li and Wang2008; Rayepalli et al. Reference Rayepalli, Gupta, Lum, Majid and Koochesfahani2013; Shojima Reference Shojima2017; Moriwaki et al. Reference Moriwaki, Tajikawa and Nakayama2020; Chassagne et al. Reference Chassagne, Barbour, Chivukula, Machicoane, Kim, Levitt and Aliseda2021; Nagargoje et al. Reference Nagargoje, Valeti, Manjunath, Akhade, Sudhir, Patnaik and Kannath2022). This counter-rotating vortex is the result of the separation of the flow at the proximal edge. The flow enters the sac at the distal edge, then rotates inside the aneurysm before exiting the sac at the proximal edge, reattaching to the flow in the parent vessel. During the acceleration phase (yellow to red in figure 2), the velocity magnitude in the sac increases and the vortex moves deeper into the aneurysmal sac, closer to the distal aneurysm wall. Then, when the flow in the parent vessel decelerates (red to green and green to blue in figure 2), the intra-aneurysmal velocity decreases and the vortex moves towards the neck. The motion of the vortex over the cycle is consistent with previous numerical work on a straight vessel (Asgharzadeh & Borazjani Reference Asgharzadeh and Borazjani2016) and in patient-specific geometries (Le, Borazjani & Sotiropoulos Reference Le, Borazjani and Sotiropoulos2010), as well as with work on idealized geometries (Usmani & Muralidhar Reference Usmani and Muralidhar2018; Tupin, Saqr & Ohta Reference Tupin, Saqr and Ohta2020). However, Asgharzadeh & Borazjani (Reference Asgharzadeh and Borazjani2016) found the vortex located closer to the neck. This can be explained, first, by the fact that the aneurysm was on a straight vessel. Second, the aneurysm geometry had a much wider neck (a half dome), especially for their large aspect ratio. They also demonstrated that increasing
  $\overline {Re}_{PV}$ results in faster motion of the vortex, which is consistent with our observations, illustrated in figure 3.

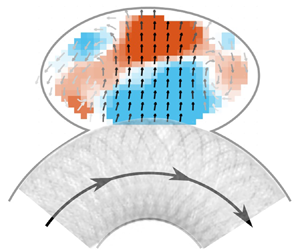
Figure 2. Velocity fields  $\boldsymbol {u}$ for four geometries for
  $\overline {Re}_{PV} = 414$ at four time points of the cardiac cycle: A (yellow), the flow in the parent vessel accelerates; B (red), the flow rate in the parent vessel is maximum; C (green), the flow in the parent vessel decelerates; D (blue), the flow rate in the parent vessel is minimum. The background colour represents the out-of-plane velocity and the colour of the arrows represents the magnitude of the in-plane velocity.

Figure 3. Location of the centre of the vortex for 20 time points of the cycle and for (a–c) three different aneurysm geometries, for  $\overline {Re}_{PV} = 414$ (i.e.
  $Q_{PV}=300$ ml min
 $^{-1}$).
The same flow topology, i.e. a counter-rotating vortex, was observed for all geometries as shown in figure 2, except for K $+$/AR
 $+$/N
$+$/N $+$ (fourth row). This geometry has a high curvature, resulting in high
  $De$ (287 for
  $\overline {Re}_{PV}=414$) and a large neck diameter. With this configuration, the velocity increase in the sac resulting from the acceleration of the flow in the parent vessel is large, which pushes the vortex deeper into the cavity (in red in figure 2). Because of the high aspect ratio of the cavity, the vortex is very close to the wall, eventually resulting in its breakdown (in red in figure 2 and in supplementary movie 1 available at https://doi.org/10.1017/jfm.2023.763). The vortex forms again when the flow in the parent vessel decelerates (in blue in figure 2).
It is also important to note that, unlike in spherical aneurysms, the curvature of the aneurysmal sac varies locally leading to more complex out-of-plane flow patterns. The low aspect ratio (first two rows in figure 2) exhibit helicoidal flow patterns for all neck sizes and curvatures. This helicoidal flow becomes stronger as the flow in the parent vessel accelerates and rotates/translates deeper in the cavity. However, for another extreme geometry, K $-$/AR
 $-$/N
$-$/N $-$, with a small neck and low aspect ratio, the vortex does not develop in the entire aneurysmal sac (first row in figure 2). Due to the high heterogeneity in velocities, the very low velocities in the deepest part of the aneurysmal sac are not captured well in the experiments. As the cavity is elongated, the primary vortex cannot fill the whole cavity, leading to the formation of a second, less strong, vortex at the cavity fundus. This observation is consistent with previous experiments in rectangular cavities (
 $AR = 0.5$) (Shen & Floryan Reference Shen and Floryan1985) and numerical simulations (
 $AR = 0.4$) for a similar
  $Re$ (Guo et al. Reference Guo, Gong and Zhang2020). Both studies observed the formation of a second, deeper, vortex whose velocity was one to two orders of magnitude lower than that of the main vortex, explaining why it cannot be fully captured by PIV measurements. Moriwaki et al. (Reference Moriwaki, Tajikawa and Nakayama2020) performed PIV measurements with steady inflow, in sac geometries similar to ours, but attached to straight vessels. For low aspect ratios, they also observed a large area of very low velocity at the tip of the aneurysmal sac.
For the seven geometries for which a counter-rotating vortex is observed throughout the cycle, we note that the motion of this vortex is strongly influenced by the geometry of the cavity. As observed in figure 3, the trajectory of the centre of the vortex when the flow accelerates in the parent vessel is very similar to the local curvature of the cavity in the vicinity of the vortex centre. If the centre of the vortex is located low in the sac, as for K $-$/AR
 $+$/N
$+$/N $-$ (figure 3b), it follows a very curved trajectory during acceleration, while when it is higher in the sac (figure 3a or 3c), its trajectory is very flat, matching the curvature of the wall in this area. This trend was also observed for spherical shapes (Chassagne et al. Reference Chassagne, Barbour, Chivukula, Machicoane, Kim, Levitt and Aliseda2021), suggesting the importance of the sac geometry in vortex motion during the cardiac cycle. Moreover, it seems that the wall curvature heterogeneity results in less stable vortices, as their trajectory lengths increase compared with spherical shapes.
3.2. Inertial effects (Dean and Reynolds numbers)
The velocity profile at the neck (in red on the aneurysm schematics in figure 4) is plotted in figure 4(a,b) for different times of the cycle corresponding to the acceleration phase of the flow in the parent vessel. The velocity profiles presented here only consider the centre plane velocity components. At minimum parent vessel flow (i.e. the start of the cardiac cycle; very light grey in figure 4), the flows exiting and entering the cavity are well balanced and centred around the middle of the neck line. When the flow in the parent vessel accelerates (from light to dark lines), the velocity profile at the neck is shifted and the amount of flow exiting the sac increases. This shift is consistent with the motion of the vortex during acceleration, as observed in figure 2 (first row). The vortex is centred when the velocity is low and pushed towards the wall as the flow enters the sac at the distal edge. This observation differs from that of a numerical study performed on three patients’ aneurysm geometries (Mantha et al. Reference Mantha, Benndorf, Hernandez and Metcalfe2009), which observed little change in the structure of the flow at the neck throughout the cycle. This might be explained by the fact that for the three geometries, the aneurysm was located on a rather flat part of the parent vessel, whereas in the present study the curvature of the vessel plays a major role.

Figure 4. Velocity profile at the neck for K $-$/AR
 $+$/N
$+$/N $-$ (a) and K
 $-$/AR
 $-$/N
$-$/N $-$ (b) during the acceleration phase (start of the cardiac cycle to peak systole) in the parent vessel (line becoming darker as the velocity in the parent vessel increases) for
  $\overline {Re}_{PV} = 414$ (i.e.
  $Q_{PV}=300$ ml min
 $^{-1}$) and
  $Wo = 2.5$. Time-averaged
  $Re$ at the neck (
 $Re_N$) as a function of
  $Re$ in the parent vessel (
 $Re_{PV}$) for aneurysmal sac geometries with large (c) and small (d) aspect ratio.
The variation of the velocity at the neck  $\bar {u}_N$ is illustrated by the Reynolds number at neck line
  $Re_N$ (figure 4c,d). Independently of the geometry,
  $Re_{N}$ is linearly dependent on the parent vessel velocity (
 $Re_{PV}$). For the lowest sac aspect ratio (figure 4d), an increase in neck size and/or in parent vessel curvature results in an increase in neck velocity. The increase in neck velocity induced by curvature is the result of the parent vessel velocity profile shifting towards the sac (Chassagne et al. Reference Chassagne, Barbour, Chivukula, Machicoane, Kim, Levitt and Aliseda2021). The same trend is observed for the small neck size and the large aspect ratio (AR
 $+$/N
$+$/N $-$). However, for the high aspect ratio (figure 4c) and the large neck size (AR
 $+$/N
$+$/N $+$), increasing the curvature does not lead to an increase in velocity at the neck. This is a consequence of the breakdown of the vortex during the cycle, as discussed in the previous section.
Figure 5(a,b) presents the time-averaged circulation,  $\langle \varGamma \rangle$, in the sac for the high and low aspect ratios. Independently of
  $AR$, the circulation was found to be strongly correlated with
  $Re_{PV}$. In addition to the curvature (blue to red in figure 5), the neck size was found to impact the circulation in the sac (open to filled patterns in figure 5). Indeed, reducing the neck size adds resistance and results in lower neck inflow. Independently of the geometry,
  $Re_A$ for the 5 mm neck was found to be linearly dependent on
  $Re_A$ for a neck of 3 mm (figure 5c). In their experimental study with steady inflow in the parent vessel, Moriwaki et al. (Reference Moriwaki, Tajikawa and Nakayama2020) also observed an increase in the velocity in the sac as the neck size increased.

Figure 5. Time-averaged circulation in the sac,  $\langle \varGamma \rangle$, as a function of
  $Re_{PV}$ for all curvatures and neck sizes for high (a) and low (b)
  $AR$. (c) Reynolds number in the aneurysm
  $Re_A$ for the large neck size (
 $D_{neck}=5$ mm) as a function of
  $Re_A$ for the small neck size (
 $D_{neck}=3$ mm), for two frequencies of the flow in the parent vessel: 50 beats per minute in solid line and 100 beats per minute in dashed line (
 $Wo = 2.5$ and
  $Wo = 3.2$).
For the low aspect ratio, increasing the curvature of the parent vessel tends to slightly increase the sensitivity to the size of the neck (triangles in figure 5c). However, for the high aspect ratio, the geometries with the low curvature resulted in the highest sensitivity to the neck size (blue disks in figure 5c), when geometries with the high curvature showed no increase in  $Re_A$ (red disks in figure 5c). For this case, the circulation in the cavity-filling vortex seems to saturate and not to accept any more angular momentum. This result suggests the existence of a maximum momentum injection for each geometry, as increasing the neck size fails to increase the intra-aneurysmal circulation (for this specific geometry). It is also important to note that the frequency (i.e. the Womersley number) does not significantly impact
  $Re_A$, as illustrated in figure 5(c): the solid and dashed lines correspond to
  $Wo = 2.5$ and
  $3.2$, respectively.
Figure 6(a) presents the variation of the time-averaged circulation,  $\langle \varGamma \rangle$, in the sac as a function of the Dean number for the low aspect ratio. This quantity can be used here as a rough surrogate for the residence time of platelets in the sac: with a high circulation, the platelets are more likely to exit the aneurysm faster. For all geometries (except the extreme case K
 $+$/AR
 $+$/N
$+$/N $+$), the circulation is well correlated with the Dean number, which confirms our previous findings (Chassagne et al. Reference Chassagne, Barbour, Chivukula, Machicoane, Kim, Levitt and Aliseda2021). Indeed, the curvature of the parent vessel is responsible for the asymmetry of the flow in the parent vessel, whose maximum shifts towards the aneurysmal sac as the curvature increases.

Figure 6. (a) Time-averaged circulation in the sac  $\langle \varGamma \rangle$ normalized by the kinematic viscosity
  $\nu$ as a function of
  $De$ for the lowest value of the sac
  $AR$ and two different neck sizes (combining all curvature conditions). (b) Time-averaged circulation in the sac
  $\langle \varGamma \rangle$ normalized by the kinematic viscosity
  $\nu$ as a function of
  $De$ for
  $D_{neck} = 5$ mm and three aspect ratios (
 $AR=1$ corresponding to a spherical shape).
A comparison of the different aspect ratios for the same neck size ( $D_{neck} = 5$ mm), including the circulation values for
  $AR=1$ (i.e. the spherical sac), is presented in figure 6(b). It shows that, when the vortex exists throughout the cycle, increasing the aspect ratio increases the circulation within the sac. The difference in circulation between the different sac
  $AR$ is a consequence of a change in the curvature of the edge of the sac (change in
  $AR$), a change in the angle at the proximal edge
  $\beta$ and a change in the way the geometry confines the vortex (or prevent its expansion). The angle
  $\beta$ varies from
  $31.3^{\circ }$ to
  $62.8^{\circ }$ and
  $79.1^{\circ }$ for aspect ratios of
  $1.6$,
  $1$ and
  $0.4$, respectively. For the same curvature of the surface, Song et al. (Reference Song, Tagawa, Chen and Zhang2019) observed a stronger vortex by increasing the angle between the inflow and the curved surface, for angles which were lower than in the present study (
 $\beta = 20^{\circ }\unicode{x2013}40^{\circ }$). Here, the largest angle corresponds to the smaller aspect ratio, which results in the lowest circulation. This geometry also has the lowest curvature of the aneurysm wall, especially in the vicinity of the distal edge, which could explain the low circulation. Another factor could be that this narrow aneurysm geometry (i.e. small cross-section) prevents the expansion of the vortex, leading to stronger out-of-plane velocities (not considered in the computation of the circulation). For the large aspect ratio, resulting in the highest circulation, the angle
  $\beta$ is much lower and is combined with a high curvature of the surface at the distal edge as well as a very large cross-section, allowing for the expansion of the vortex. Similar trends were observed in an experimental study (Epshtein & Korin Reference Epshtein and Korin2018), where the time of clearance, for a pulsatile inflow, was higher for a higher-
 $AR$ aneurysm. Similarly, Moriwaki et al. (Reference Moriwaki, Tajikawa and Nakayama2020) and Asgharzadeh & Borazjani (Reference Asgharzadeh and Borazjani2019) observed lower velocities for low aspect ratios. However, the volume of the sac was not constant throughout their experiments, making the comparison between the different aspect ratios inconclusive.
4. Flow after treatment with FDS
4.1. Flow topology
Stereo PIV measurements were repeated after the aneurysm models were treated with FDS, for the same flow conditions. First, implanting a FDS, i.e. a metal strut mesh with a cylindrical shape to match the parent artery that extends across the aneurysmal neck, results in a strong decrease in intra-aneurysmal velocity (about one order of magnitude) (figure 7). This strong decrease in velocity is in agreement with numerous previous studies (Cantón et al. Reference Cantón, Levy, Lasheras and Nelson2005; Bouillot et al. Reference Bouillot, Brina, Ouared, Lovblad, Farhat and Pereira2015; Clauser et al. Reference Clauser, Knieps, Büsen, Ding, Schmitz-Rode, Steinseifer, Arens and Cattaneo2018; Moriwaki et al. Reference Moriwaki, Tajikawa and Nakayama2020). The FDS also induced a strong modification of the intra-aneurysmal flow patterns, dependent on geometry. For all low- $AR$ aneurysms (K
 $-$/AR
 $-$/N
$-$/N $-$, K
 $+$/AR
 $-$/N
$-$/N $-$, K
 $-$/AR
 $-$/N
$-$/N $+$ and K
 $+$/AR
 $-$/N
$-$/N $+$), the flow topology at low and intermediate
  $Re_{PV}$ was identical (an example is presented in figure 7, top). When the velocity in the parent vessel is minimum, the flow in the aneurysmal sac is attached to the parent vessel (in blue in figure 7, top). It enters the sac at the proximal edge, expands in the aneurysm and exits at the distal edge. However, the vortex formed does not fully fill the cavity. As already observed for untreated flow, the velocities in the deep parts of the cavity are very low and were not properly captured by the stereo PIV measurements. When the flow in the vessel accelerates, separation starts to occur (in yellow in figure 7, top). The entrance of the flow in the sac is relocated to the centre of the neck and flow is towards the fundus of the cavity. When the flow in the sac is maximum (in red in figure 7, top), the flow is fully separated from the vessel wall: the flow enters the sac at the distal edge, expands in the sac and then reattaches to the flow in the parent vessel at the proximal edge. However, the flow topology is different from that before treatment: the vortex is not fully formed and stable, as it only exists for a short part of the cycle. Indeed, when the flow decelerates (in green in figure 7, top), the circulation in the sac is reversed again and the flow in the sac reattaches to the parent vessel. This cyclic change in the sense of circulation was observed for spherical aneurysms too, but only for low curvatures and
  $Re_{PV}$ (Barbour et al. Reference Barbour, Chassagne, Chivukula, Machicoane, Kim, Levitt and Aliseda2021), or for micro-spherical cavities (Shen et al. Reference Shen, Ai, Zhao, Yan and Liu2022). It is believed that this flow topology after treatment is more likely to lead to intracranial embolization, as it results in very low velocities twice per cycle (when the circulation changes sign). However, for the largest curvature of the parent vessel (K
 $+$/AR
 $-$/N
$-$/N $-$ and K
 $+$/AR
 $-$/N
$-$/N $+$) and high values of
  $Re_{PV}$, this inversion of circulation is not observed, as was the case for spherical aneurysms (Barbour et al. Reference Barbour, Chassagne, Chivukula, Machicoane, Kim, Levitt and Aliseda2021).

Figure 7. Velocity fields  $\boldsymbol {u}$ after treatment with FDS for four geometries and for
  $\overline {Re}_{PV} = 414$ at four time points of the cycle: A (yellow), the flow in the parent vessel accelerates; B (red), the flow rate in the parent vessel is maximum; C (green), the flow in the parent vessel decelerates; D (blue), the flow rate in the parent vessel is minimum. The background colour represents the out-of-plane velocity and the grey scale of the arrows represents the magnitude of the in-plane velocity.
For the high aspect ratio, the flow topology varies with parent vessel curvature,  $\kappa$, as well as with neck size,
  $D_{neck}$. For low curvature (K
 $-$/AR
 $+$/N
$+$/N $-$ and K
 $-$/AR
 $+$/N
$+$/N $+$), independently of the neck size, the flow in the sac remains attached, as shown in figure 7 (second row). The flow enters the sac at the proximal edge, expands in the sac and exits at the distal edge. The velocity magnitude increases with parent vessel flow, but never reaches high enough inertia for flow separation. For high parent vessel curvature, the flow topology is influenced by the size of the neck, as before treatment. For the smaller neck size (figure 7, third row), the treatment with FDS did not result in a change in flow topology. Throughout the cycle, a counter-rotating vortex exists, moving deeper in the cavity as parent vessel flow increases. When flow decelerates, the vortex loses strength and moves towards the neck. This flow topology, presented here for
  $\overline {Re}_{PV} = 414$ and observed for all values of
  $\overline {Re}_{PV}$ in this geometry (K
 $+$/AR
 $+$/N
$+$/N $-$), was also observed for spherical aneurysms at high
  $De$ (Barbour et al. Reference Barbour, Chassagne, Chivukula, Machicoane, Kim, Levitt and Aliseda2021). For this geometry and those with low curvature, circulation does not reverse during the cycle. Finally, for the case with the high curvature and large neck (K
 $+$/AR
 $+$/N
$+$/N $-$) (figure 7, bottom), the flow enters the cavity at the centre of the neck aiming towards the fundus and recirculates on both distal and proximal walls. The velocity in the sac increases when the flow in the parent vessel accelerates. During deceleration, two clear recirculation areas can be observed above the proximal and distal edges, breaking down at the end of deceleration.
Unlike before treatment, the flow topology greatly varies between the different geometrical and haemodynamic configurations. These observations differ from those of Moriwaki et al. (Reference Moriwaki, Tajikawa and Nakayama2020), where for all geometries the flow remained attached after treatment with FDS. This difference can be due to the fact that they performed the experiments with steady inflow and that the aneurysms were on straight vessels. Another experimental study (Bouillot et al. Reference Bouillot, Brina, Ouared, Lovblad, Farhat and Pereira2015), with pulsatile inflow but also straight vessels, observed a change in circulation only for the lowest porosity stent ( $\phi \approx 70\,\%$). On the other hand, Cantón et al. (Reference Cantón, Levy, Lasheras and Nelson2005) characterized the intra-aneurysmal velocities after the deployment of one to up to three high-porosity (non-FDS) stents. Even with three stents, where the reduction of velocity was dramatic, flow separation always occurred. For this patient-specific case, the aneurysm was located on a parent vessel with high curvature, which confirms our observations.
4.2. Inertial and unsteady effects
The flow patterns can be categorized into four topologies (figure 8, top): (1) no separation between the flow in the sac and the flow in the parent vessel; (2) two opposing vortices (inflow located at the centre of the neck); (3) separation of the flow in the sac for part of the cycle (inversion of circulation during the cycle); and (4) counter-rotating vortex. Velocity profiles at the neck of a representative example of each flow topology are presented in figure 8.

Figure 8. Velocity profile at the neck for K $-$/AR
 $+$/N
$+$/N $+$ (a), K
 $-$/AR
 $-$/N
$-$/N $+$ (b), K
 $+$/AR
 $+$/N
$+$/N $+$ (c) and K
 $+$/AR
 $+$/N
$+$/N $-$ (d) during the acceleration phase of the flow in the parent vessel (line becoming darker as the velocity in the parent vessel increases) for
  $\overline {Re}_{PV} = 414$ (i.e.
  $Q_{PV}=300$ ml min
 $^{-1}$).
In the case of no separation, the flow enters and exits the sac at the proximal and distal edges, respectively. As the velocity in the parent vessel accelerates (going from light grey to dark grey in figure 8a), the velocity at the neck increases and the peak of the velocity profile shifts towards the centre of the neck. However, despite high inflow velocities, separation never occurs for theses geometries. As described in Sobey (Reference Sobey1980), two pressure gradients influence the flow at the proximal edge: the first is due to the expansion at the cavity, leading to the deceleration of the flow, and the second, opposed to the first, is caused by acceleration along the cardiac cycle. The expansion-based gradient, which depends on  $Q^2(t)$, is positive for an expanding section, whereas the unsteady gradient, which depends on
  $\dot {Q}(t)$, is negative when parent vessel flow accelerates. Thus, separation will occur when the magnitude of the pressure gradient induced by the acceleration of the flow becomes lower than the magnitude of the expansion-based pressure gradient. The magnitude of the gradient resulting for the flow in the parent vessel increases for the first part of the acceleration phase and then decreases. However, as it decreases in the second part of the acceleration phase (i.e. systole), the flow keeps increasing and the expansion-based gradient keeps increasing until becoming dominant, resulting in separation of the flow. In these geometries with low parent vessel curvature and high aspect ratio (K
 $-$/AR
 $+$/N
$+$/N $-$ and K
 $-$/AR
 $+$/N
$+$/N $+$), the magnitude of the adverse pressure gradient never becomes large enough to result in separation. However, for the same curvature of the parent vessel but a lower aspect ratio (K
 $-$/AR
 $-$/N
$-$/N $+$), flow separation is observed for part of the cycle suggesting the impact of the sac geometry on the expansion-based pressure gradient. Figure 8(b) shows the velocity profiles at the neck as the velocity in the sac increases for this aneurysm geometry. At first, the flow in the sac is attached, and velocities are low. As velocity increases, the inflow at the proximal edge decreases until becoming negative when flow separates. After separation, the inflow velocity, located at the distal edge, increases, as does the outflow velocity at the proximal edge. This difference of flow patterns for two models with the same curvature and neck size demonstrates the importance of the sac geometry.
As the parent vessel curvature increases, the velocities at the neck become higher (figure 8c,d). Increased curvature tends to shift the velocity profile in the parent vessel towards the entrance of the sac, increasing the inflow in the aneurysmal sac. Figure 8(d) represents the velocity profiles in a case of a counter-rotating vortex maintained throughout the cycle (similar to the pre-treatment flow pattern). As the velocity in the parent vessel accelerates, the velocity at the neck increases but does not shift. Finally, for the extreme geometry with the high curvature, large aspect ratio and neck (K $+$/AR
 $+$/N
$+$/N $+$), the flow enters the sac at the centre of the neck, as shown in figure 8(c). This flow topology is very different from the others, as was before treatment. A study by Ouared et al. (Reference Ouared, Larrabide, Brina, Bouillot, Erceg, Yilmaz, Lovblad and Mendes Pereira2016) on 12 patients (9 fully occluded) suggested that the shift of the inflow zone from proximal to the middle of the neck facilitates aneurysm occlusion. Chong et al. (Reference Chong, Zhang, Qian, Lai, Parker and Mitchell2014) obtained similar conclusions from CFD simulations of four occluded and four non-completely occluded aneurysms and were able to define flow patterns more favourable for occlusion: reduction of inflow speed and central diversion of the inflow. These results suggest that the flow topology observed for K
 $+$/AR
 $+$/N
$+$/N $+$, where the inflow is coming through the centre of the neck, is highly favourable for aneurysm occlusion. Another study concluded that higher flow rates in the sac and larger inflow areas seem to delay the occlusion of the aneurysm (Su et al. Reference Su, Reymond, Brina, Bouillot, Machi, Delattre, Jin, Lövblad and Vargas2020). Similarly, using CFD in patient-specific geometries, Mut et al. (Reference Mut, Raschi, Scrivano, Bleise, Chudyk, Ceratto, Lylyk and Cebral2015) observed that the ‘fast occlusion’ group had lower post-treatment mean velocities and inflow rates than the ‘slow occlusion’ group. These observations support the fact that a counter-rotating vortex after treatment with FDS is detrimental for the complete occlusion of the sac.
The analysis of the inflow at the neck highlighted the impact of geometrical parameters, mostly the sac aspect ratio and the parent vessel curvature, on flow topology in the sac. However, as previously described by Barbour et al. (Reference Barbour, Chassagne, Chivukula, Machicoane, Kim, Levitt and Aliseda2021), this topology is also influenced by inertial ( $Re$ and
  $De$) and unsteady (
 $Wo$) effects. Figure 9(a) shows the circulation in the sac throughout the cycle, for a geometry in which flow separates at some point of the cardiac cycle (K
 $-$/AR
 $-$/N
$-$/N $+$). The circulation was normalized by its amplitude over the cycle and plotted for different
  $Re$ and
  $Wo$. As
  $Re_{PV}$ increases (from light pink to dark pink in figure 9a) while keeping the sac geometry constant, separation occurs earlier in the cycle, consistent with our previous results (Barbour et al. Reference Barbour, Chassagne, Chivukula, Machicoane, Kim, Levitt and Aliseda2021). This can be explained by the fact that the expansion-based pressure gradient is more sensitive to an increase in
  $Q(t)$ than the pressure gradient induced by the acceleration in the parent vessel, as they depend on
  $Q^2(t)$ and
  $\dot {Q}(t)$, respectively. A comparison of
  $\varGamma (t)$ for the same
  $Re$ and two values of
  $Wo$ suggests that the separation tends to occur slightly later in the cycle for the highest value of
  $Wo$. This observation confirms the work by Sobey (Reference Sobey1980), in which the separation time was found to increase with Strouhal number (the Womersley number in this study) while keeping
  $Re$ constant. It is also in agreement with our previous observations for spherical aneurysms (Barbour et al. Reference Barbour, Chassagne, Chivukula, Machicoane, Kim, Levitt and Aliseda2021).

Figure 9. (a) Normalized time-averaged circulation in the sac across the cardiac cycle period for K $-$/AR
 $-$/N
$-$/N $+$ and for three values of
  $\overline{Re}_{PV}$, as well as for
  $Wo = 2.5$ and
  $Wo = 3.2$. (b) Time-averaged circulation in the sac as a function of
  $De$. The marker shape corresponds to the sac
  $AR$, triangle for AR
 $-$ and circle for AR
  $+$, and the colour corresponds to the flow topology in the sac.
Figure 9(b) presents the time-averaged vorticity  $\langle \varGamma \rangle$ as a function of
  $De$ for all geometries. The flow topology (as defined in figure 8) is illustrated by colour. First, it is important to notice that, as before treatment, the circulation in the sac is linear with
  $De$, but varies with flow topology. For K
 $+$/AR
 $+$/N
$+$/N $+$ (figure 8, (2)), for which two opposing vortices are observed in the aneurysmal sac, the circulation remains very low, even for high
  $De$. For low values of
  $De$, circulation in the sac remains very low for all flow topologies except for the K
 $-$/AR
 $+$/N
$+$/N $+$ geometry (figure 8, (1)). For this geometry, even if the flow in the sac remains attached, the circulation strongly decreases with increasing
  $De$. Despite very high absolute value of the circulation, the flow never separates. This result shows once more that, in addition to the strong impact of parent vessel curvature, the sac aspect ratio affects the flow topology. Moreover, higher velocities entering the sac are not the only factor impacting flow separation in the sac.
The two other geometries exhibiting high value of circulation are K $+$/AR
 $+$/N
$+$/N $-$ and K
 $+$/AR
 $-$/N
$-$/N $+$ (figure 8, (3) and (4)). For these two geometries and at low
  $De$, the flow in the sac only separates for part of the cycle (figure 8, (3)), but when
  $De$ increases, the vortex is maintained throughout the cycle (figure 8, (4)) resulting in higher time-averaged circulation.
5. Comparison of haemodynamics before and after FDS treatment
5.1. Effect of the haemodynamic and geometric parameters
The analysis of the different haemodynamics metrics highlights the complex and interdependent role of the different geometrical and haemodynamic parameters. The study of haemodynamics metrics in spherical aneurysm (Barbour et al. Reference Barbour, Chassagne, Chivukula, Machicoane, Kim, Levitt and Aliseda2021; Chassagne et al. Reference Chassagne, Barbour, Chivukula, Machicoane, Kim, Levitt and Aliseda2021) demonstrated the relatively small influence of the Womersley number compared with the Dean number. Thus,  $Wo$ was not included in the following statistical analysis and only three parameters were considered: the Dean number
  $De$ (from 0 to 368), the size of the neck
  $D_{neck}$ (3 or 5 mm) and the sac aspect ratio
  $AR$ (0.4, 1.0 or 1.6). Focusing on the effect of these parameters and their interactions (
 $De*D_{neck}$,
  $De*AR$ and
  $D_{neck}*AR$), a model was fitted on the values of the time-averaged velocity magnitude
  $\langle \bar {u}\rangle$ in the aneurysm before and after treatment. Figure 10 presents the part of the variation of
  $\langle \bar {u} \rangle$ (before and after treatment) induced by the variation of each parameters of the model (within the range previously defined), i.e.
  $De$,
$De$,  $D_{neck}$,
  $AR$ and their interactions. About 3/4 of the total variance of
  $\langle \bar {u} \rangle$ can be explained by these six parameters, both before and after treatment (
 $R^2 = 0.72$ and
  $R^2 = 0.75$, respectively). For both conditions, 1/3 of the total variation of
  $\langle \bar {u}\rangle$ is a consequence of variation of
  $De$ alone. An increase in this parameter leads to an increase of flow in the sac, due to both the increased velocity in the vessel and the shift in velocity profile towards the neck induced by the curvature of the parent vessel. The Dean number was highlighted as the most impactful parameter in our previous studies (Barbour et al. Reference Barbour, Chassagne, Chivukula, Machicoane, Kim, Levitt and Aliseda2021; Chassagne et al. Reference Chassagne, Barbour, Chivukula, Machicoane, Kim, Levitt and Aliseda2021). A numerical study by Xu et al. (Reference Xu, Wu, Yu, Lv, Wang, Karmonik, Liu and Huang2015), performed on idealized spherical aneurysms with varying curvatures of the parent vessel, also demonstrated that before and after treatment, inflow velocity and flow rate in the sac increased with increasing curvature of the parent vessel. Based on CFD simulations of 47 patients treated with FDS, Chen et al. (Reference Chen, Zhang, Tian, Li, Zhang, Zhang, Liu and Yang2019) found a correlation between regions with inflow jets after treatment and regions that are not occluded post-treatment. These results tend to suggest that an increased
  $De$ would be detrimental for the occlusion of the aneurysmal sac after treatment with FDS.

Figure 10. Percentage of the variation of  $\langle \bar {u}\rangle$ induced by the three parameters
  $De$,
$De$,  $D_{neck}$ and
  $AR$ and their interactions before (in black) and after (in grey) treatment with FDS.
Before treatment, almost half of the variation can be traced to the geometry of the sac ( $D_{neck}$,
  $AR$ and
  $D_{neck}*AR$) and the interaction between inertial and geometrical parameters (
 $De*D_{neck}$,
  $De*AR$) was less influential. However, after treatment, the influence of purely geometrical parameters decreases and is compensated by an increase in the effects of
  $De*D_{neck}$ and
  $De*AR$. Overall, the analysis of variance for the velocity in the sac before and after treatment suggests that the influence of
  $De$ alone or coupled with geometrical parameters increases after treatment. However, it is important to note that this approach is built from
  $n=112$ measurements and did not consider the case K
 $+$/AR
 $+$/N
$+$/N $+$, as the flow topology is very different from the others. Indeed, this approach is based on the assumption of a linear relationship between the variation of a parameter and the variation of the value of interest (i.e. the time-averaged velocity magnitude), an assumption that would fail for K
 $+$/AR
 $+$/N
$+$/N $+$. Thus, the conclusions here are valid only if, before treatment, a single counter-rotating vortex is observed in the sac.
The second approach to characterize the effect of the treatment is to compare the haemodynamics before and after treatment. Chen et al. (Reference Chen, Zhang, Tian, Li, Zhang, Zhang, Liu and Yang2019) concluded that the reduction of velocity in the sac was the only factor affecting treatment outcome. Similarly, Paliwal et al. (Reference Paliwal, Damiano, Davies, Siddiqui and Meng2017) observed a slightly stronger reduction in velocity for successful treatments. Pereira et al. (Reference Pereira2013) used the MAFA ratio (i.e. the decrease in velocity with respect to the decrease in flow rate in the parent vessel) to predict the outcomes of the treatment with FDS for 21 patients. A numerical study has determined that a reduction in the inflow volume of 91.5 % leads to complete occlusion (Chong et al. Reference Chong, Zhang, Qian, Lai, Parker and Mitchell2014) while another study set the threshold at a reduction of 30 % for total occlusion (Ouared et al. Reference Ouared, Larrabide, Brina, Bouillot, Erceg, Yilmaz, Lovblad and Mendes Pereira2016). There is for now no consensus threshold, but it is accepted that a larger reduction is more likely to result in complete occlusion. Another metric to characterize the effect of the treatment with FDS on haemodynamics could be the time-averaged circulation in the sac,  $\langle \varGamma \rangle$. Figure 11(a) presents the magnitude of the circulation after treatment as a function of its magnitude before treatment: this metric can be used as an estimation of the stagnation of the platelets in the sac and, thus, as a rough estimate of the thrombogenic potential. The colour of the markers represents the flow topology after treatment, as previously described in figure 8, and the shape of the marker corresponds to the sac
  $AR$ (triangles for
  $AR=0.4$, stars for
  $AR=1$ and disks for
  $AR = 1.6$). Notice that, independent of the sac
  $AR$, the reduction in circulation is very high (
 $90\,\%$) when the circulation before treatment is low, which is in agreement with the fact that strong inflow could be detrimental to thrombus formation (Chen et al. Reference Chen, Zhang, Tian, Li, Zhang, Zhang, Liu and Yang2019; Su et al. Reference Su, Reymond, Brina, Bouillot, Machi, Delattre, Jin, Lövblad and Vargas2020).

Figure 11. (a) Ratio between the magnitude of the time-averaged circulation  $\langle |\varGamma |\rangle$ after and before FDS treatment, as a function of
  $De$, for the three aspect ratios. (b) Effect of the three parameters
  $De$,
$De$,  $D_{neck}$ and
  $AR$ and their interactions on the reduction of the magnitude of the time-averaged circulation (
 $R^2 = 0.55$).
Treatment with FDS is also very efficient at reducing circulation for the case K $+$/AR
 $+$/N
$+$/N $+$, for which no stable vortex was observed pre-treatment. Similarly, for high aspect ratio and low curvature of the parent vessel, the treatment strongly reduces circulation. For this geometry, the flow after treatment remains attached to the parent vessel throughout the entire cycle. Finally, the treatment effect is less strong if circulation is high pre-treatment and, after treatment, there is separation of the flow in the sac for part or the entire cycle. These cases mostly correspond to aneurysms for which the curvature of the parent vessel is high. Comparing different values of
  $AR$, it seems that treatment is successful at reducing circulation by 90 % for any curvature and neck size if
  $AR$ is low, but it is less efficient for higher
  $AR$.
$AR$.
The same analysis of variance approach, described earlier in this section, was implemented to assess the influence of each parameter and their interactions on the reduction of circulation in the sac induced by FDS treatment (figure 11a). However, a linear model with interactions is less adequate for the description of the variation of the reduction in circulation induced by the treatment ( $R^2 = 0.55$). All the parameters have a negative effect, which means that increasing any of these parameters leads to a lower reduction of the circulation (i.e. less effective treatment). This analysis highlights the detrimental effect of
  $De$, alone or combined with the neck size and aspect ratio. The two geometrical parameters (
 $D_{neck}$,
  $AR$ and
  $D_{neck}*AR$), alone (and even more so combined together), have a smaller influence on the effect of the treatment. Increasing the neck size and/or the aspect ratio results in a small decrease in the reduction of the circulation in the sac. More interestingly, the interaction between these geometrical parameters and
  $De$ has a stronger effect on treatment.
Shapiro et al. (Reference Shapiro, Becske and Nelson2017), for example, concluded that lower dome-to-neck ratios were associated with treatment failure. In the present study, the highest dome-to-neck ratio would correspond to a high  $AR$ and a small neck. For the high curvature of the parent vessel, this model shows the lowest reduction of the velocity and no change in the flow patterns compared with pre-treatment. Other studies (Cebral et al. Reference Cebral, Mut, Raschi, Hodis, Ding, Erickson, Kadirvel and Kallmes2014; Chung et al. Reference Chung, Mut, Kadirvel, Lingineni, Kallmes and Cebral2015) observed that aneurysms partially occluded after treatment had significantly larger necks than those fully occluded. However, Sarrami-Foroushani et al. (Reference Sarrami-Foroushani, Lassila, MacRaild, Asquith, Roes, Byrne and Frangi2021) observed no significant difference in velocity reduction in patients with large neck (>10 mm) or large
  $AR$ compared with small neck and
  $AR$. These observations are consistent with the results of our statistical analysis, where purely geometrical parameters do not seem to have a strong impact. Finally, as for other studies, we identified
  $De$, via an increase in the curvature of the parent vessel and
  $Re$, as the most influential parameter. For instance, Meng et al. (Reference Meng, Wang, Kim, Ecker and Hopkins2006) characterized stagnation in stented aneurysms with different parent vessel curvatures and observed lower stasis in aneurysms on higher-curvature parent vessels. Inflow in the sac was found to be larger for a parent vessel with increasing curvature (Liou et al. Reference Liou, Li and Wang2008; Augsburger et al. Reference Augsburger, Farhat, Reymond, Fonck, Kulcsar, Stergiopulos and Rüfenacht2009; Barbour et al. Reference Barbour, Chassagne, Chivukula, Machicoane, Kim, Levitt and Aliseda2021). Also, it is important to note that for our idealized aneurysms, the sac is always located on the outer convexity of the vessel. This location of the aneurysm with respect to the parent vessel has been identified as less favourable for successful embolization of the sac after FDS treatment (Sunohara et al. Reference Sunohara2021). A study comparing the clearance of aneurysmal sac on the outer convexity versus the concave side of the parent vessel also observed significantly faster clearance for the aneurysm on the outer convexity (Epshtein & Korin Reference Epshtein and Korin2018). As previously explained, in a curved vessel, the velocity profile is shifted towards the outer part of the vessel, i.e. towards the aneurysmal sac if located on the outer convexity. Thus, the flow is impinging on the stent with a larger angle (almost orthogonal to the stent surface), while for a straight vessel the flow is not directly impinging on the stent. These topologies are sometimes referred to as ‘shear-driven’ or ‘inertia-driven’ flow, respectively. In their study, Augsburger et al. (Reference Augsburger, Farhat, Reymond, Fonck, Kulcsar, Stergiopulos and Rüfenacht2009) observed that flow reduction was smaller for ‘inertia-driven’ flow. Indeed, a flow in the parent vessel directed towards the sac leads to stronger inflow into the sac, but also is less affected by the placement of the stent (as the pressure gradient is more orthogonal to the stent surface), which is why
  $De$ is such an influential parameter. This suggests that stent porosity should be lower for aneurysms exhibiting strong inflow in the sac before treatment (Lieber, Stancampiano & Wakhloo Reference Lieber, Stancampiano and Wakhloo1997). An approach to a solution could be to deploy more than one FDS in the vessel, which has been shown to result in higher occlusion rate (Waqas et al. Reference Waqas, Vakharia, Gong, Rai, Wack, Fayyaz, Snyder, Davies, Siddiqui and Levy2020).
5.2. Effect of FDS porosity
The predominant effect of the Dean number in the post-treatment haemodynamics can be explained by the fact that curvature of the parent vessel does not only impact the flow but also the FDS geometry. Flow-diverting stents are metal cylindrical meshes that are meant to be slightly larger (uncompressed) than the parent vessel, in order to apply a radial force on the artery to maintain the location of deployment. To quantify how FDS porosity was impacted by the geometry of the parent vessel and the aneurysmal sac, synchrotron X-ray micro-tomography (ESRF, Grenoble, France) of flow phantoms treated with FDS was performed to obtain high-resolution geometries of the deployed stents. Two examples of reconstruction of the stent geometry are shown in figure 12(a). Porosity of the FDS at the neck was then computed from these reconstructions. It was found to increase with parent vessel curvature:  $\bar {\varPhi }_{K-} = 0.65 \ [0.59\unicode{x2013}0.72]$ and
  $\bar {\varPhi }_{K+} = 0.70 \ [0.66 \unicode{x2013} 0.74]$, for low and high curvature of the parent vessel, respectively, which is consistent with previous characterizations (Makoyeva et al. Reference Makoyeva, Bing, Darsaut, Salazkin and Raymond2013). This increase of porosity is another reason why the Dean number plays such an important role in the haemodynamics after treatment. An increase in
  $De$ results in an increased inflow in the sac, but also in a reduction of the stent porosity, which reduces the effect of the treatment. However, curvature is not the only parameter influencing the stent porosity. As the stent unconstrained diameter is slightly larger than the artery diameter, it expands at the neck. Consequently, a larger neck area results in a larger stent expansion at the neck. This is illustrated in figure 12(b), which presents the distribution of the measured stent porosity at the neck for three different geometries: K
 $-$/AR
 $-$/N
$-$/N $+$, K
 $+$/AR
 $-$/N
$-$/N $+$ and K
 $+$/AR
 $-$/N
$-$/N $-$. However, the variation of porosity induced by the change of neck size is smaller than that induced by the change of curvature of the parent vessel. These results demonstrate that the stent porosity is influenced by the geometry of the aneurysm. However, the FDS porosity can also be influenced by the way the FDS is deployed in the vessel (Roloff & Berg Reference Roloff and Berg2022).

Figure 12. (a) Stent geometries for two aneurysm models reconstructed from synchrotron X-ray micro-tomography images. (b) Distribution of the porosity at the neck for three different models, highlighting the variation of porosity with neck size  $D_{neck}$ and curvature
  $\kappa$ of the parent vessel.
The fact that the treatment is not efficient enough at reducing the flow in the sac is a combination of two factors: first, before treatment the inflow in the sac was high (i.e. a strong inflow jet) and, second, that the stent porosity is not low enough to counter this strong inflow (which tends to impinge orthogonally on the stent). This is why the curvature of the parent vessel plays such an important role as it leads to both detrimental effects. Many previous experimental studies investigated the effect of the stent on haemodynamics for straight vessels, which is the more favourable case for flow reduction as there is no jet entering the cavity in this geometrical configuration. Bouillot et al. (Reference Bouillot, Brina, Ouared, Lovblad, Farhat and Pereira2014) observed, in an aneurysm attached to a straight vessel, that low porosities of around 70 % led to averaged velocities below 20 % of the pre-treatment velocities. They also observed that porosities higher than 90 % only reduced the velocity to 60 to 30 % of its pre-treatment value, which is likely insufficient for successful occlusion of the aneurysm. Another numerical study, of patient-specific geometries, has concluded that a porosity lower than 70 % was more favourable for thrombus formation (Zhang et al. Reference Zhang, Wang, Kao, Flórez-Valencia and Courbebaisse2019). A study of rabbits concluded that a metal coverage of 35 %, which corresponds to the highest value of metal coverage measured in the present study, was enough to induce full occlusion in 95 % of aneurysms (Wang et al. Reference Wang, Huang, Hong, Li, Fang and Liu2012). Similar flow reduction was observed by Yu et al. (Reference Yu, Matsumoto, Shida, Kim and Ohta2012) for PIV measurements in a straight parent vessel with steady inflow. They observed that the velocity reduction was already very high ( $\approx 94\,\%$) for high porosity (
 $\phi =80\,\%$), and that it reached 98 % for
  $\phi = 64\,\%$. Another numerical study (Ouared et al. Reference Ouared, Larrabide, Brina, Bouillot, Erceg, Yilmaz, Lovblad and Mendes Pereira2016) suggested that a mean porosity of 83 %, resulting in a reduction of intra-aneurysmal velocity by 70 %, was sufficient to achieve stable occlusion of the sac. More generally, a retrospective study of patient data concluded that higher metal coverage (i.e. lower porosity) was correlated with better treatment outcomes (Kole et al. Reference Kole, Miller, Cannarsa, Wessell, Jones, Le, Jindal, Aldrich, Simard and Gandhi2019). Even if the porosity measured in our study was on the low range, it was not always low enough to strongly reduce the inflow into the sac. Indeed, a porosity of around 70 % does not seem to be low enough to counter the inflow jet into the sac, for geometries where the inflow pre-treatment is already high. Finally, an experimental and numerical study of the flow in aneurysms on straight vessels (Bouillot et al. Reference Bouillot, Brina, Ouared, Yilmaz, Lovblad, Farhat and Mendes Pereira2016), treated with stents with different porosities, showed that the reduction of the velocity in the sac is not linear with stent porosity. Measurements performed in a similar geometry (Roszelle et al. Reference Roszelle, Babiker, Hafner, Gonzalez, Albuquerque and Frakes2013) compared the performance of a single FDS (
 $1 -\phi \approx 30\,\%$) with the combination of three very high-porosity stents (
 $1-\phi \approx 10\,\%$ for each stent). They observed that for low flow rates in the parent vessel, the FDS (low porosity) was as efficient as the combination of three very high-porosity stents at reducing velocities in the sac. However, it underperformed for high values of flow rates. These results demonstrate that porosity is not the only parameter that plays a role in the efficacy of the treatment, and that permeability of the mesh should also be characterized.
6. Conclusion
A parametric study was performed to investigate the combined effect of geometrical and haemodynamic parameters on the treatment with FDS of cerebral aneurysms. Velocimetry measurements were performed in eight idealized aneurysm geometries with varying neck sizes and sac aspect ratios, on parent vessels with varying curvatures, at intermediate Reynolds number ( $Re_{PV} = [138 \unicode{x2013} 552]$). These measurements were repeated after deployment of a FDS.
A counter-rotating vortex, whose strength varied over the cycle, was observed in the sac before treatment for all but one geometry. For this extreme geometry, with high curvature of the parent vessel, high  $AR$ and large neck, the vortex breaks down when the flow accelerates in the parent vessel (as it is being pushed toward the aneurysm wall) and forms again during the deceleration phase. An increase in neck size and aspect ratio resulted in an increase in velocity in the sac. Also, as previously described, the curvature of the parent vessel plays a major role. As it increases, the velocity profile in the vessel shifts towards the neck, resulting in higher inflow into the aneurysmal sac. Consequently, independently of the sac geometry, circulation in the sac was strongly correlated with
  $De$. However, the Womersley number has very little influence on the flow in the sac.
The study of the haemodynamics after FDS treatment revealed four different flow topologies: (1) no separation of the flow in the sac (no inversion of circulation); (2) two opposing vortices; (3) separation for part of the cycle (inversion of circulation); and (4) a counter-rotating vortex (similar to the pre-treatment topology). These flow topologies were dependent on both the geometry of the sac and the curvature of the parent vessel. Generally, a strong reduction of the flow in the sac was observed for the small aspect ratio, independently of the neck size or the curvature. A simple linear model with interactions allowed us to quantify the effect of each parameter separately as well as their interactions on the reduction of the circulation in the sac after stent deployment. This provided support for numerous observations, such as the fact that treatment was less successful for aneurysms located on the outer convexity of the vessel or for aneurysms with large necks. It also highlighted the major role of curvature, as it impacts both the haemodynamics in the sac through the Dean number and the stent porosity. Finally, these results suggest that pre-treatment haemodynamics could be sufficient to predict the treatment outcomes. Indeed, a single FDS is likely not enough to dramatically reduce the inflow from a strong jet entering the aneurysm (consequence of the curvature and the geometry of the sac) which resulted in a strong and stable counter-rotating vortex pre-treatment.
This work demonstrated the primary role of haemodynamics in FDS treatment, which should be complemented by the study of thrombus growth inside the aneurysmal sac and its effect on haemodynamics. A better understanding of the modification of haemodynamics induced by the deployment of FDS will allow for an increased success rate and may lead to the development of improved treatment modalities. Further studies will be needed to consider the complexity of patient-specific geometries, impacting both the haemodynamics and the FDS porosity.
Supplementary movie
Supplementary movie 1 is available at https://doi.org/10.1017/jfm.2023.763.
Funding
This work has been financially supported by the NIH/NINDS (grant 1R03NS078539, 1R01NS088072 and R01NS105692) and by the American Heart Association via a postdoctoral fellowship (19POST34450082). This work was supported by an unrestricted grant in the form of the pipeline devices to our academic institution from Medtronic Inc., which had no role in the experimental design, data analysis or scholarship of this work.
Declaration of interests
The authors report no conflict of interest.


