Introduction
Reconstruction of past climatic and environmental changes from ice cores is based on the assumption that the atmospheric signals are representatively transferred to and preserved in snow and ice. However, questions have been raised in recent years about post-depositional behaviors of some chemical species and physical properties. the literature demonstrates that HNO3 (Reference Mayewski and LegrandMayewski and Legrand, 1990), HF (Reference De Angelis and LegrandDe Angelis and Legrand, 1994), HCHO (Reference Staffelbach, Neftel, Stauffer and JacobStaffelbach and others, 1991), H2O2 (Reference Sigg, Staffelbach and NeftelSigg and others, 1992), HCl, HNO3 and some organic acids (HCOOH, CH3COOH, CH2OHCOOH band (COOH)2) (Reference De Angelis, Legrand and DelmasDe Angelis and Legrand, 1995) as well as δ18O (e.g. Reference KoernerKoerner, 1997; Reference Cuffey and Steig.Cuffey and Steig, 1998; Reference NyeNye, 1998; Hou and others, 1999) are all subject to post-depositional changes in the process of firnification.
Like the process of firnification, cracking of ice and subsequent infiltration by melt is an important mechanism for post-depositional changes. Such cracking is often encountered in ice cores recovered from glaciers in the Qinghai– Tibetan Plateau and Tien Shan areas. Researchers engaged in extracting past climatic information from ice cores expect that cracks opened to the meltwater will affect records of chemical species and physical properties. However, little work has been done, to our knowledge, on how and to what extent the cracking effect influences the ice-core records. Such information may be used to guide sampling in cracked sections so as to avoid artifacts due to the infiltrated ice.
In this work, we present data of δ18O, F–, Cl–, Br–, NO2 –, NO3 –, SO4 2–, PO4 3–, HCOO–, CH3COO–, C2O4 2–, CO(COO)2 2–, pH and electrical conductivity measurement (ECM) from an ice core collected at Ürümqi glacier No. 1 (UG1), western China. We demonstrate how the cracking effect changes the parameters, and how to obtain the primary environmental and climatic information from a fractured ice core.
UG1 Ice Core and the Crack
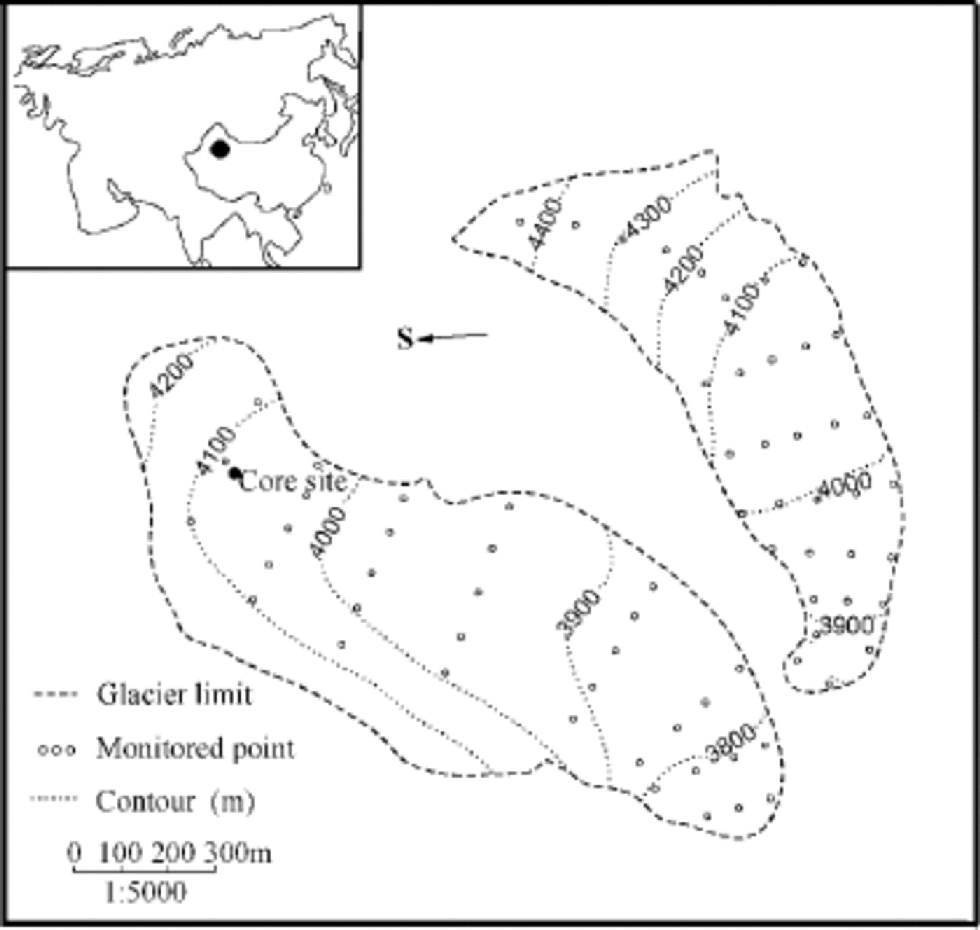
UG1 is located at Ürümqi riverhead, Tien Shan, western China (43˚06’ N, 86˚49’ E) (Fig. 1). It is composed of east and west branches, with a total area of 1.84 km2 in 1980 (Liu and others, 1991). the equilibrium line averaged around 4000ma.s.l. in the past two decades (Tien Shan Glaciological Station, 1979–98). Above the equilibrium line lie the superimposed-ice zone and the percolation zone (Xie and Huang, 1989). Ablation occurs from May to September each year, reaching a maximum in July (Wang and Zhang, 1985; Yang and others, 1992). No noticeable crevasse or crack was observed in the radio-echo sounding measurements in the east branch of UG1 (Zhang and others, 1985), so the meltwater discharge was thought to be mainly through a surface stream system (Kang,1991).

Fig. 1 UG1 and the core site. Dot in the inserted graph indicates the position of UG1 in the Eurasian continent.
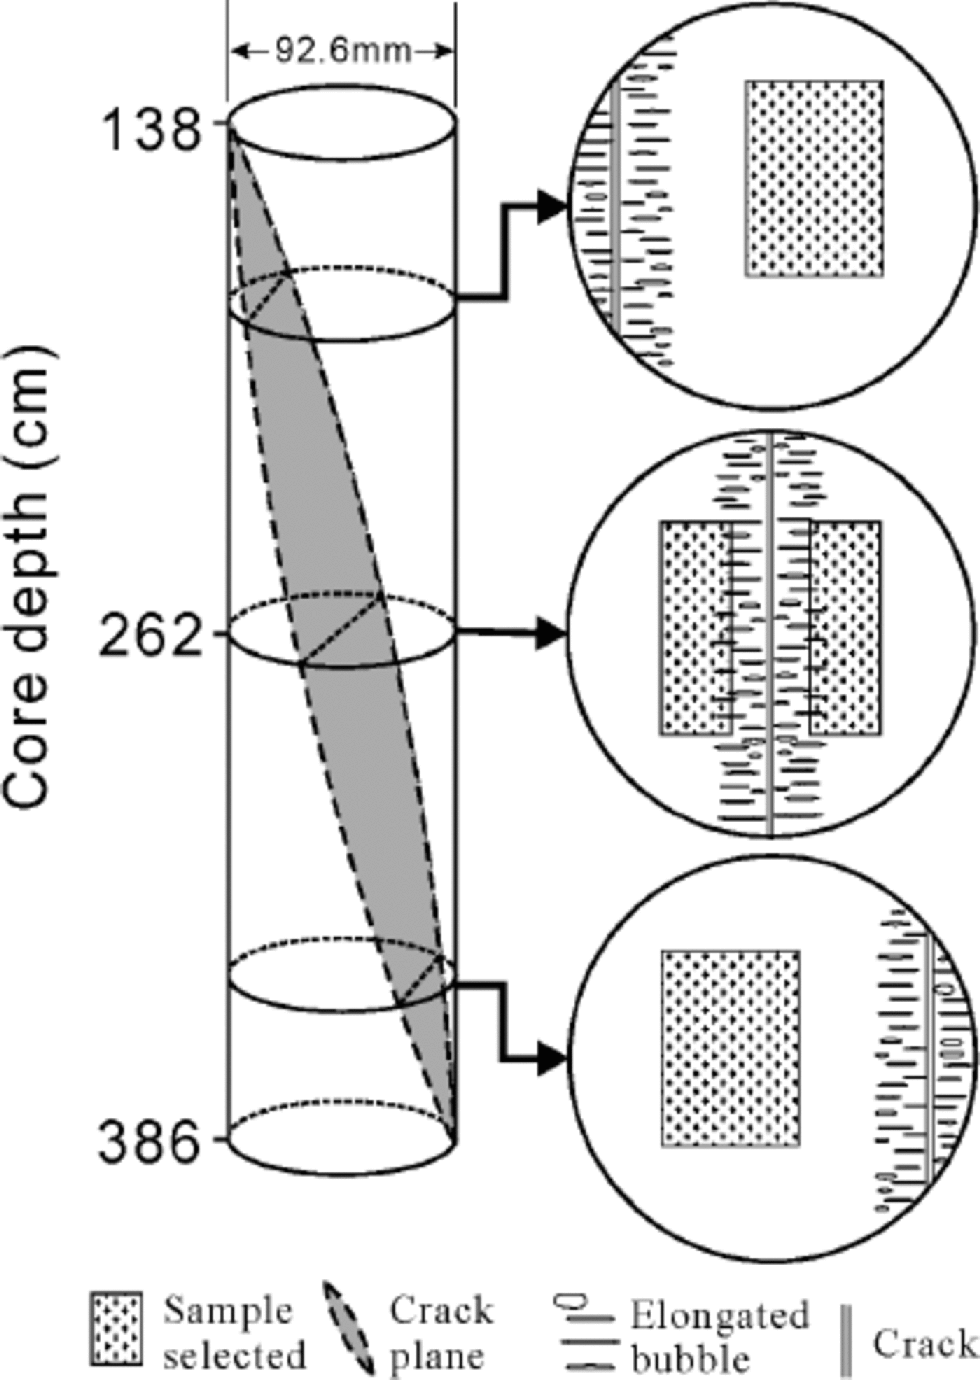
A 14.08m ice core was drilled in October 1998 at 4040ma.s.l. in the then superimposed-ice zone of the east branch (Fig. 1) where there was only 15 cm deep firn on the surface of the glacier. Apart from a small portion of percolating–refrozen ice, which had formed in the percolation zone, and even less ice with dust-rich layers, the core comprises chiefly superimposed ice. In the upper part of the core between 138 and 386 cm, a nearly vertical crack separates the core section into two distinct parts (Fig. 2). the ice with-in 2–3 cm of the fracture is transparent but with uniformly elongated bubbles perpendicular to the fracture plane, suggesting the existence of a continuous strain. A percolating– refrozen ice layer cut by the fracture still keeps its horizontal position, indicating that no sliding movement occurred along the fracture plane.

Fig. 2 Schematic diagram of the orientation of the fracture relative to the core (left), the structure of ice in its two sides, and change of sample loci along the section (enlarged right).
Analytical Procedures
Analytical samples were selected every 2 cm from the central part of the ice core. In the fractured section (FS), however, they were selected to avoid the fracture as much as possible. Where the fracture cuts through the center of the core, samples were selected in both sides. In order to avoid the outer 1cm of the core which is susceptible to the drilling contamination (Reference Legrand, de Angelis and MaupetitLegrand and others, 1993), however, the sampling was compromised by including parts of the transparent ice (Fig. 2). the samples were kept frozen in glass vials with airtight covers until analysis.
Organic and inorganic anions were determined by ion chromatography (DX-300) with an AS4A separator using a gradient method. the analytical uncertainty for most of the anions is <5%. δ18O was measured on a MAT-252 calibrated relative to the Vienna Standard Mean Ocean Water (V-SMOW). the standard deviation indicated by replicate experiment (N =67) is 0.07‰.
Results
Profiles of δ18O, of the anionic species and of pH and ECM are shown in Figure 3, which shows the six-point running mean of respective data. Most of the profiles deviate severely from their main trends in the FS.

Fig. 3 The increase of chemical species, pH and ECM, and the decrease of δ 18O corresponding to the ice crack at 138– 386 cm. All profiles are results from six-point running mean of respective data. the shadowed depth indicates the core section bearing the crack.
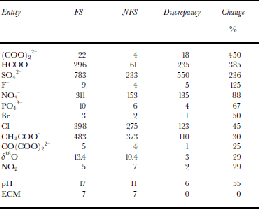
δ18O reaches –15‰ and averages –13.4‰ between138 and 386 cm, compared with the non-fractured sections (NFS) of the core where δ18O fluctuates between –8.5‰ and –12.5‰ and averages –10.4‰. the decrease in the FS exceeds 5‰, which is approximately the difference between the Holocene and the Last Glacial Maximum (LGM) in the Greenland Icecore Project (GRIP) and Vostok (Antarctica) ice cores (Reference LoriusLorius and others, 1985; GRIP Project Members, 1993).Most chemical species and ECM are uniformly enhanced within the FS. the average concentration of F– is 4.0 ng g–1 in the NFS, while it rises to 8.5 ng g–1 over the FS. SO4 2– peaks at 1500 ng g–1 and averages 783ng g–1 in the FS, whereas the upper and lower parts average only 291 and 228 ng g–1, respectively. Also increased are Cl–, Br–, NO3 –, HCOO–, CH3COO–, C2O4 2–, PO4 3–, CO(COO)2 2–, pH and ECM, among which C2O4 2– and HCOO– are enhanced by 450% and 385%, respectively, nearly six times higher than the average concentration in the NFS (Table 1). Cl–, Br–, NO3 –, CH3COO–, PO4 3–, CO(COO)2 2– are enhanced by 25–88%. pH is increased by 55%. the ECM variations in the FS do not show clear elevation in quantity (Table 1), but there is a broad feature near 260 cm (Fig. 3). the close correlation between ECM and pH in UG1 (Hou and others, 1999) and elsewhere, together with the elevation in NO3 – and SO4 2– at this depth, suggests an association between the broad ECM peak and the FS. NO2 –, like δ18O in quantity, is the only chemical species analyzed that is decreased in the FS, by 29%, compared to the NFS. Moreover, it exhibits no striking peak around 260cm, unlike the other chemical species (Fig. 3).
Table 1. Comparison of mean concentration for δ 18O, some organic and inorganic anions, pH and ECM between the FS and the NFS

Discussion
Cracking effect
For the chemical species and pH and ECM, the strongest enhanced peak between 138 and 386 cm appears at around 260 cm. This is the middle part of the FS, and is where the crack cuts through the center of the core, as well as where the analytical samples are closest to the crack. This indicates that the closer to the fracture plane, the higher the chemical-species concentration, which further suggests that the concentration enhancement is caused by the presence of the crack.
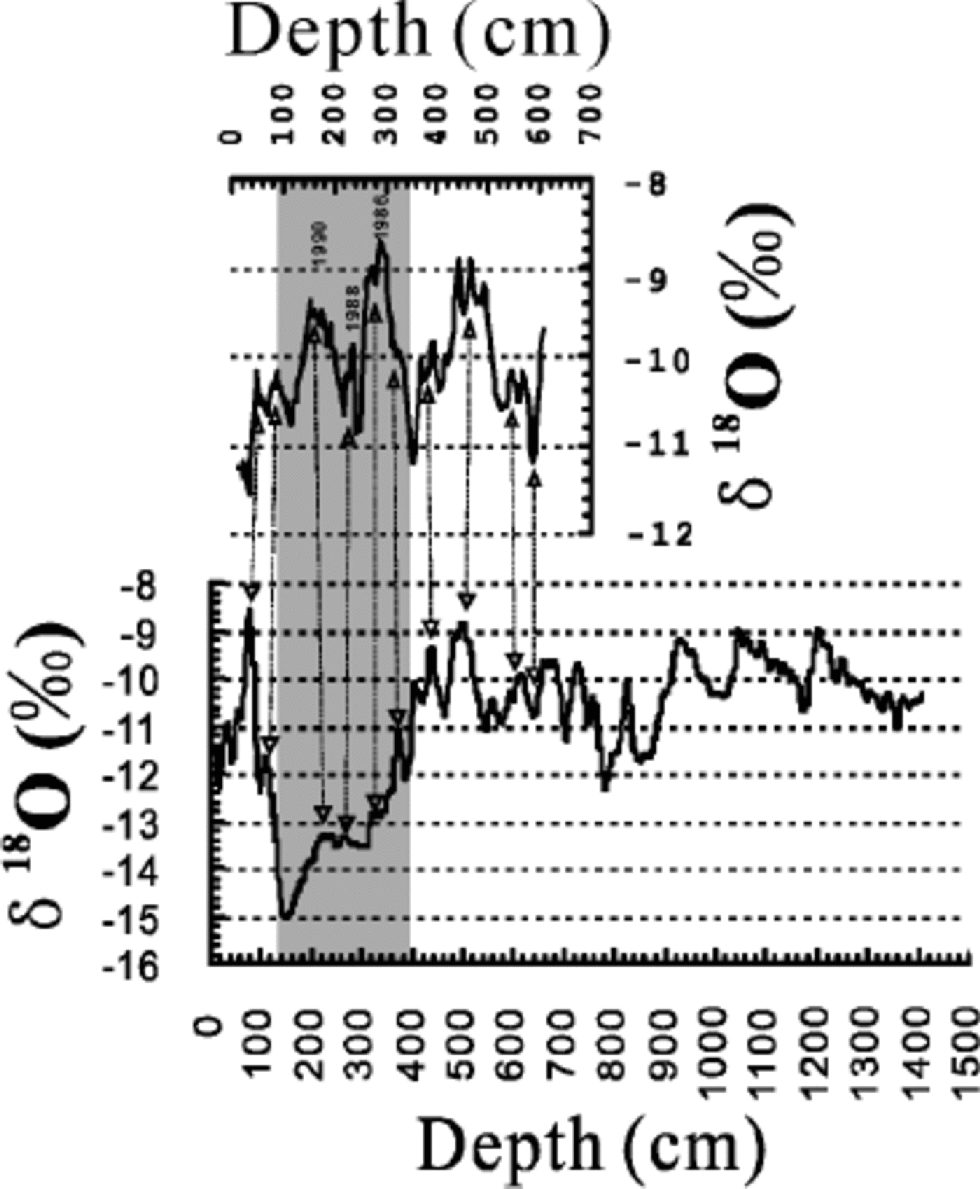
The effect of the crack can also be inferred from other evidence. A non-fractured ice core 6.09 m long retrieved at about the same site in 1996 exhibits no δ18O troughs (Fig. 4) nor peaks for the chemical species and pH and ECM. the variation of δ18O in the shorter core (upper graph in Fig. 4) generally agrees with the change of mean summer temperature, a fact that has been observed in UG1 (Hou and others, 1998). Similarly, there are only small changes of SO4 2–, Cl–, NO3 –, pH and ECM around 200 cm in the shorter core, which should also represent their ``real’’ fluctuations. Furthermore, data of Daxigou meteorological station, 1km away from UG1, recorded no drastic temperature lowering during 1985–95, a period matching the FS of the core. Accordingly, the drastic observed decrease in δ18O and the increases for the other species are not caused by climatic/ environmental changes.

Fig. 4 Comparison of δ 18O profiles for the fractured ice core (below) and a non-fractured one recovered at nearly the same site in 1996 (above). the two cores are aligned according to their dating.
The impact of ice cracking on the parameters is not peculiar to UG1. A 41.05 m ice core recovered in 1996 from Far East Rongbuk Glacier (FER Glacier), Qomolangma (Mount Everest), encountered six cracks, most of which accompany decreases in δ18O and increases in pH, ECM, C2O4 2–, Cl–, NO3 – and SO4 2– (personal communication from Kang Shichang, 2000).
Mechanism for formation of peaks and trough in the FS
In contrast to the effects of diffusion during firnification which tend to smooth peaks and troughs in ice-core records for many chemical species and physical properties (e.g. Reference Staffelbach, Neftel, Stauffer and JacobStaffelbach and others, 1991; Reference Sigg, Staffelbach and NeftelSigg and others, 1992; Reference De Angelis, Legrand and DelmasDe Angelis and Legrand, 1995; Reference KoernerKoerner, 1997; Reference Cuffey and Steig.Cuffey and Steig, 1998; Reference NyeNye, 1998; Hou and others, 1999), the effect of cracking in UG1 appears to produce shifts. for extracting information from ice cores, the former attenuates some climatic or environmental signals, while the latter adds spurious ``events’’ to the records. to some extent, the additional peaks and troughs are more misleading to researchers. the transparency of the ice beside the crack suggests a strong recrystallization which was probably completed quickly, as indicated by the presence of elongated bubbles. Bubble elongation probably formed during rapid ice deformation (Reference Alley and Fitzpatrick.Alley and Fitzpatrick, 1999). Assuming that the recrystallization occurred in a closed or partially closed system that does not receive material from outside, the generation of the peaks and trough in the FS should have resulted in troughs and peak nearby by a simple redistribution of material. Clearly this is not observed, so the recrystallization must have occurred in an open system where the outside material formed the peaks and trough.
The literature shows that melting and refreezing of snow in temperate glaciers leads to isotopic fractionation which causes the depletion of 18O in meltwater, and its enrichment in the remaining solid phase (Reference ArnasonArnason, 1969). This is also the case for UG1. the mean value of δ18O in precipitation over the glacier is –11.0‰ (Hou and others, 1998), while it is –10.4‰ in the ice (this study) and –15.9‰ in the surface stream water (Liu and others, 1999). Unlike δ18O, chemical species are preferentially leached out of snow and concentrated in the meltwater. A field experiment conducted in southern Norway demonstrated that H+, SO4 2–, NO3 –, PO4 3– and Cl– in meltwater are 3–6 times higher than in the bulk snow during the early stage of melting (Reference Johannessen and HenriksenJohannessen and Henriksen, 1978).The same trend has also been observed in other studies (e.g. Reference Gjessing, Hanssen-Bauer, Fujii, Kameda, Kamiyama and KawamuraGjessing and others, 1993; Reference Goto-Azuma, Enomoto, Takahashi, Kobayashi, Kameda and WatanabeGoto-Azuma and others, 1993). In UG1, SO4 2–, NO3 –, Cl–, pH and ECM in surface stream water were unexceptionally higher than in snow, and their highest concentration occurred in early May, about 1week after the glacier begins melting (Liu and others, 1999). Finally, relative to the bulk snow, the meltwater has higher SO4 2–, NO3 –, Cl–, pH and ECM and lower δ18O, which is the same as observed in this study. Therefore, the outside material that eventually produced the transparent ice is the surface meltwater. the extent to which the chemical species and pH and ECM are enhanced is similar to that observed in the early stages of a melting experiment (Liu and others, 1999), indicating that the crack was filled in the early phase of the surface melting.
Solar energy may cause heterogeneous expansion of upper ice in the glacier, thus forming thermocracks (personal communication from L. Thompson, 2000). In that case, the crack must open to the meltwater. the crack encountered in our ice core is probably of this kind, especially given its occurrence at shallow depth.
Original signals in the FS
Though from the FS, samples free of the transparent ice are not disturbed with their signals; only those contaminated by the secondary ice from around 260 cm depth (see Fig. 2) were affected. for δ18O, SO4 2–, NO3 – and Cl– that fractionate considerably in the early melting (Reference Johannessen and HenriksenJohannessen and Henriksen, 1978; Reference Gjessing, Hanssen-Bauer, Fujii, Kameda, Kamiyama and KawamuraGjessing and others, 1993; Reference Goto-Azuma, Enomoto, Takahashi, Kobayashi, Kameda and WatanabeGoto-Azuma and others, 1993; Liu and others, 1999), even a little contamination affects their records significantly. the interference either adds a depression to the original δ18O signal, or boosts the original anionic variations, with the strongest secondary signals occurring at 260 cm. Although the added signals change the overall appearance of the records in the FS, some of the variations can still be seen for some parameters. Thus, δ18O peaks and troughs in the 6.09m core have identifiable counterparts in the FS (Fig. 4). on the other hand, for parameters like CO(COO)2 2–, CH3COO–, NO2 –, pH and ECM that fractionate moderately in the snowmelting, inclusion of the same amount of infiltration ice does not even change their bimodal peaks around 260 cm (see Fig. 3). Therefore, CO(COO)2 2– and ECM could be used for the ice-core dating (Lee and others, 2002).
Obviously, avoiding the introduced ice can minimize the effect of the infiltrated crack. Based on this study, analytical samples in the FS should be chosen 3 cm away from the crack plane. the visual identification of the introduced ice should help in the sampling operation, although, in circumstances where cracks are sealed off and hence more likely to appear as the normal core section, close attention should be paid to the study of physical characteristics of the ice core.
Conclusion
Ice cores recovered in glaciers of the Tien Shan and Qinghai– Tibetan Plateau often encounter cracks. These fractures are much smaller than crevasses and may not be reflected in imagery of radio-echo sounding measurement. Our study reveals a crack that probably formed by the heterogeneous expansion of the shallow ice layers of the glacier, opening to surface meltwater and admitting a 2–3 cm thick layer. This additional ice produces records disturbed by movement of material and influenced by fractionation during phase changes. Small contamination of samples by infiltrated ice increases pH, ECM and most chemical species except NO2 – in the FS by as much as six-fold over the normal part, and reduces δ18O significantly. the primary fluctuations in the FS, however, can survive for some parameters, suggesting that ice cores bearing fractures can still provide authentic records with careful sampling.
Acknowledgements
Special thanks are due to the Tien Shan Glaciological Station for their generous help with our fieldwork. We would like to express our gratitude to the two anonymous reviewers, whose comments helped improve the paper. We are grateful to T. van Ommen for his valuable suggestions and assistance with the paper’s revision. This research is financially co-supported by the National Natural Science Foundation of China (grant Nos. 40073035 and 49871022), the Tien Shan Glaciological Station and the Chinese postdoctoral research foundation.


 CH
CH and CO(COO)
 CO(COO)


