


Introduction
By the end of the 20th century, there was general agreement that, across the globe, labour markets were in transition and employment was becoming less secure. It was argued that the prevalence of secure full-time employment with benefits, known as the Standard Employment Relationship (SER), was in decline. Alternative forms of employment were growing, most of which were temporary and insecure. Today, there are concerns that this trend is continuing, perhaps even accelerating, as new digital technology creates the foundation of a ‘gig’ economy. A ‘gig’ economy is one where the dominant forms of employment are short-term contract work, freelancing and self-employment. The current Canadian Minister of Finance recently advised Canadian workers to get used to ‘job churn’ and short-term employment (National Post, 2016). Some predict that, by 2020, full-time employment with benefits will become scarce in the United States and that 40% of the workforce will be freelancers, contractors or temporary workers (Intuit, 2010).
This article takes a new look at the changing characteristics of employment and offers a method to measure employment security: the Employment Precarity Index (EPI). The EPI is used to explore the security characteristics of different forms of the employment relationship. As well as offering a tool to measure employment security, it sheds light on why official labour market data have not shown a dramatic increase in temporary or casual employment, despite research that suggests employment is becoming less secure. Finally, we use the EPI to assess how insecure employment associated with a ‘gig’ economy might affect well-being and social relations, including health outcomes, household well-being and community involvement.
This study uses a unique Canadian data set of nearly 8000 individual observations collected in 2011 and 2014 by the Poverty and Employment Precarity in Southern Ontario (PEPSO) research group. It includes data on the form of the employment relationship and on whether individuals were in full-time, temporary, contract, seasonal, or part-time jobs or were self-employed. It also includes data on the characteristics of each of these forms of employment, and in particular those characteristics that measure the degree of employment insecurity.
The end of the SER?
Research in Australia, North America and Europe published in the last decade of the 20th century began pointing to fundamental shifts in how workers were employed. Reference SmithSmith (2001), studying employment trends in the ‘New Economy’ in the United States, argued that ‘uncertainty and unpredictability, and to varying degrees personal risk, have diffused into a broad range of post-industrial workplaces, services and production alike. … Opportunity and advancement are intertwined with temporariness and risk’ (p. 7). Around the same time, Reference OstermanOsterman (1999) concluded that in the United States, ‘… the ties that bind the workforce to the firm have frayed. New work arrangements, captured by the phrase “contingent work” imply a much looser link between firm and employee’ (pp. 3–4). Reference CappelliCappelli (1999) suggested, ‘The old employment system of secure, lifetime jobs with predictable advancement and stable pay is dead’ (p. 17).
The view that employment relationships are becoming less secure is reinforced by more recent research. Reference HackerHacker (2006) argues that labour market risks are increasingly borne by workers as employers back away from long-term employment norms. Reference WeilWeil (2014), in a comprehensive study of economic reorganisation and changing corporate forms, argues that the expansion of supply chains and the popularity of franchising have resulted in ‘fissured’ workplaces. This has led to a decline in the prevalence of direct employment relationships, an increase in more precarious forms of employment and an erosion of labour’s ability to bargain improved working conditions. Reference StandingStanding (2011) argues that a new class of workers, the ‘Precariat’, has emerged; workers in insecure jobs who enjoy few employment benefits or social protections.
There is evidence of substantial changes in Canadian labour markets during the last two decades of the 20th century involving the rapid growth of ‘non-Standard Employment Relationships’ (Reference Lewchuk, Clarke and de WolffLewchuk et al., 2011; PEPSO, 2013, 2015; Reference TalTal, 2015, Reference Tal2016; Reference Vosko, MacDonald and CampbellVosko et al., 2009). The province of Ontario’s Changing Workplace Review is currently evaluating the need to revise the province’s labour laws in light of these changes. At the core of this review is a belief that employment today is less secure. The review takes the position that the labour laws and regulations adopted in the decades following World War II, when the SER was more prevalent, no longer serves the needs of Ontario’s workers (Reference Mitchell and MurrayMitchell and Murray, 2016).
For young workers, and the growing legions of immigrants searching the globe for work, these changes have been especially devastating. In many ways, it is the young workers who are the ‘guinea pigs’ for the emerging ‘gig’ economy (Reference AdamsAdams, 2016). A recent Canadian report paints a dire picture facing young workers. They are over-represented among the unemployed and are often working involuntarily in part-time jobs – over one-third are employed in temporary jobs and many work without pay to gain ‘experience’ (Canadian Labour Congress, 2016). Others have shown how the prevalence of precarious employment is challenging the ability of young workers to progress through their life course as insecurity delays long-term life decisions – an issue we will return to in what follows (Reference Chan and TweedieChan and Tweedie, 2015). The expanding global immigrant workforce can often face a dual insecurity of working in precarious employment, while facing a precarious citizenship status. A recent Canadian study has shown how employers in the service sector in Canada recruit immigrant workers into temporary positions on temporary work visas. Their performance at work then influences whether they will be given an opportunity to apply for permanent Canadian citizenship (Reference PolancoPolanco, 2016).
A growing body of research on economic restructuring points to how it is leading to a broad decline in employment security. A recent report to the International Labour Organisation (ILO) documented the prevalence of insecurity in the apparel economy, for example, in the H&M group’s global value chain, where much of the work is precarious, low paid and often unhealthy (Workers’ Voices from the Global Supply Chain, 2016). Others have argued that as employment disappears in old sectors of the economy, what replaces it is often highly insecure (Reference BurrowsBurrows, 2013). Much of the above research has focused on groups of workers who are the most likely to be in insecure forms of employment. However, in thinking about precarious employment, it is important to understand that as young workers, immigrant workers and displaced workers see precarious employment as their only option, the bargaining position of those who remain in ‘permanent’ employment is undermined. As argued by Reference CooperCooper (2014), a permanent job today has become less of a guarantee of a permanent job tomorrow for many workers who still see themselves in secure employment.
However, despite this body of literature, all of it arguing there has been a decline in the prevalence of the SER, and the acceptance of its conclusions by many policy makers, there is a significant minority view that the core features of labour markets in developed countries have not changed significantly and have been relatively unaffected by the economic events of the last several decades (Reference BernhardtBernhardt, 2014; Reference CrossCross, 2015; Reference DePratto and BartlettDePratto and Bartlett, 2015; Reference DooganDoogan, 2009; Reference QuinlanQuinlan, 2012; Reference Pyӧriӓ and OjalaPyӧriӓ and Ojala, 2016). Their analysis points to continuity rather than disruption in employment relationships.
One indicator of continuity is the relatively small change in the prevalence of temporary forms of the employment relationship reported in official labour market statistics. This raises the question whether or not official statistics capture fully the prevalence of sub-contracting, agency work, faux self-employment, and so on. Reference Wooden and RichardsonWooden and Richardson (2016) have recently reviewed the evidence on the share of casual employment in Australia. They conclude that while this figure increased in the late 1980s and early 1990s, it has remained relatively unchanged since. This is surprising as most of the growth in ‘gig’ work through online job sites, such as Airtasker, Etsy, Nvoi, TaskRabbit, Uber and Airbnb, has occurred since 2000. Reference BernhardtBernhardt (2014) makes a similar argument for the United States suggesting that ‘[a]t least with aggregate national data, it has been hard to find evidence of a strong, unambiguous shift toward nonstandard or contingent forms of work’ (p. 15). Reference DooganDoogan (2009), examining official data on trends in the United Kingdom and the United States, argues that the increase in temporary employment has been modest, and that official data do not support the thesis that the SER is unravelling. Focussing on changes over the last two decades, Reference CrossCross (2015) argues that Canada has not moved to a ‘contingent’ workforce, and that observed increases in self-employment and part-time employment reflect demographic shifts and changing lifestyle choices rather than structural changes in how labour markets function (pp. 4–7). A recent report from the Toronto-Dominion (TD) Bank research unit also argues that Canadian data on the prevalence of different forms of the employment relationship do not support the thesis of major structural changes in the relationship between employers and employees (Reference DePratto and BartlettDePratto and Bartlett, 2015: 3). Using Finnish data and an index of employment characteristics that includes the form of the employment relationship, Reference Pyӧriӓ and OjalaPyӧriӓ and Ojala (2016) reach the same conclusion.
How can labour markets be in the midst of a fundamental restructuring according to some authors, yet official labour market data indicate that change has been relatively modest, at least as measured by the decline of full-time forms of employment and the growth of temporary forms of employment? Part of the answer likely rests on appreciating that work under capitalism has never been all that secure for many workers; thus, the current period is not as different from the past as some would have us believe. Yet, it is hard to accept that nothing has changed given the sheer volume of research all pointing to a decline in secure employment since the 1980s.
The next section of this article seeks to understand more clearly what the form of the employment relationship actually measures. Official labour market data rarely provide more than simple binary measures such as ‘Are you working full-time or part-time? Is your job permanent or temporary? Are you self-employed?’ I argue that one reason for the diverging opinions regarding labour market trends is that these simple measures fail to capture the broader changes across all forms of employment that have taken place since the 1980s. While official labour market data do point to a modest increase in the prevalence of temporary jobs, they are unable to describe potential changes in the characteristics of notionally permanent jobs, or how some of these jobs have many of the characteristics of temporary employment. This article makes use of an EPI, composed of 10 different indicators of an employment relationship’s characteristics. The findings suggest that the form of the employment relationship as reported in official labour market data is a misleading proxy variable for either the SER or for precarious employment. A surprising number of jobs that respondents described as permanent in our study in fact had the characteristics of temporary employment, including uncertainty about future employment prospects, variable earnings and changing work schedules.
One interpretation of our findings is that while official labour market data treat permanency and temporariness as binary categories (you are either permanent or temporary), in reality there is a continuum between the two extremes. The transition that researchers argue has taken place in labour markets over the last few decades might better be described as a shift along this continuum, with a large number of workers moving towards more temporariness but only a small number seeing themselves as having moved across a line where they would self-report being in temporary employment. To fully understand the changes that have taken place in labour markets, researchers need to focus on more than the increased prevalence of temporary employment. Researchers need to explore changes in the security of jobs that official labour market data, and workers themselves, continue to report as permanent.
Is precarious employment growing?
In the North American context, the SER is generally understood to be permanent full-time employment with a single employer that includes reasonable wages and benefits such as supplemental health costs and pensions (Reference VoskoVosko, 2000: 24). There is no agreed definition of precarious employment other than employment that offers less employment security and fewer benefits than the SER. Assessing labour market trends is complicated by the lack of direct measures of the SER. Official labour market data provide two potential indicators of the SER: the prevalence of full-time employment and the prevalence of permanent employment. These indicators only partially capture the characteristics of the SER. Using official labour market data to measure the prevalence of precarious forms of employment is equally problematic. The prevalence of self-employment has been measured since the 1970s; however, most countries only began collecting data on the number of workers in short-term, casual, or temporary employment in the 1990s.
What do official labour market data indicate are the trends in the prevalence of the SER? Table 1 reports the incidence of full-time employment as a share of total employment as reported to the Organisation for Economic Cooperation and Development (OECD). The largest decline was reported in Australia followed by Canada, with both countries experiencing the bulk of this decline prior to 2000. The reported decline was less significant in the United States.
Table 1. Incidence of full-time employment: Australia, Canada and the United States (%).

The US Government Accountability Office (GAO) recently released a report that estimates the number of workers in permanent full-time employment. It draws on several US workplace surveys, provides estimates between 1995 and 2010 and suggests that permanent full-time employment increased by 1.6 percentage points between 1995 and 2005, then fell by 5.1 percentage points from 2006 to 2010 (GAO, 2015). Table 1 and the analysis from the GAO point to a decline in full-time employment since the 1970s of 5 percentage points in Canada, a bit more in Australia and a bit less in the United States, with the pace of change appearing to have slowed since 2000.
It is more challenging to assess trends in the prevalence of precarious forms of employment from official labour market data. The US Bureau of Labor Statistics (BLS) began collecting data on ‘contingent’Footnote 1 employment only in 1995 and even now collects these data only periodically. The last US Current Population Survey that included the Contingent Work Supplement took place in 2005 (US BLS, 2005).Footnote 2 Statistics Canada followed the US example in 1997 when they started asking workers annually if they were employed on a contract with a fixed end-date, including employment that was seasonal, temporary, term or casual.Footnote 3
The US BLS report referred to above also provides an estimate of the number of workers in job categories it considers as precarious. Their estimates are reported in Table 2 and suggest that precarious employment may have decreased between 1995 and 2005 before growing between 2005 and 2010. Their analysis suggests that over the entire period, precarious employment increased between 20% and 25% (US GAO, 2015: 14, 16). A preliminary analysis of data from the RAND-Princeton Contingent Worker Survey, that replicates the US Contingent Work Survey for 2015, points to a continuation of this trend, with alternative work arrangementsFootnote 4 increasing by 50% between 2005 and 2015 (Reference Katz and KruegerKatz and Krueger, 2016: 7).
Table 2. US estimates of precarious employment (%).

Source: US Government Accountability Office, 2015: 14, 16.
* The core precarious workforce includes agency, temporary, oncall and company contract workers.
The relevant Canadian data are presented in Table 3. People in precarious forms of employment include those in temporary employment and the self-employed without employees. The best available estimate suggests that the prevalence precarious employment increased about 50% in the 1990s, but is virtually unchanged since.
Table 3. Percentage of workers in precarious forms of employment: Canada (total employed, all classes of workers, age 14 years+; %).

Sources: Statistics Canada tables 282-0012 and 282-0080.
* 1989 temporary employment Reference Vosko, MacDonald and CampbellVosko et al. (2009: 30; ages 15–64 years only).
A similar pattern can be found in other countries (Reference Burchell, Ladipo and WilkinsonBurchell et al., 2002; Reference Heery and SalmonHeery and Salmon, 2000). Reference Campbell and BurgessCampbell and Burgess (2001) reported that, between 1983 and 1998, temporary employment increased in 12 of the 15 OECD countries; in four countries (Australia, France, the Netherlands and Spain), the increase exceeded 50%. OECD data indicate a gradual increase in the prevalence of temporary employment, from around 5% for men and 7% for women in Europe in 1983 to around 15% for both men and women by 2006 (Reference Benach, Gimeno and BenavidesBenach et al., 2004: 316; Reference Goudswaard and AndriesGoudswaard and Andries, 2002: 11; OECD, 2017). Australia has seen a particularly strong trend towards less permanent forms of employment. Casual employment plus self-employment increased from 28% of all employment in 1982 to 40% in 1999 (Reference Burgess and De RuyterBurgess and De Rutyer, 2000; Reference Campbell, Whitehouse, Baxter, Vosko, MacDonald and CampbellCampbell et al., 2009; Reference Louie, Ostry and QuinlanLouie et al., 2006). During the same period, self-employment, which many researchers associate with precarious employment, also increased in many economies (Reference Arum and MüllerArum and Müller, 2004).
The available official labour market data point to a modest decline in permanent and full-time employment and an equally modest increase in precarious employment. Most of the change appears to have occurred prior to 2000, although data from the US suggest that there may have been a further increase in precarious employment after 2005. The magnitude of the changes appears relatively small in most countries, other than Australia, France, the Netherlands and Spain. Changes of these magnitudes could very well be explained by demographic shifts and worker preferences as suggested by Cross above. They do not seem to be of the magnitude one would expect given the consensus view of significant changes in the labour market discussed in the introduction. Nor is there much evidence of a post-2000 change related to the growth of the ‘gig’ economy. Reference Katz and KruegerKatz and Krueger (2016) estimate that only about half a percent of US workers were employed through online intermediaries in 2015 (p. 3).
More recent research is revealing the limitations of relying on official labour market data and data on the form of the employment relationship to measure either the prevalence of the SER or the prevalence of employment precarity. Reference WeilWeil (2014), in describing the changing boundaries of the modern corporation and the increasing reliance on supply chains, franchising and freelancers, suggests that the official statistics on the form of the employment relationship are misleading as an indicator of employment precarity. He writes,
Fissured employment represents both a form of employment (for example, temporary agency employment, independent contracting) and a relationship between different business enterprises (subcontracting, franchising). It reflects not only who does the work, but also the structure of contracts and the relative power between those enterprises that contract for and those enterprises that are contracted to do the work. (Reference WeilWeil, 2014: 270)
As a result of changing power relationships between what he calls ‘lead’ firms and the firms who contract to do work for lead firms, many workers who claim to be employed in permanent jobs are actually quite precarious:
Though workers in those subordinate businesses may be classified as employed on a standard, full-time basis, the relationship between lead firms and those where these workers are employed may be fissured and therefore likely to have the characteristics of precarious employment. (Reference WeilWeil, 2014: 273; emphasis added)
The next section of this article takes up the challenge presented by Weil’s assessment of the impact of fissuring by looking in more detail at the employment characteristics of workers in the PEPSO sample who self-report being in either permanent or temporary employment.
The form of the employment relationship as an indicator of employment precarity
The continued controversy over whether labour markets are transitioning away from the SER to a model of employment that is less secure speaks to the need to explore in more detail how to measure employment precarity and what exactly the form of the employment relationship is measuring. There are several ongoing efforts to develop measures of employment precarity that go beyond simply measuring the form of the employment relationship (Reference Bohle, Quinlan and McNamaraBohle et al., 2015; Reference Gallie, Felstead and GreenGallie et al., 2017; Reference Goldring and LandoltGoldring and Landolt, 2009; Reference Lewchuk, Clarke and de WolffLewchuk et al., 2011; Reference Puig-Barrachina, Vanroelen and VivesbPuig-Barrachina et al., 2014; Reference Vives, Amable and FerrerVives et al., 2010; Reference VoskoVosko, 2006). In an interesting recent article, Reference Gallie, Felstead and GreenGallie et al. (2017) have suggested measuring two related components: job tenure insecurity and job status insecurity. They argue that job tenure insecurity refers to characteristics of employment that measure ‘anxiety about loss of employment’, while job status insecurity measures ‘the threat of loss of valued features of the job’. We see this as a useful development, and is in keeping with Weil’s argument that jobs can become less secure without necessarily becoming temporary. Our own research points to an increase in ‘precarious’ employment as well as a deterioration in the quality of jobs that survey respondents still described as permanent. It is beyond the scope of this article to take up this issue in detail.
To begin answering what is the relationship between the form of the employment relationship and the employment characteristics that makes employment precarious, we use a unique Canadian data set collected by the PEPSO research group. In 2011 and in 2014, PEPSO commissioned phone surveys with participants selected via random digit dialling. The sample was representative by sex, age and the different regions that make up the Greater Toronto and Hamilton study area. The database includes just over 8000 individual surveys, half collected in 2011 and half in 2014. Respondents were between the ages of 25 years and 65 years. For the purposes of this article, we drop the 291 respondents who reported that they were self-employed with employees, leaving 7908 observations. The average length of the survey was 15 minutes and was conducted in English.Footnote 5
The survey asked participants to identify the form of their employment relationship, including whether they were employed casually, on a short-term contract, self-employed, in permanent part-time employment, or in permanent full-time employment. We also asked a series of questions detailing the characteristics of employment relationships. To offer a more accurate measure of employment security, we developed the EPI. The Index is made up of 10 indicators based on PEPSO survey questions. Each indicator was assigned the same weight in the Index.Footnote 6 Index scores ranged from 0 to 95. The mean score was 23.7 with a standard deviation of 21.4. The questions that made up the Index included:
• Do you usually get paid if you miss a day’s work?
• Do you have one employer, whom you expect to be working for a year from now, who provides at least 30 hours of work a week, and who pays benefits?
• In the last 12 months, how much did your income vary from week to week?
• How likely will your total hours of paid employment be reduced in the next 6 months?
• In the last 3 months, how often did you work on an on-call basis?
• Do you know your work schedule at least 1 week in advance?
• In the last 3 months, what portion of your employment income was received in cash?
• What is the form of your employment relationship (short-term, casual, fixed-term contract, self-employed, permanent part-time, or permanent full-time)?
• Do you receive any other employment benefits from your current employer(s), such as a drug plan, vision, dental, life insurance, pension, and so on?
• Would your current employment be negatively affected if you raised a health and safety concern or raised an employment-rights concern with your employer(s)?
Scores on the EPI were used to divide the sample into four relatively equal-sized employment security categories (Secure, Stable, Vulnerable and Precarious). There were substantial differences in Index scores between the categories (see Table 4).
Table 4. Employment Precarity Index (EPI) scores by employment security categories (#).
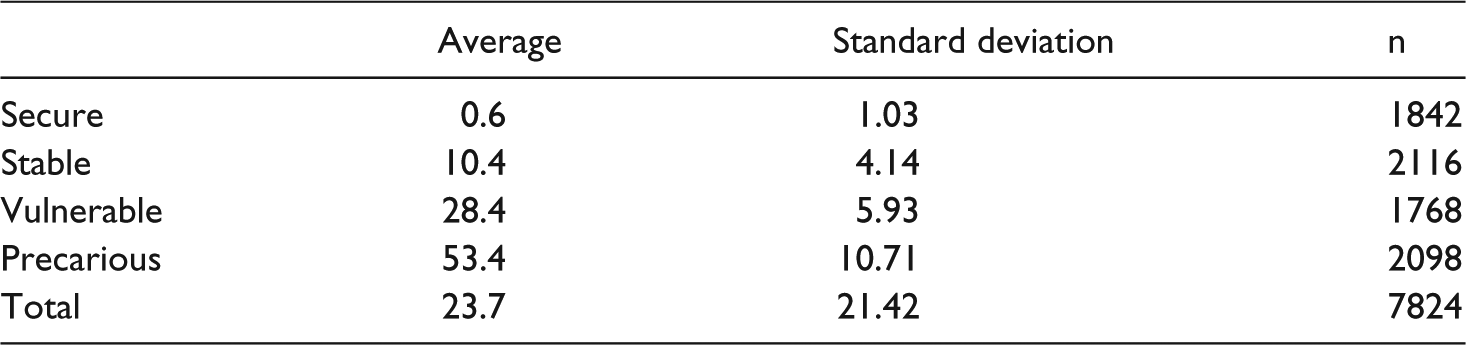
Source: PEPSO (2013, 2015).
Table 5 reports the EPI scores for the three main types of self-reported forms of the employment relationship. The form of the employment relationship is a reasonable proxy for employment insecurity and is correlated with the EPI. The EPI rises as one moves from the most secure category (permanent full-time) to the least secure category (temporary). The range between the most secure and the least secure category was less than in Table 4.
Table 5. Employment Precarity Index (EPI) scores by form of the employment relationship (#).

Source: PEPSO (2013, 2015).
* Temporary includes: agency, temporary, seasonal, contract and own account self-employed.
However, further analysis revealed that the permanent full-time category included two significantly different categories of workers: SER and non-SER categories. To identify who was in the SER category, we use three further questions on the survey. Survey respondents who reported they were in permanent full-time employment also had to have answered yes to a question asking if they had one employer who provided at least 30 hours of work per week and with whom they expected to be working for at least 12 months. They also had to have responded yes to a question asking if they received benefits other than a wage. Of the 5574 respondents who reported they were in permanent full-time employment in the PEPSO survey, just over 900 respondents were unsure if they would still be with their current employer in 12 months. An additional 500 respondents reported that they would be with their current employer in 12 months but that they received no benefits other than a wage from their current employer.
Table 6 takes this information and revises the findings reported in Table 5, dividing the permanent full-time category into SER and non-SER categories. The findings are a caution to anyone using self-reported data on permanent full-time employment as a proxy for employment security or the SER. The non-SER category, all of whom reported they were in permanent full-time employment, had EPI scores significantly different from those in the SER category. Their scores were actually closer to the scores of workers in the temporary employment category than those in the SER category.
Table 6. Employment Precarity Index (EPI) scores by form of the employment relationship (#).
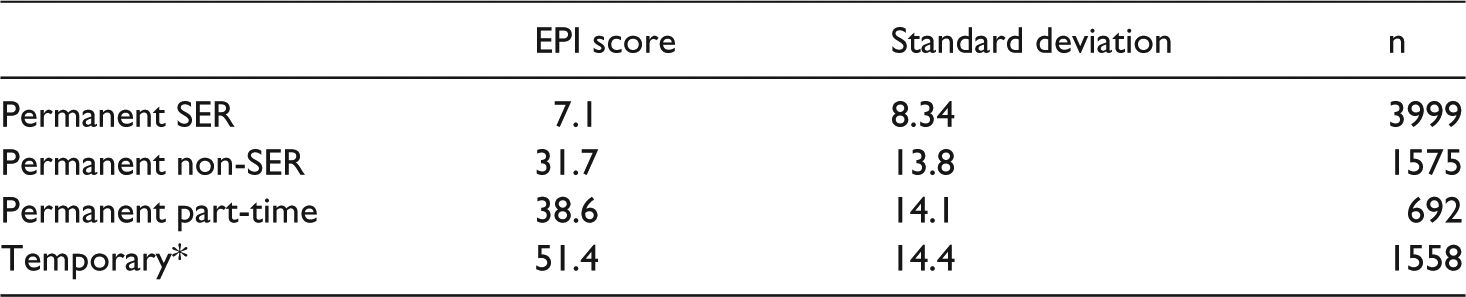
Source: PEPSO (2013, 2015).
* Temporary includes: agency, temporary, seasonal, contract and own account self-employed.
What are the characteristics of workers in SER, non-SER and temporary employment categories? Table 7 provides several key indicators are as follows:
There were relatively small differences in the percentage that are male or female.
The SER category includes fewer younger and older workers. Its members were the most likely to be in jobs requiring a university degree and were also more likely to have a degree. They were as likely as the temporary category to work in the knowledge sector or the service sector. They had higher earnings and lived in households with higher incomes.
The non-SER category were the most racialised, the least likely to be in the knowledge sector and the most likely to be in the service sector. They were the least likely to work in jobs requiring a university degree and the most likely to be in jobs requiring only on-the-job training. They were the least likely to have a university degree. Their income and household income fell between that of the temporary category and that of the SER category.
Workers in the temporary category were as likely as the SER category to be in the knowledge or service sector. They were more likely than the non-SER category but less likely than the SER category to be in a job requiring a university degree. They were as likely as the non-SER category to require only on-the-job training but marginally more likely to have a degree. They earned the least and lived in households with the lowest household income.
Table 7. Characteristics of SER and non-SER categories.

Source: PEPSO (2013, 2015).
* Omits respondents living alone.
The final step in assessing the validity of employment forms as a measure of employment security is reported in Table 8. Table 8 uses data on the form of the employment relationship to assess the composition of the four employment security categories based on the EPI. Both the Secure and the Stable categories correspond closely to the SER category. The results show less agreement between the employment forms and the employment security categories in the case of the Vulnerable and Precarious categories. Only 60% of the Precarious category were made up of workers who self-reported being in temporary employment. Nearly one-quarter of this category were workers who self-reported being in permanent full-time employment.
Table 8. Employment relationship categories by form of the employment security categories (%).

Source: PEPSO (2013, 2015).
* Temporary includes: agency, temporary, seasonal, contract and own account self-employed.
The finding in Table 8 suggests that part of the confusion over recent labour market trends is that a significant number of workers who report they are in permanent full-time employment are in fact employed in relationships with many of the characteristics of precarity. It is beyond the scope of this article to test what percentage of these workers are in fissured workplaces as described by Weil, and whether this category is growing. We can speculate that at least part of the public anxiety over current conditions in labour markets is because many permanent full-time jobs are not what they used to be, and certainly have few of the characteristics of an SER. The form may look like an SER, but the experience of employment is likely to be more like that of a temporary or contract worker.
The social effects of precarious employment
In the final section of this article, we use the EPI to explore the social impact of insecure employment. If ‘gig’ work does become more prevalent, the majority of ‘gig’ workers would have the characteristics of the Precarious category based on the EPI.
Table 9 provides an indication of the potential health effects of precarious employment. Survey respondents were asked to self-assess their health. After controlling for age, sex, race and education, those in the Precarious category were significantly more likely to report that their general health was less than very good than were those in Secure employment. They were even more likely to report that their mental health was less than very good.Footnote 7
Table 9. Health effects of precarious employment (odds ratios).

Source: PEPSO (2013, 2015); controlled for age, sex, race and education.
* p ⩽ .10;
** p ⩽ .05;
*** p ⩽ .001.
Table 10 presents findings from several questions that provide an indication of how precarious employment might affect household well-being and social relations. Survey respondents in the Precarious category were more than twice as likely to report that anxiety about their employment relationship interfered with personal and family life. For the younger workers in the sample, there was also evidence that they were significantly more likely to delay forming relationships and more likely to delay having children. The question exploring friendships at work suggests that not having a permanent workplace makes it more difficult to form workplace-based friendships that could be called on in time of need. The findings in Table 10 are consistent with recent research into the social effects of precarious employment in Australia by Reference Chan and TweedieChan and Tweedie (2015), Reference Wilson and EbertWilson and Ebert (2013), Reference ChanChan (2013) and Reference WoodmanWoodman (2013). This research concludes that precarious employment creates social stress and anxiety that taxes families and makes forming friendships challenging.

Table 11 provides a final insight into how precarious employment and the spread of a ‘gig’ economy might affect social relations. The EPI was used to divide the sample into an insecure category and a secure category. The insecure category corresponds to the Vulnerable and the Precarious categories, and the secure category corresponds to the Secure and Stable categories. We further divided the sample into three income categories: <CAD40,000; CAD40,000–79,999; and CAD80,000+.
Table 11. Household well-being and precarious employment by employment security and income (%).

Source: PEPSO (2013, 2015).
Low income <$40,000; Middle income $40,000–79,999; High income $80,000+.
Table 11 indicates that while rising income can mitigate some of the negative effects of precarious employment, even workers in middle income positions earning between CAD40,000 and CAD80,000 are more likely to report anxiety, delayed household formation and challenges forming friendships at work. The findings suggest that, while low paying and insecure employment is most likely to lead to negative social outcomes, workers in middle income and insecure employment are more likely to report negative outcomes than workers in middle income and secure employment. They are also likely to report more social challenges than workers in low income and secure employment.
The policy implications of Tables 10 and 11 are profound. They suggest that, even if ‘gig’ economy positions are well paid, our households and our society are likely to come under significant stress. Tension at home is likely to increase, family formation is likely to slow and friendships are likely to be less common.
Conclusion
The goal of this article has been to understand why, on one hand, there is general consensus that labour markets are undergoing a transition and that employment is becoming less secure while official labour market data point to relatively modest changes in the prevalence of full-time, permanent and temporary employment. It has been argued that official labour market data mask a change that is taking place within the full-time/permanent form of employment that is making many of these jobs less permanent, less full-time and less secure, even though the holders of these jobs self-report they are in permanent full-time employment. The evidence for this came from the PEPSO database which allowed an analysis of the characteristics of different forms of the employment relationship. It has been shown that a substantial number of respondents in the PEPSO sample who reported they were in permanent full-time employment had employment characteristics that were much closer to insecure temporary employment than they were to workers in a SER.
In order to assess fully the potential social cost of an expanding ‘gig’ economy and the implications of the changing nature of employment described by numerous researchers, it is essential to assess properly who is permanent and who is precarious. Official labour market data that rely on a binary classification (you are either permanent or temporary) have the advantage of simplicity and are widely available. The research presented in this article suggests that such data can be a misleading indicator of employment insecurity. Use of a more nuanced measure of employment insecurity, such as the EPI, allows a more precise allocation of workers to employment security categories and allows a deeper understanding of the potential social costs associated with employment trends in labour markets. Our research suggests that increased overall employment insecurity in labour markets will be associated with poorer health outcomes, increased anxiety at home, delayed household formation and greater social isolation.
Acknowledgements
Others involved directly in this project include Michelynn Laflèche, Diane Dyson, Luin Goldring, Alan Meisner, Stephanie Procyk, Dan Rosen, John Shields and Peter Viducis. Dale Brown helped clarify the arguments in this article. An earlier version of this article was presented at the Annual Conference of Heterodox Economists. This article benefited from the comments of Michael Quinlan, Philip Bohle and Dale Brown. Thanks also to the anonymous referees.
Funding
This study was made possible by the support of the funds from the United Way Toronto and York Region-McMaster University Social Sciences and Humanities Research Council Community-University Research Alliances (SSHRC CURA) project on Poverty and Employment Precarity in Southern Ontario.


