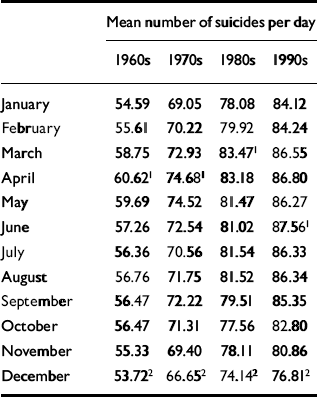
Yip et al (Reference Yip, Chao and Chiu2000) reported that the seasonal variation of suicides in England and Wales had declined in recent decades. This does not appear to be the case in the USA. Monthly data for the number of suicides were available for the period 1960-1998 (National Center for Vital Statistics, 1960-1999; additional data J. McIntosh, personal communication, 2001). Chi-squared tests were conducted for each year for the monthly distribution (correcting for the number of days in each month), and contingency coefficients calculated in order to control for the number of suicides each year. There was no linear trend in the contingency coefficients over the 39-year period (Pearson r=0.033). The month with the peak number of suicides varied over the 39-year period, but not in any linear fashion (see Table 1 for a summary by decade).
Table 1 Summary by decade of suicides in USA

| Mean number of suicides per day | ||||
|---|---|---|---|---|
| 1960s | 1970s | 1980s | 1990s | |
| January | 54.59 | 69.05 | 78.08 | 84.12 |
| February | 55.61 | 70.22 | 79.92 | 84.24 |
| March | 58.75 | 72.93 | 83.471 | 86.55 |
| April | 60.621 | 74.681 | 83.18 | 86.80 |
| May | 59.69 | 74.52 | 81.47 | 86.27 |
| June | 57.26 | 72.54 | 81.02 | 87.561 |
| July | 56.36 | 70.56 | 81.54 | 86.33 |
| August | 56.76 | 71.75 | 81.52 | 86.34 |
| September | 56.47 | 72.22 | 79.51 | 85.35 |
| October | 56.47 | 71.31 | 77.56 | 82.80 |
| November | 55.33 | 69.40 | 78.11 | 80.86 |
| December | 53.722 | 66.652 | 74.142 | 76.812 |


eLetters
No eLetters have been published for this article.