Introduction
Momordica charantia L., commonly known as bitter gourd or karela, is a vegetable of economic interest and is consumed throughout the world. It is the largest cultivated species of the genus Momordica and belongs to the cucurbits family (Schaefer and Renner, Reference Schaefer and Renner2011). Globally different fruit morphological types are available for bitter gourd where wild and small-fruited forms are mentioned in the ancient scripture of the Indo-Aryan Ayurveda system, which witnesses the awareness about medicinal uses (Decker-Walters, Reference Decker–Walters1999). This plant species mainly originated in southern China or eastern India and was distributed to the tropical and subtropical regions of Asia, Amazonia, East Africa and subsequently cultivated widely around the world (Lubinska-Szczygeł et al., Reference Lubinska-Szczygeł, Różańska, Namieśnik, Dymerski, Szterk, Luksirikul and Gorinstein2019). Traditionally, the species has been utilized as a natural cure for diabetes (Patil et al., Reference Patil, Jayaprakasha and Vikram2012). Consumers prefer the immature or unripe fruit as a vegetable or as an alternative folk medicine that contains several bioactive compounds, including glycosides, saponins, alkaloids, terpenes, proteins and steroids (Dhillon et al., Reference Dhillon, Sanguansil, Singh, Masud, Kumar, Bharathi, Yetişir, Huang, Canh, McCreight, Grumet, Katzir and Garcia-Mas2017; Lubinska-Szczygeł et al., Reference Lubinska-Szczygeł, Różańska, Namieśnik, Dymerski, Szterk, Luksirikul and Gorinstein2019). Besides the general chemical composition which is also found in the other cucurbits fruits, bitter gourd contains a comparatively high amount of ascorbic acid and iron that makes it more beneficial for human health and elevates its market demand in the countries of its habitation (Behera et al., Reference Behera, Dey and Sirohi2006).
The fruits have diverse morphological traits in their colour, shape, size, surface texture, skin pattern and ridges, provide broad phenotypic variation and are often preferred by consumers with different interests, e.g. vegetables, juice, stir-fried, steamed and salad (Decker-Walters, Reference Decker–Walters1999; Behera et al., Reference Behera, Dey and Sirohi2006, Reference Behera, Dey, Datta, Kole, Kole, Matsumura and Behera2020). To meet the demand, nearly 20 different fruit morphology types of bitter gourd are seen in Asia and cultivated mainly in India, China, Nepal, Bangladesh and Sri Lanka (Dhillon et al., Reference Dhillon, Sanguansil, Singh, Masud, Kumar, Bharathi, Yetişir, Huang, Canh, McCreight, Grumet, Katzir and Garcia-Mas2017). Approximately 1000 bitter gourd accessions are preserved in the national gene banks of India (ICAR, India) at various locations (New Delhi, Jodhpur, Hyderabad, Thrissur, Shillong, Ranchi and Varanasi). In addition, The World Vegetable Centre (WorldVeg) listed 425, and the United States Department of Agriculture, Agricultural Research Service listed 103 bitter gourd accessions as seeds from 22 different countries, including 48 accessions from India (Dhillon et al., Reference Dhillon, Sanguansil, Singh, Masud, Kumar, Bharathi, Yetişir, Huang, Canh, McCreight, Grumet, Katzir and Garcia-Mas2017). Genetic analysis data of bitter gourd established that India should probably be considered a primary centre of its diversity (Behera et al., Reference Behera, Dey, Datta, Kole, Kole, Matsumura and Behera2020). This enormous support producing new, improved cultivars with superior agronomic traits supports the world in the fight against hunger and malnutrition. However, in crop improvement programmes, the primary and most crucial part is correctly identifying, distinguishing and characterizing the germplasms and gain knowledge of genetic diversity for recognizing gene pools, to develop effective conservation and management strategies.
Analysis of morphological parameters was the most traditional practice used to distinguish between different species, varieties and cultivars of various crops and plants for many years (Korir et al., Reference Korir, Han, Shangguan, Wang, Kayesh, Zhang and Fang2013). In a crop like bitter gourd where broad phenotypic variation in different traits exists (i.e. sex expression, growth habit, maturity and fruit shape, size, colour and surface texture), morphological characterization serves as a significant pre-breeding step to scrutinize the genetic diversity (Behera et al., Reference Behera, Dey and Sirohi2006). However, despite the enormous benefits of morphological parameters in crop characterization, genetic identities of these germplasms are necessary for authentic identification, selection and successful crop breeding for further development of this species (Alam et al., Reference Alam, Haque and Ghosh2018).
Cytogenetics studies provide elementary information about chromosome number, type and size of individual chromosomes in addition to chromosomal abnormalities, homology and ploidy level in plant species (Peruzzi and Eroğlu, Reference Peruzzi and Eroğlu2013). Chromosome study in the genus Momordica is considered to be challenging due to the small size of chromosomes, weak staining and interference of dense cytoplasmic background (Trivedi and Roy, Reference Trivedi and Roy1972). As a consequence, adequate attention has not been paid to date to resolve the cytogenetic complexity of this important genus. There are earlier reports of cytological assessment in this genus by conventional chromosome preparation using the squashing technique (Bharathi et al., Reference Bharathi, Munshi, Chandrashekaran, Behera, Das and John2011; Kausar et al., Reference Kausar, Yousaf, Younas, Ahmed, Rashid, Arif and Rehman2014; Alam et al., Reference Alam, Haque and Ghosh2018). But to tackle the above-mentioned issues, enzymatic maceration of the cell wall to spread the chromosomes on a cytoplasm-free background is known to be very effective and has been successfully applied in this species earlier (Ghosh et al., Reference Ghosh, Bhowmick and Jha2018). Hitherto, detailed karyomorphological analysis of the Indian genotypes of M. charantia is still negligible. On the other hand, meiosis and pollen grain plays the most crucial role in plant breeding by shuffling the genome in crossing over events to form genetic variables among offspring (Wang et al., Reference Wang, van Rengs, Zaidan and Underwood2021). Analysis of the meiotic chromosome behaviour and pollen viability in the Indian cultivars of M. charantia is thus very important to understand their karyotype data to assess their reproductive success and breeding capacity.
In the present investigation, thus, details of comparative karyological analysis by the enzymatic maceration and air-drying (EMA)-based Giemsa staining method using 12 Indian accession of M. charantia have been standardized. In addition to that, meiotic behaviour and interrelationship of the accessions based on the morphological and karyomorphological parameters have been established, which will be beneficial in cytotaxonomy, breeding and crop management.
Materials and methods
Collection of plant materials
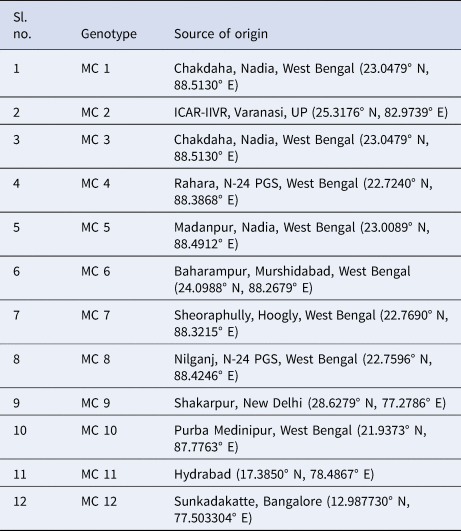
Bitter gourd seeds from diverse regions of India have been collected and planted in the medicinal field located on the institution campus (22.7240° N, 88.3868° E) (Table 1). These accessions were identified at the Central National Herbarium (CNH), Botanical Survey of India (BSI), Howrah, West Bengal, using accession number CNH/Tech.II/2022/80.
Table 1. Collection of bitter gourd genotypes from different regions of India
Prime DUS characters of the studied accessions of M. charantia
Fifty seeds of each accession were planted in clay sandy loam soil in the medicinal field. After attaining a proper stage, different morphological parameters of the plants have been documented. Qualitative and quantitative characters of vegetative and reproductive parts were analysed. The fruits were harvested at the marketable stage and morphological parameters were recorded. The field experiments were carried out during the spring–summer period, specifically from February to May 2023. All accessions were assessed for 18 key DUS (distinctness, uniformity and stability) characteristics at a designated stage of crop growth. This evaluation was conducted in accordance with the National DUS test guideline descriptors for bitter gourd outlined in the PPV & FR Act (2001), ensuring that the characters under study were fully expressed. Data were meticulously recorded from 10 randomly selected plants within each replicate and are presented in Tables S2 and S3 (online Supplementary materials).
Preparation of somatic chromosome through EMA-based Giemsa staining methods
Actively growing root tip (about 0.5 cm) of germinated seeds of each accession was excised and pretreated with 8-hydroxyquinoline (2 mM) at 16°C for 6 h, followed by fixation in Carnoy's fixative (aceto–ethanol 1:3 v/v). Enzymatic maceration of the cell wall has been performed following Santra et al. (Reference Santra, Halder and Ghosh2022) with minor modification. Root tips were washed and suspended in an enzyme cocktail containing 1.5% cellulose (Onuzuka RS), 0.5% macerozyme, 0.15% pectolyase y23, 1.5% pectinase and 1 mM EDTA (pH 4.2) for 45 min at 37°C. The treated roots were washed and spread on a clean slide with a drop of freshly prepared fixative. The slide was air dried for 24 h and stained with 2% Giemsa solution. Well-spread metaphase plates were observed under a Zeiss Scope A1 microscope and photomicrographs were taken with an attached camera Zeiss Axio Cam ICc5.
Karyomorphology analysis of mitotic chromosomes
For the karyomorphology analysis, each accession's 10 best metaphase plates were studied. Individual chromosomes were measured with the help of Zeiss software Axio Vision. The chromosomes were arranged into different categories followed by Levan et al. (Reference Levan, Fredga and Sandberg1964) and ideograms were constructed. A compressive investigation of intra- and inter-chromosomal asymmetry and symmetry was accomplished using 10 standard indices. The asymmetry index (AI) has been evaluated following Eroğlu (Reference Eroğlu2015).
Statistical analysis and intraspecific relationship
A cluster analysis was done using four numerical parameters, total chromatin length (TCL), mean centromeric asymmetry (MCA), A, AI, S/AI and AsK% of chromosomes of each accession. The numerical parameters standardized the data matrix and made an unweighted pair group method with arithmetic mean (UPGMA) dendrogram based on average Euclidean distance using PAST3 2019 software (Version 1.0.0.0). Additionally, the influence of the above-mentioned karyo-analytical parameters on chromosomal relations between the accessions was evaluated by principal component analysis (PCA) using the same software, PAST3 2019 (Version 1.0.0.0).
Preparation of meiotic chromosomes
Meiotic chromosomes were prepared following Santra et al. (Reference Santra, Halder and Ghosh2022). Unisexual young male buds of the appropriate size were taken from each accession and fixed in the Carnoy's fixative at 4°C until use. Anthers were then removed and squashed with 2% aceto-carmine stain.
Pollen viability test
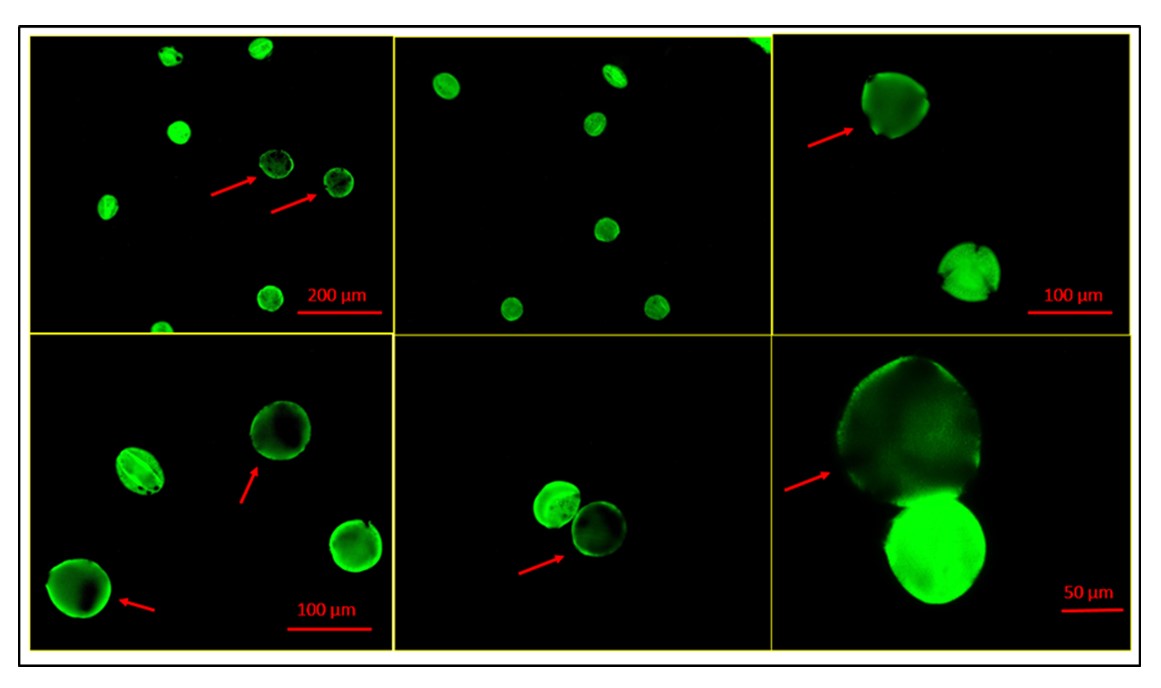
Pollen viability assay has been carried out with fluorescent staining fluorescein diacetate (FDA) following Heslop-Harrison and Heslop-Harrison (Reference Heslop-Harrison and Heslop-Harrison1970). In a centrifuge tube, two to three anthers at the appropriate stage were squeezed to release the pollen. The released pollen was incubated for 10 min at room temperature in a solution containing 0.5 M sucrose and 2.0 μg/mL FDA. Pollen viability was observed under a Zeiss Axio Scope A1 fluorescence microscope. Photomicrographs were taken by using Zeiss AxioCam during the observation.
Results
Prime DUS characters of the studied accessions of M. charantia
The present study has revealed a significant range of phenotypic variability among the bitter gourd accessions. A comprehensive morphological analysis of each accession is discussed below.
Vegetative morphological traits
In the study of 12 different bitter gourd accessions, we examined four qualitative and five quantitative vegetative morphological traits (Table S2, online Supplementary materials). Notably, the quantitative characteristics displayed substantial variation across accessions, with internode length and leaf blade size standing out. The highest length of internode was recorded in MC 9 and MC 11 (11.4 ± 1.20 and 11.4 ± 1.85 cm, respectively), while it is lowest in MC 3 (4.16 ± 0.29 cm). The leaf characters of 12 accessions were analysed based on their number of lobes, depth of lobe, type of margins, shape and size of the leaf blade and petiole length (Table S2, online Supplementary materials). All the accessions represent seven lobed leaves. The shape of the leaves of eight accessions had reniform, and four accessions had cordate. The leaves having short leaf blades (<6 cm), medium length (>6–9 cm) and long (>9 cm) types of leaf blades were found. The highest blade length observed in MC 11 was 13.6 ± 1.5 cm, and the width was 11 ± 0.89 cm, the lowest length was 4.40 ± 0.374 cm in MC 2 and the lowest width in MC 1 was 5 ± 0.63 cm. Only one accession (MC 9) showed a multifid type of margin, while all the remaining accessions showed a serrate type of margin. The shortest petiole length (1.74 ± 0.22 cm) was found in MC 2, and the longest (6.5 ± 0.58 cm) was found in MC 4.
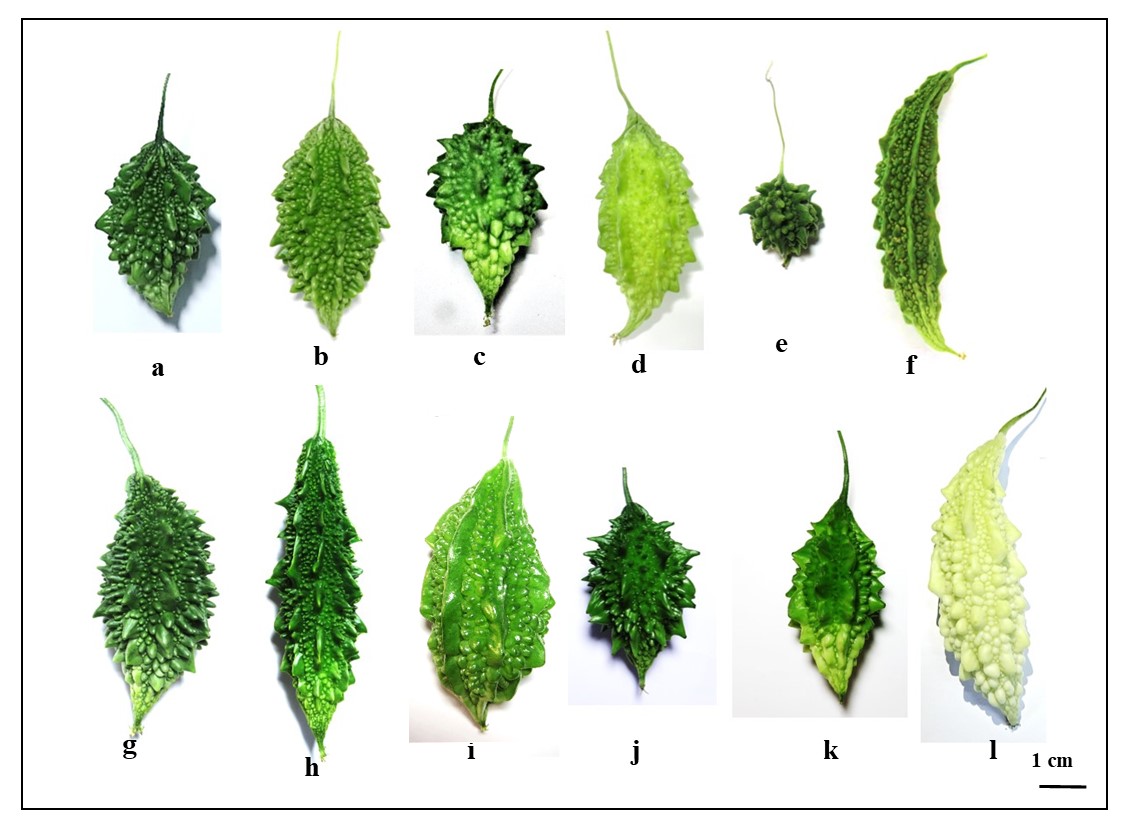
Reproductive morphological traits
Nine different reproductive traits were taken to distinguish the bitter gourd accessions and presented in Table S3 (online Supplementary materials). In the flower traits, two types of petal colours were observed, one is pale yellow and another one is bright yellow. The pedicel length ranges from 3.5 ± 0.35 to 10.2 ± 0.50 cm. The highest pedicel length was 10.2 ± 0.50 cm, found in MC 9. All the accessions showed monoecious except for MC 5, which was gynoecious. Two types of the ovary of bitter gourd accessions were found based on length; one was short (1.5–2.5 cm) type and another was long (>2.5 cm) type. The fruit morphology encompassed the assessment of six fruit attributes, comprising three qualitative and three quantitative characteristics. Distinct coloration was observed at two distinct fruit development stages. The first stage, referred to as marketable maturity, exhibited fruits with hues ranging from light green, green, dark green, to whitish green (Fig. S2, online Supplementary materials). In contrast, the ripening stage featured fruits displaying shades of yellow and dark orange. In the study of fruit texture, continuous and discontinuous ridges were found. Variations in shapes, sizes and number of ridges and tubercles were also observed. Three types of fruit length and width were found: small, medium and long. The length of the fruit ranges from 5.90 ± 0.35 cm (MC 5) to 17.00 ± 1.8 cm (MC 4). The diameter of the fruit ranges from 3.58 ± 0.29 to 15.9 ± 1.30 cm. The maximum number of tubercles was found in MC 5 accession, and the lowest was seen in MC 1 accession. The variation in fruit shapes, i.e. obtuse, acute, oblong and spindle, was also observed in bitter gourd (Fig. S2 and Table S3; online Supplementary materials).
Karyomorphometric analysis of mitotic chromosomes
In the present study all the accessions of M. charantia possesses 2n = 22 chromosomes in the somatic cells (Fig. 1) Chromosomes are predominantly metacentric, while in some accessions (MC 1, MC 4, MC 5, MC 6, MC 9 and MC 11) several sub-metacentric chromosomes have also been observed. The number of sub-metacentric chromosomes varied from two to six in different accessions (Fig. 2). The chromosomes are small and the average length of the chromosomes ranges from 0.83 to 1.93 μm among the studied accessions. The highest size (large–small) difference among the chromosomes was observed in accession MC 9. Among the examined accessions, the MC 4 accession exhibited the highest value for TCL at 15.94 μm, along with the longest chromosome measuring 1.93 μm. Conversely, the MC 1 accession demonstrated the lowest values for these parameters, with a TCL of 11.44 μm and the smallest chromosome length of 0.83 μm (Table 2). Based on the karyomorphological data, different symmetry/asymmetry indices were used to determine cytotaxonomy within the studied accessions. The manner of asymmetry tendency is higher with the increased value of AsK%, A and MCA. On the other hand, these matrices negatively correlate with the Syi index and total forma percentage (TF%). Accession MC 11 showed a tendency of relatively more asymmetric with a higher value of AsK% and lower value of Syi index and TF%. In contrast, a higher value of the Syi index and TF% in the MC 10 accession indicates the presence of a relatively more symmetrical and primitive karyotype in this species.
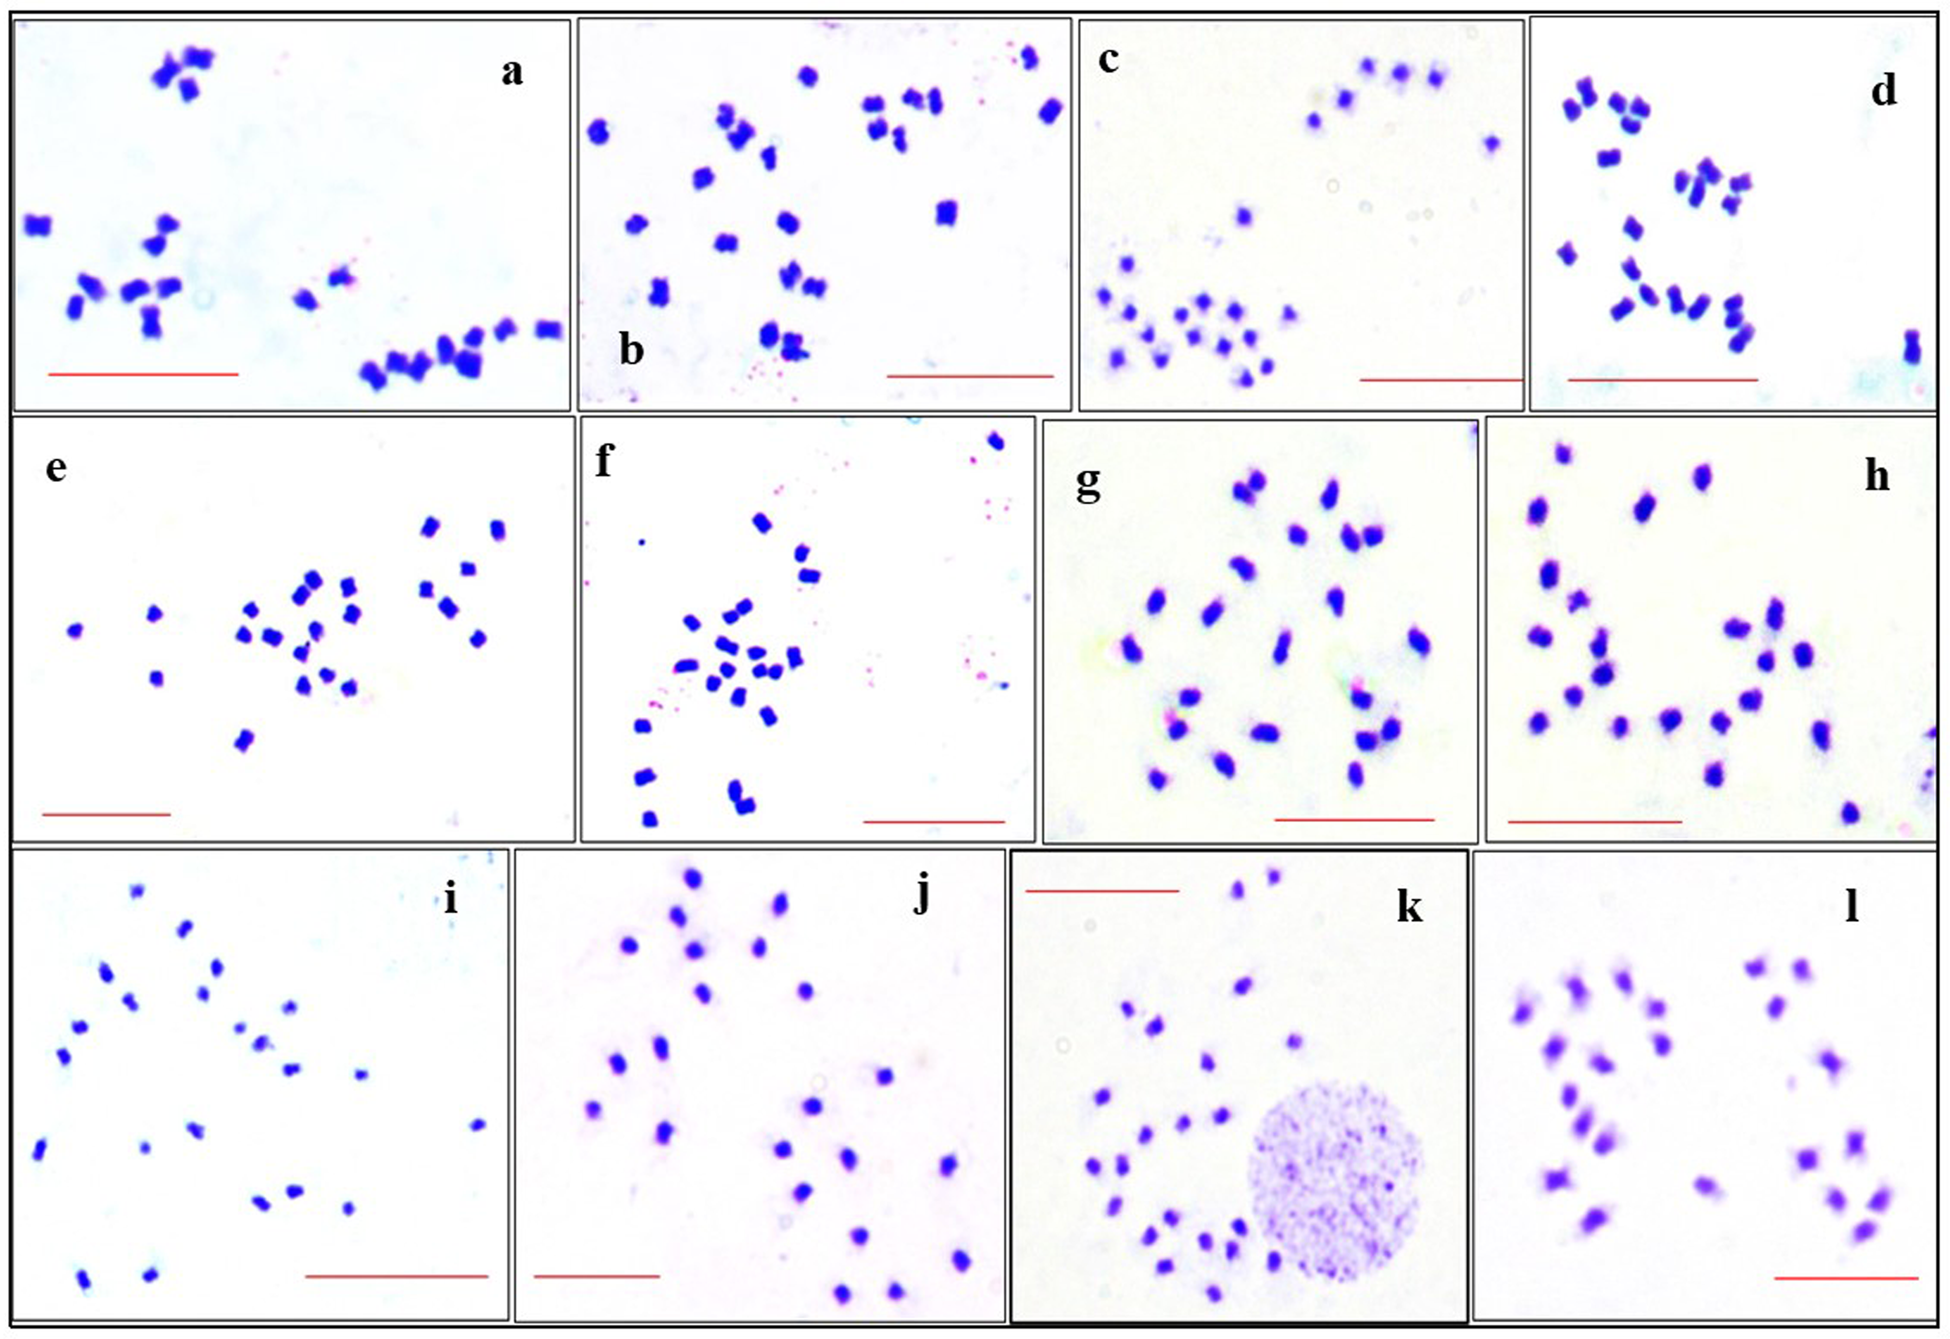
Figure 1. Mitotic metaphase plate showing 2n = 22 number of chromosomes of M. charantia by the EMA method: (a) MC 1; (b) MC 2; (c) MC 3; (d) MC 4; (e) MC 5; (f) MC 6; (g) MC 7; (h) MC 8; (i) MC 9; (j) MC 10; (k) MC 11; (l) MC 12. Scale bar represents 10 μm.
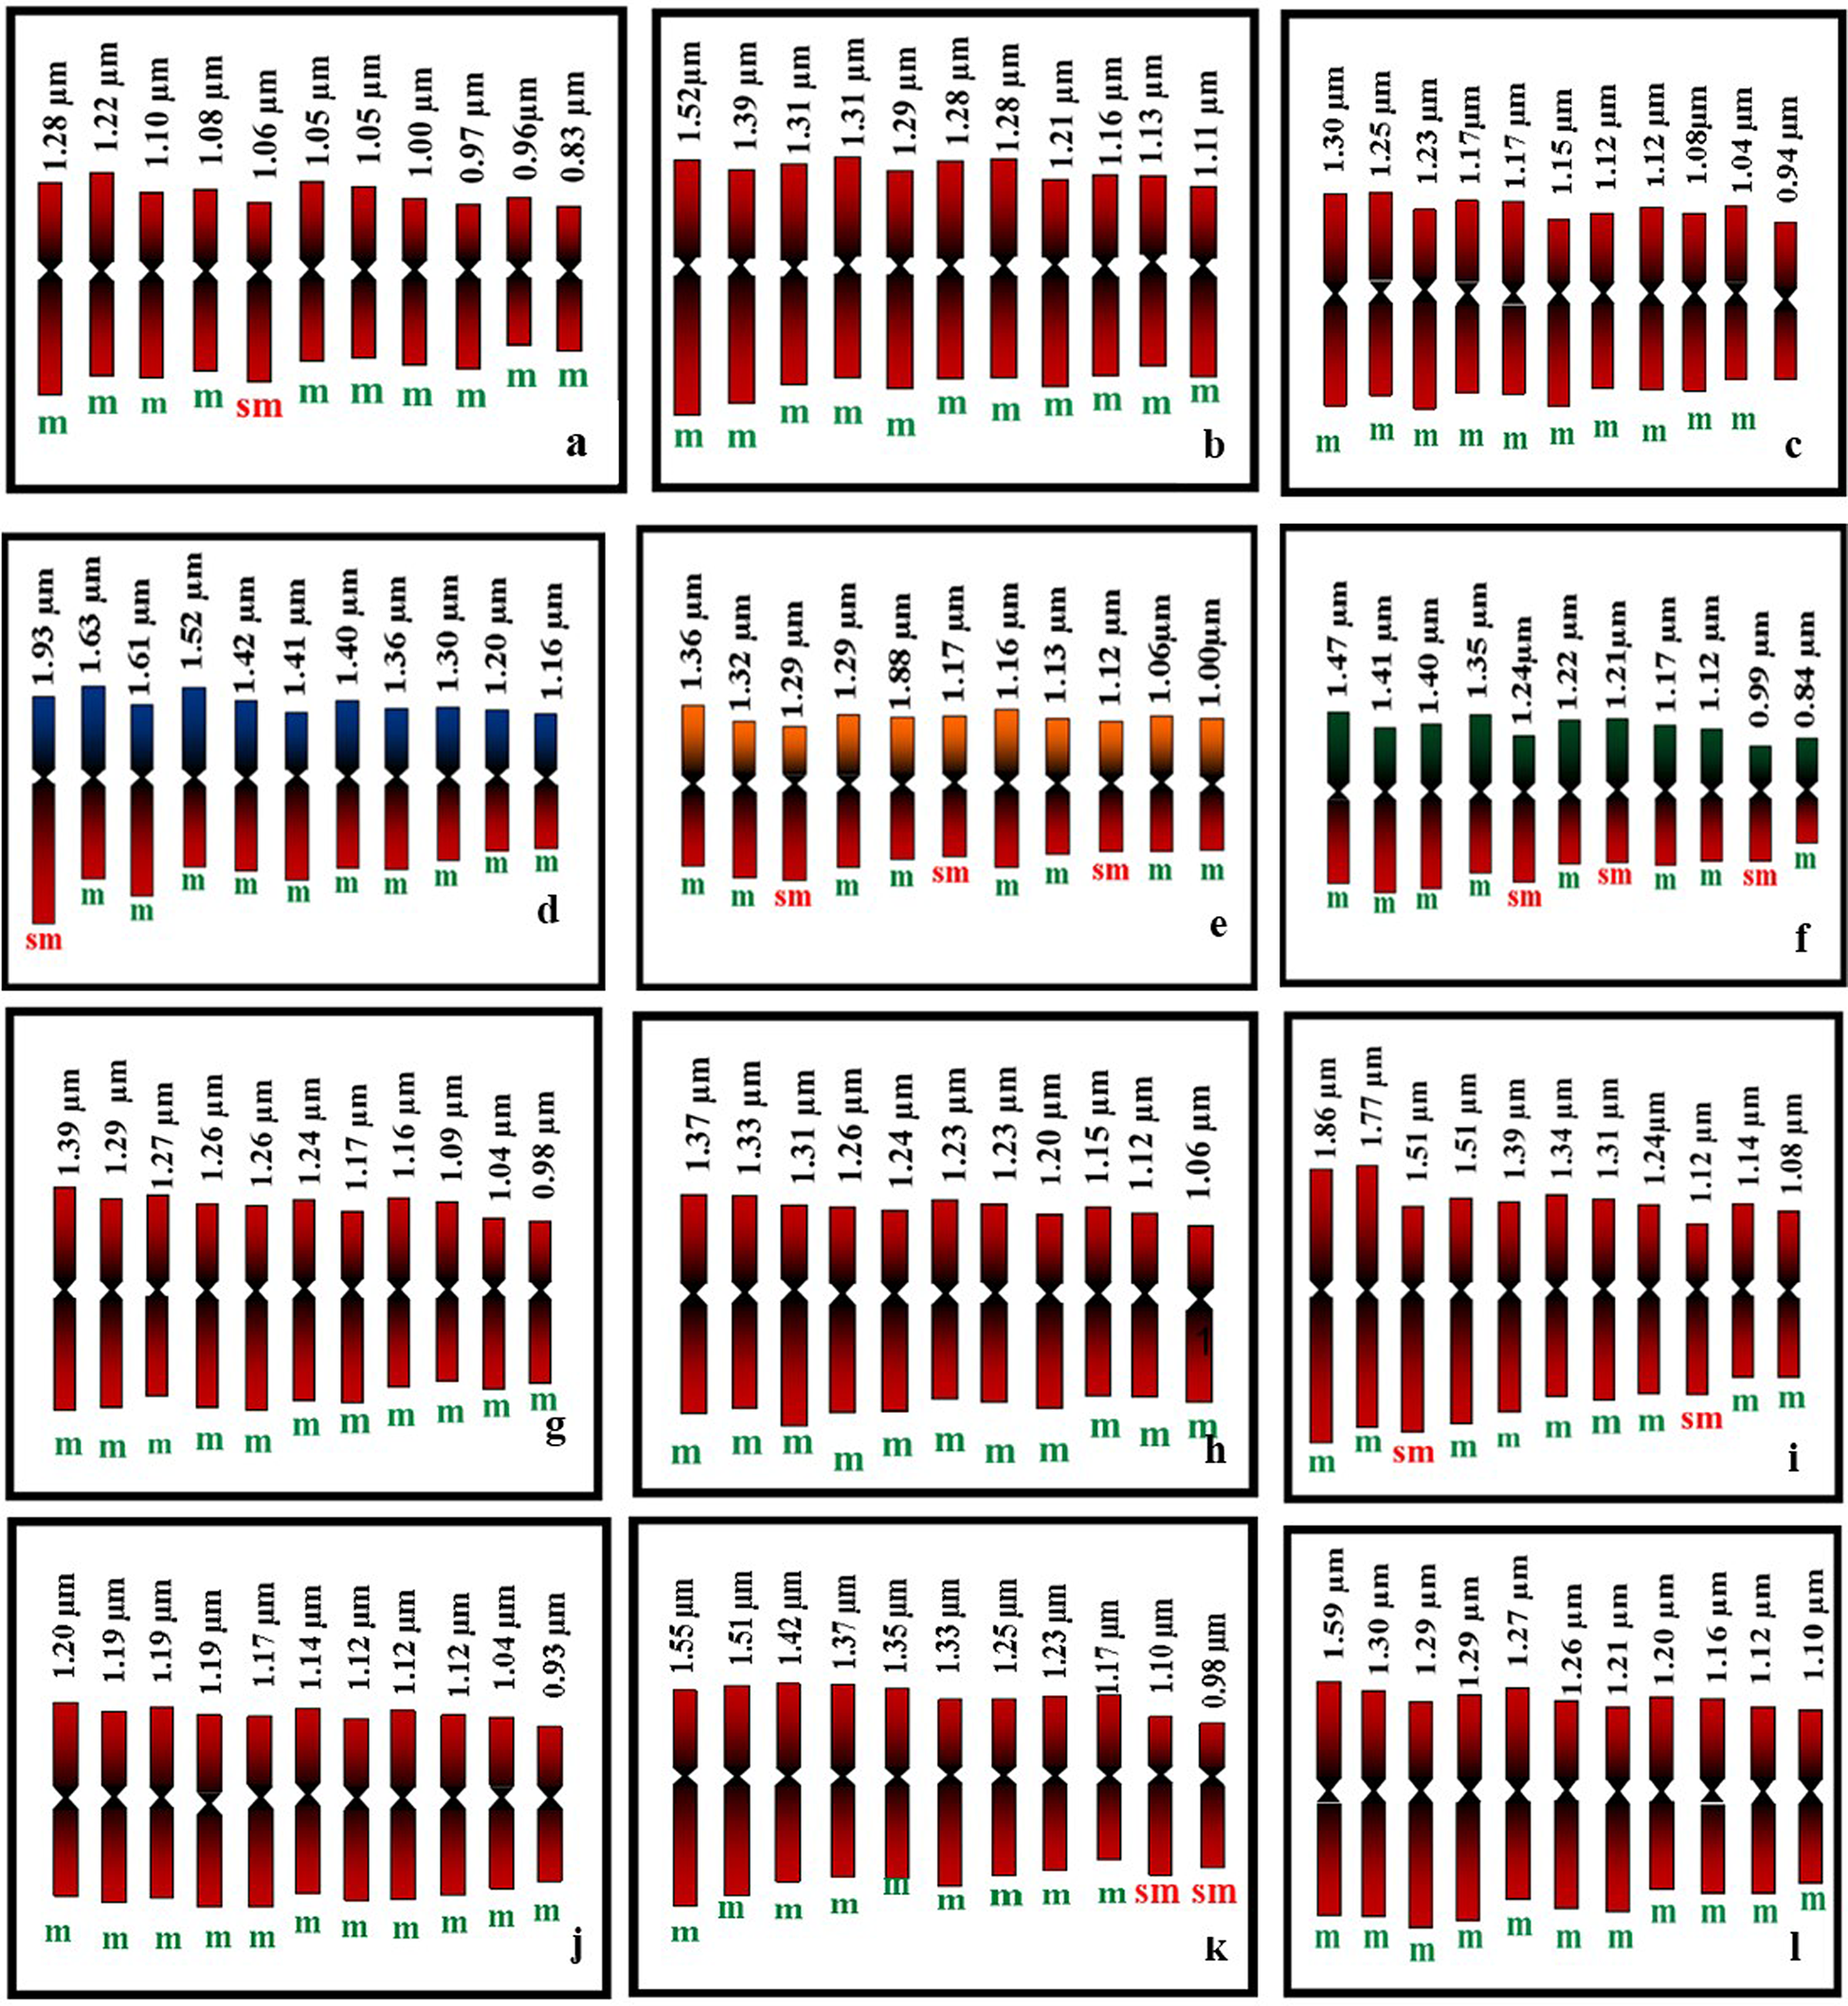
Figure 2. Diagrammatic representation of mitotic metaphase chromosomes of M. charantia: (a) MC 1; (b) MC 2; (c) MC 3; (d) MC 4; (e) MC 5; (f) MC 6; (g) MC 7; (h) MC 8; (i) MC 9; (j) MC 10; (k) MC 11; (l) MC 12.
Table 2. Comparative karyomorphological details of 12 Indian genotypes of M. charantia
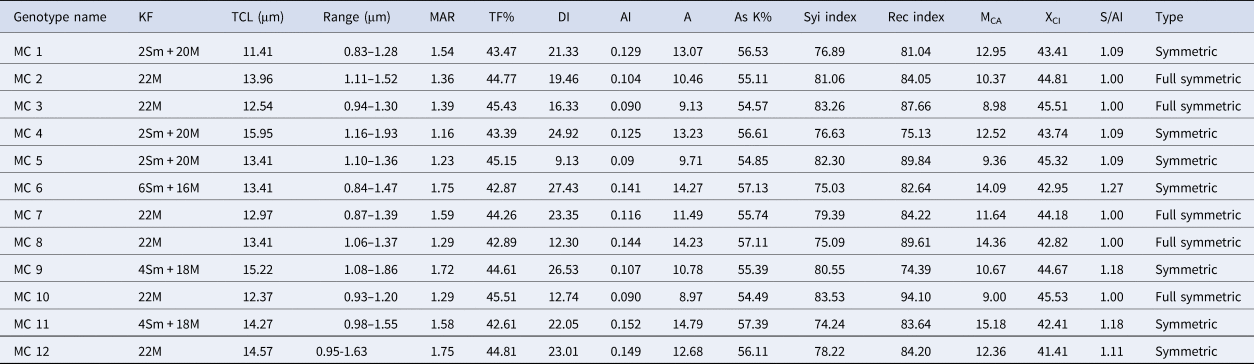
KF, karyotypic formula; TCL, total chromosomal length; Range, range of chromosome length from smallest to largest; MAR, mean arm ratio; TF%, total forma percentage; DI, dispersion index; AI, asymmetry index; A, degree of karyotype asymmetry; AsK%, Arano index of karyotype asymmetry; MCA, mean centromeric asymmetry; XCI, mean centromeric index; S/Ai, symmetry or asymmetry index; Type, symmetry or asymmetry type according to Eroğlu (Reference Eroğlu2015).
Study of meiotic chromosomes
Within the anthers of early male buds undergoing meiosis, there are observable stages of chromosome division. Across all studied accessions, a consistent pattern of 11 pairs at diakinesis-metaphase I indicates a regular meiotic behaviour (Fig. 3). The dense cytoplasm within the pollen mother cells (PMCs) at the diakinesis stage hinders precise determination of chiasma frequency despite observing terminalization and bivalent association near the nucleolus. As the process progresses to the late diakinesis stage, the nucleolus gradually diminishes in size, initiating chromosome condensation. The onset of anaphase I is characterized by the orderly separation of 11 bivalents into two opposite poles (Fig. 3). This separation occurred regularly and without any anomalies during the process of chromosome segregation.
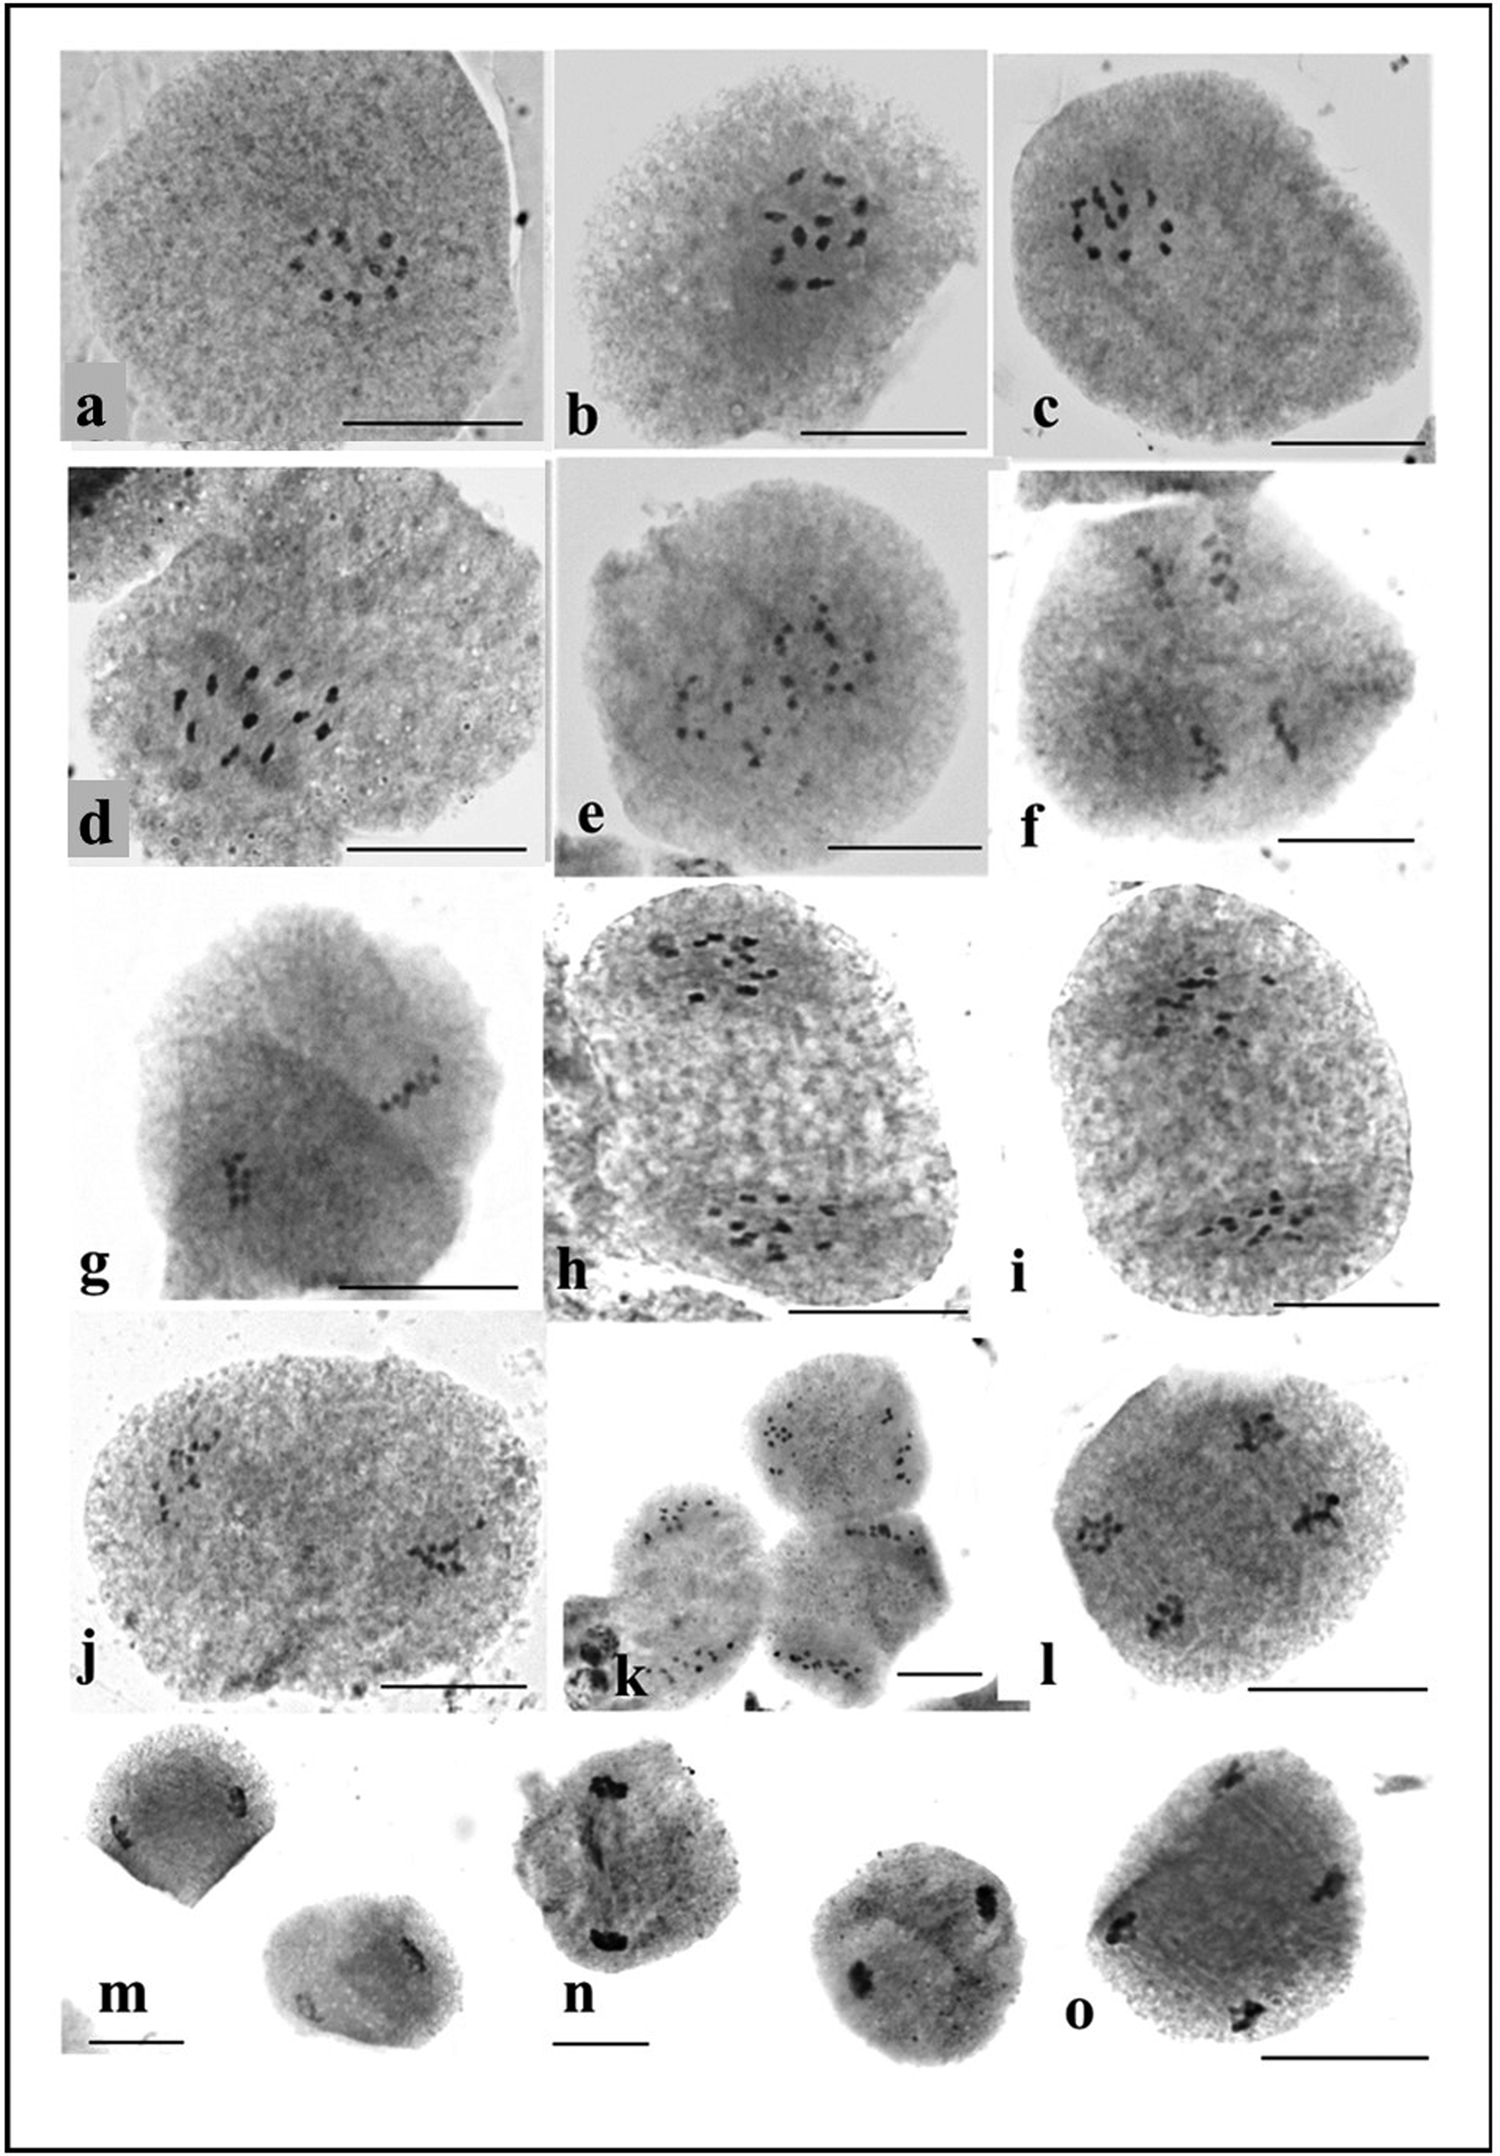
Figure 3. Study of meiotic chromosomes in M. charantia: (a) diakinesis; (b–d) metaphase I; (e–f) metaphase II; (g–j) anaphase I; (k–l) anaphase II; (m–n) telophase I; (o) telophase II.
Karyoevolutionary relationship within the accessions based on UPGMA and PCA plots
Karyological relationships among the 12 accessions of M. charantia were determined by multivariate ordination and clustering with PCA and constructing the UPGMA dendrogram, respectively. The constructed dendrogram (Fig. 4) based on karyomorphometric parameters revealed two distinct clusters at the Euclidean distance of 1.95 and 1.85 with a cophenetic correlation of 0.780. Each cluster formed four sub-clusters. The first principal cluster consisted of the two sub-clusters. Accessions MC 2 and MC 3 and MC 10 and MC 11 formed together a sub-cluster, and accessions MC 7 and MC 4 solely represent another two sub-clusters. At the same time, the second principal cluster comprised of three sub-clusters. Accessions MC 5 and MC 1 formed a sub-cluster, and accession MC 8 exclusively constituted a sub-cluster. Accessions MC 6 and MC 9 included another sub-cluster.
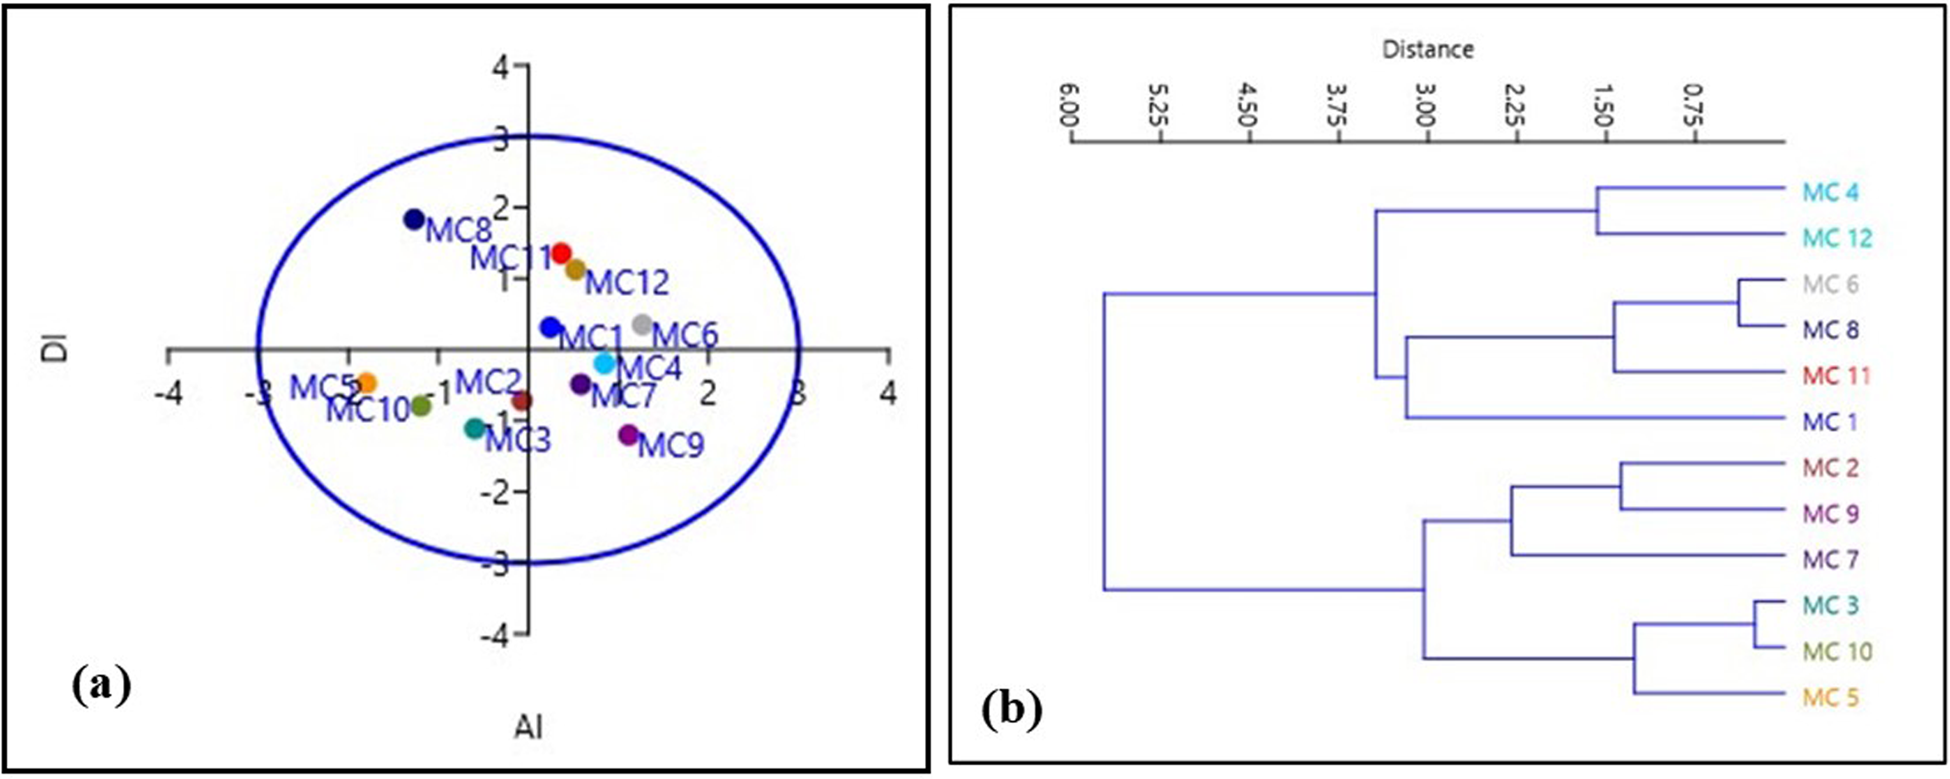
Figure 4. (a) PCA and (b) UPGMA dendrogram of 12 bitter gourd accessions showing distribution and similarity based on karyomorphological study.
Besides a substantial clustering analysis, PCA was applied to the taxonomic relationship in this study. PCA and cluster analysis established the implication of karyomorphometric research in determining the intraspecific relationship among the different accessions. The PCA showed that the first principal component accounted for 80.70%, and the second principal component accounted for 16.49% of the chromosomal variance among the accessions (Fig. 4). Thus, it can be concluded that the intraspecific variations in M. charantia may be due to the changes in chromosome morphology due to the synthetic assortment of some features. Furthermore, the multivariate chromosomal study suggests that relatively close clustering individuals promoted chromosomal closeness among the 12 accessions. The relatively distant positioning of individuals advocated higher karyoevolutionary affinity, which might be due to their differences in genetic structure. So, multivariate karyomorphometric analyses build a strong base for intraspecific phylogenetic relationships in M. charantia populations and are also helpful for the comparative cytogenetic study of this species. However, it can be improved with the chemotype, ecotypic, phenotypical and genetic studies in the coming days.
Pollen viability
Pollen viability determination is an easy method to select suitable pollinators in the breeding programme. The result of the pollen viability test is shown in Table S1 and Fig. S1 (online Supplementary materials). The bitter gourd accessions exhibited differences in pollen viability. Accession MC 7 had the highest pollen viability (94.11%) and the lowest (89.41%) viable pollen found in accession MC 1. In the present study, the percentage of pollen viability of all the studied accessions was very high (89.41–94.11%), and these accessions can be considered good pollinators.
Discussion
In this study, karyotype characteristics of 12 accessions of M. charantia, predominantly gathered from West Bengal and several other states of India, were examined along with their prime DUS characters. All the accessions were morphologically diverse and showed a high degree of variations in the same growing environment. The outcomes suggest that the morphological parameters used in this study, effectively differentiated between the bitter gourd accessions gathered from various locations. The diverse morphological traits of bitter gourd, encompassing features like leaf characteristics, sex expression, maturity and the shape, size, colour and surface texture of the fruit. These collectively contribute to a wide range of phenotypic variation. Notably, similar findings were noted earlier in bitter gourd, indicating a parallel spectrum of phenotypic traits among the genotypes investigated (Dey et al., Reference Dey, Behera, Munshi and Sirohi2007; Dalamu et al., Reference Dalamu, Behera, Gaikwad, Saxena, Bharadwaj and Munshi2012). Chromosome analysis, however, offers significant advantages in identifying heterogeneity and genetic relationships among plants. It holds particular importance in determining taxonomic units and conducting phylogenetic research (Zhang et al., Reference Zhang, Zhu and Dai2013). The present study employed a combination of enzymatic cell wall digestion and subsequent Giemsa staining, resulting in well-separated chromosomes with minimal overlap and a background free of cytoplasmic interference. The accessions gathered from various regions of India, notably West Bengal, uniformly exhibit a somatic cell chromosome count of 2n = 22 which confirms previous reports by Lombello and Pinto-Maglio (Reference Lombello and Pinto–Maglio2007); Zaman and Alam (Reference Zaman and Alam2009) and Ghosh et al. (Reference Ghosh, Bhowmick and Jha2018). The diploid chromosome count seen in all cultivars remained constant, indicating that significant changes in chromosome numbers, like dysploidy, are not widespread within this species. It was noted that while all 12 studied accessions share the same somatic chromosome number (2n = 22), they significantly vary in chromosome morphology and TCL. The lowest length was observed in MC 1 (11.41 μm), whereas the highest was found in MC 4 (15.95 μm). The variations in experimental results might yield intraspecific C-value differences. Such C-value variations could also correlate with eco-geographic factors, indicating that the differences are adaptive. This could potentially signify instances of incipient speciation, as suggested by Murray in Reference Murray2005. Variations in chromosome size between accessions were observed; the largest chromosome (1.93 μm) presented more than double the chromosome size in relation to the smallest chromosome (0.83 μm). Earlier report suggested that the chromosomes of the M. charantia are mostly metacentric (Ghosh et al., Reference Ghosh, Bhowmick and Jha2018, Reference Ghosh, Saha, Bhowmick and Jha2021). In the current study, most accessions also exhibited metacentric chromosomes, although a few accessions displayed a variety of sub-median primary constrictions. The transition from median to sub-median chromosomes in MC 6, MC 9 and MC 11, as opposed to the other studied accessions, could be linked to chromosome breakage and subsequent reunion events during the course of evolution. These occurrences might have played a role in stabilizing these vegetatively propagated plants. Consistent with our findings, prior reports have documented karyotype variations within this species collected from Bangladesh (Zaman and Alam, Reference Zaman and Alam2009). Furthermore, Kausar et al. (Reference Kausar, Yousaf, Younas, Ahmed, Rashid, Arif and Rehman2014) documented intraspecific variations in karyotypes among 30 accessions from Southeast Asian nations. In certain cases, closely related species may exhibit limited disparities in their karyotypes, despite displaying clear distinctions in external morphology. In such scenarios, there is a requirement to discern elusive differences among closely related karyotypes that fall within the same class of karyotype asymmetry. This differentiation is essential for establishing evolutionary affinities between these studied accessions.
The investigation of karyotype asymmetry involved an examination of seven intra-chromosomal indices (mean arm ratio [MAR], AsK%, Syi index, A, AI, MCA and XCI) and four inter-chromosomal indices (Rec index, dispersion index [DI], TCL and karyotypic formula [KF]) summarized in Table 2. Indeed, all the indices demonstrate an upward trend with an increase in asymmetry and exhibit a decline with decreasing karyotype asymmetry. The TF%, Syi Index, Rec index and AsK% contribute to the understanding of the ‘concept of karyotype’, while the DI holds specific significance in distinguishing closely related karyotypes within the same group of karyotypes (Patel et al., Reference Patel, Dehery, Jena, Pradhan and Das2023). In accession ‘MC 10’, the intra-chromosomal indices, including ‘MAR’, ‘AsK%’ (karyotype asymmetry index), ‘A1’ (intra-chromosomal asymmetry index), ‘A’ (degree of asymmetry) and ‘MCA’, were observed to be the lowest (Table 2). In accessions ‘MC 10’, ‘MAR’, ‘AsK%’, ‘A1’ and ‘A’ exhibited the highest values. The centromere is consistently positioned in a similar manner across all chromosomes of accession ‘MC 10’ and exhibits a more random distribution in the chromosomes of accession ‘MC 11’. The chromosome complements of ‘MC 6’ demonstrated remarkably high size variation, as indicated by the inter-chromosomal index ‘DI’ (index of chromosome size resemblance), whereas ‘MC 5’ exhibited low size variation, as reflected by its ‘DI’ (Table 2).
The comparison of asymmetry in all karyotypes was conducted through a pair of indices – one intra-chromosomal and another inter-chromosomal index – visualized in a scatter plot. The scatter plot was employed to provide a comparative visualization of karyotype asymmetry among the different accessions, allowing for a comprehensive understanding of their relative asymmetry profiles. The results obtained from the Syi vs Rec index comparison aligned with the negative criticism reported by Paszko (Reference Paszko2006). Consequently, these indices were excluded from the discussion in the context of this study. The asymmetry in all karyotypes was graphically represented, and the resulting comparative illustration of karyotype asymmetry among the accessions was presented in Fig. 4. In the scatter plots, the plot corresponding to the value of the inter-chromosomal index (DI) on the horizontal axis and the intra-chromosomal index (AI) on the vertical axis represents the relative asymmetry of the karyotype in comparison to another. The analysis of the scatter plots unequivocally indicates that the karyotypes of accessions ‘MC 6’, ‘MC 9’ and ‘MC 11’ were the most asymmetric, whereas those of accessions ‘MC 10’, ‘MC 8’ and ‘MC 3’ were the most symmetric (Fig. 2). We also observed specific chromosomes with higher arm ratios judging by the determination of centromere positions moving towards an asymmetric system. However, our results added overall symmetry habitat and might be indicated a stable and conserved karyotype in M. charantia.
The current study has detailed the meiotic behaviour of these 12 accessions, aside from their karyotypes. Observing 11 distinct pairs of bivalents during metaphase I in PMCs affirms the presence of n = 11 in the gametes. This observation further supports earlier findings as reported in studies by Trivedi and Roy (Reference Trivedi and Roy1972) and Ghosh et al. (Reference Ghosh, Bhowmick and Jha2018). In the meiotic study, regular meiotic behaviour indicates genetic stability and a stable sexual cycle in the different accessions. Apart from meiotic study, pollen viability and germination study are good markers of the course of reproductive biology. Pollen has a crucial role in the flow of genes in plants, especially in plants that are frequently bred. The smooth progression of meiosis within pollen mother cells, characterized by consistent bivalent formation and proper cytokinesis, plays a critical role in ensuring a high proportion of viable pollen grains (Pagliarini, Reference Pagliarini2000). The percentage of pollen viability of all the studied accessions was very high (89.41–94.11%), and these accessions can be considered good pollinators. The convergence of genomics, cytogenetics, cell biology and bioinformatics represents a transformative phase in genome biology, encouraging enhanced collaboration across these disciplines (Deakin et al., Reference Deakin, Potter, O'Neill, Ruiz-Herrera, Cioffi, Eldridge, Fukui, Graves, Griffin, Grutzner, Kratochvil, Miura, Rovatsos, Srikulnath, Wapstra and Ezaz2019). In this context, the identification of individual chromosome pairs and the compilation of karyotype diversity in bitter gourd can provide valuable insights into their genetic foundations. Establishing a comprehensive chromosomal database for bitter gourd genotypes through these endeavours holds significant potential in guiding future breeding programmes. Moreover, further investigation into the phytochemical parameters, coupled with the exploration of morphological and genetic markers, is imperative for unlocking the full potential of bitter gourd varieties.
Conclusion
The present study focused on evaluating the genotypic variations within bitter gourd accessions using cytogenetical analysis. The prime morphological features (DUS characters) have also been recorded for the studied accessions. The results of this study revealed a remarkable diversity within studied bitter gourd accessions in terms of cytological traits. The data, obtained from chromosomal analysis, clearly indicated the presence of polymorphisms among these accessions. UPGMA and PCA analysis of different studies revealed the relationship between species and varieties during evolution. The results obtained will guide characterizing the elite genotype, genotype management and designing effective breeding and crop improvement programmes. This study is helpful to domestication, propagation, breeding techniques and conservation of bitter gourd genotypes.
Supplementary material
The supplementary material for this article can be found at https://doi.org/10.1017/S147926212400025X.
Acknowledgements
M. M. A. and I. S. acknowledge the Government of West Bengal for providing the Swami Vivekananda Merit Cum Means Scholarship. All the authors acknowledge Swami Kamalasthananda, Principal, Ramakrishna Mission Vivekananda Centenary College, Rahara, Kolkata, India for the facilities provided for this study.