


Introduction
Negative stain electron microscopy (NSEM) has been used extensively for characterizing lipoprotein particles [Reference Forte and Nordhausen1,Reference Guyton2], including high density lipoproteins (HDLs) [Reference Catte3]. HDLs are small six- to twelve-nanometer lipid-protein complexes that transport cholesterol and other lipids from peripheral tissue for removal, offering a protective effect against atherosclerosis and cardiovascular disease. Structurally, HDLs are composed of a phospholipid shell, neutral lipid core, and at least two copies of apolipoprotein A (Apo A) on its surface. Along with Apo A, HDL particles display a wide variety of other surface proteins from a proteome of almost 100 different proteins [Reference Davidson4]. Visualizing the location of these surface proteins and their interactions with extraneous proteins, such as ATP-binding cassette transporter A1 (ABCA1) and lecithin-cholesterol acyltransferase (LCAT), is important in uncovering the mechanisms by which HDL particles are assembled, mature, and promote cholesterol removal from cells (Figure 1).
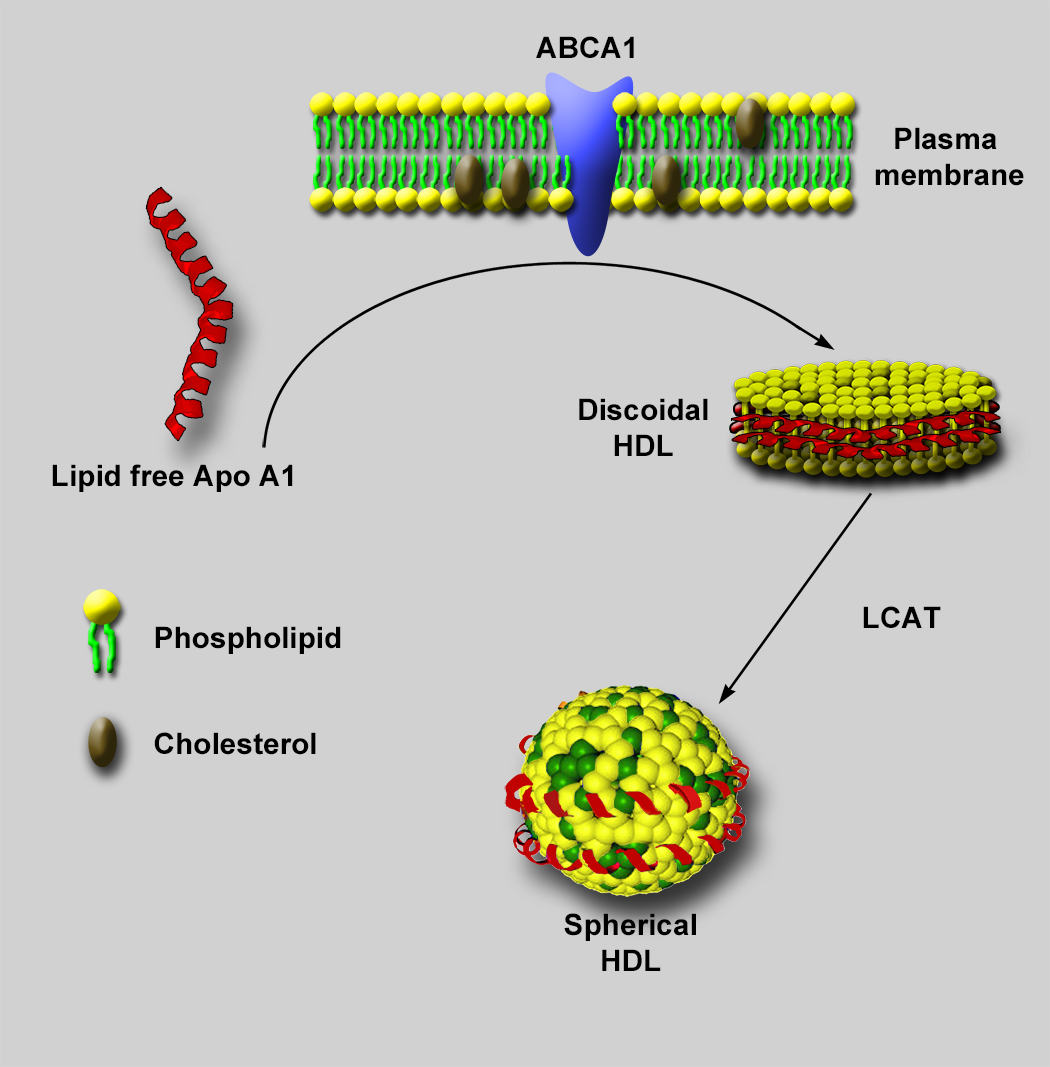
Figure 1: HDL particle assembly. Lipid-free Apo A1 freely circulating in plasma mediates the assembly of nascent discoidal HDL particles through interactions with ABCA1 at the plasma membrane of cells, leading to extraction of phospholipid and cholesterol from the plasma membrane. The extracted phospholipid and cholesterol form a bilayer with polar heads facing the aqueous environment, and Apo A1 wraps around the hydrophobic tails to shield them from the aqueous environment. A plasma enzyme known as LCAT, interacting with ApoA, then facilitates the addition of a fatty acid to the free cholesterol in the phospholipid layer. The resultant cholesteryl ester (CE) migrates from the phospholipid bilayer to the hydrophobic space between the bilayer. As more cholesterol accumulates in the hydrophobic core, the particle adds more phospholipid and becomes spherical to accommodate the increasing volume of the CE in the core of the particle. Eventually, a mature spherical particle is created.
Negative staining is a method in which the background is stained and the specimen is left unstained. Thus, in a negative stain image, the specimen appears light while the background appears dark. In conventional negative staining procedures, the sample is adhered to a substrate such as formvar on a transmission electron microscope (TEM) grid, and an electron-dense staining solution is applied. This solution typically includes a heavy metal such as tungstate or uranyl acetate. Excess stain is wicked away, leaving a build-up of stain around the edges of the particle that provides contrast during TEM imaging (Figure 2). While NSEM provides contrast along the edges of particles, conventional NSEM methods have not yielded high-resolution details on the HDL particle surface. Over the years several groups have modified traditional negative stain methods to attempt to obtain more detail. Ohi et al. highlighted the use of uranium-based stains, namely uranyl formate, and image classification methods to provide higher-resolution images of small, heterogeneous proteins [Reference Ohi5]. For imaging lipoproteins, Rames et al. developed an “optimized negative staining procedure” using uranyl formate as the negative stain. They altered several aspects of traditional negative staining methods to reduce the formation of HDL aggregates (rouleaux) and provide better particle detail [Reference Rames6]. Working from the Ohi and Rames studies, we implemented a modified uranyl formate-based negative staining procedure for visualizing and analyzing particles. This method improves overall HDL imaging and provides greater surface detail without altering particle morphology.
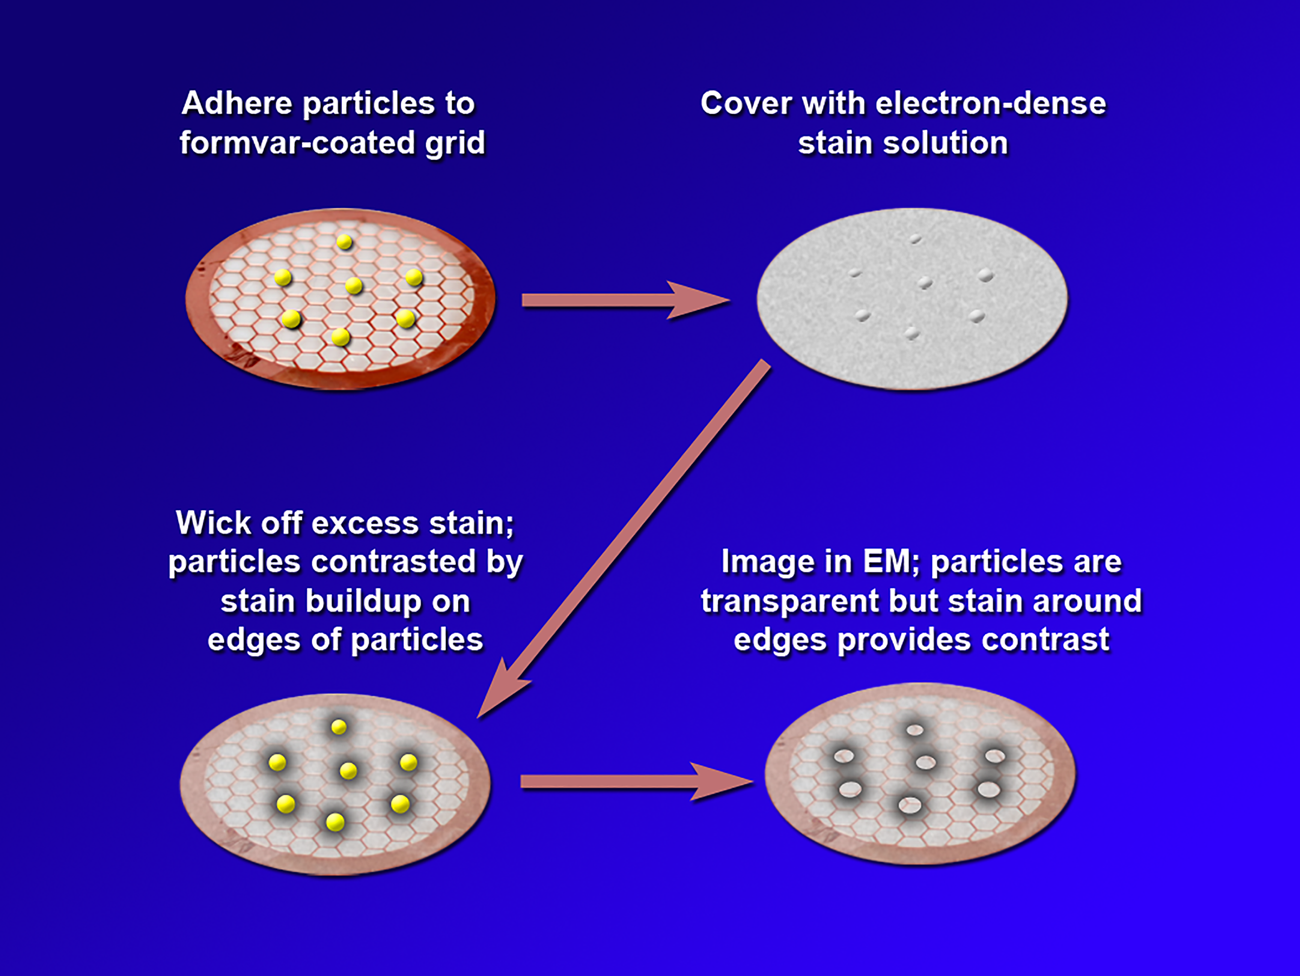
Figure 2: A depiction of the steps in conventional negative staining procedures.
Materials and Methods
HDL isolation
Human EDTA plasma was subjected to a one-step gradient density ultracentrifugation procedure. HDL fractions were collected from the bottom of the tube (density 1.063 to 1.210 g/ml). The HDL fractions were concentrated by ultrafiltration and dialyzed into standard Tris buffer [Reference Huang7].
Phosphotungstic acid negative stain electron microscopy
Before staining, dip formvar-carbon-coated copper electron microscopy grids in ethanol to make the grid surface hydrophilic. Float the grids carbon-side-down onto a 40 µl drop of HDL particles in buffer for 30 to 60 seconds. Remove excess fluid from the grids by touching the side of the grid to a wedge of filter paper. Float the grid with adsorbed particles carbon-side-down on a 40 µl droplet of 2% phosphotungstic acid stain at pH 6.0 for 60 seconds. Remove excess stain with a wedge of filter paper and allow the grids to dry before viewing with the TEM [Reference Huang7].
Preparing 0.7% uranyl formate stain
In low-light conditions, weigh 37.5 milligrams of uranyl formate (Electron Microscopy Sciences cat. #22450) into a foil-covered beaker, and add 5 ml of boiled distilled deionized water (ddH2O). Stir for five minutes and add approximately five μl of 5 M sodium hydroxide to bring the pH of the solution to ~4.5. A slight color change to a darker yellow will be observed. Stir for an additional five minutes, and filter solution through a 0.22 µm sterile syringe filter attached to a 1 ml sterile syringe into a foil-covered conical tube. It is important to keep the stain covered in foil as it is light-sensitive and can precipitate if exposed to light.
Preparing the work area for staining
Thorough but rapid application of stain and wash fluid is critical to the negative stain technique. To be able to rapidly perform the steps in the staining procedure, an organized work area for staining was prepared in advance (Figure 3). The stain station was made from two styrofoam box lids with a pipette box rack covered with parafilm placed inside the stain station. The parafilm was pressed down into the holes of the rack to create recessed areas for placing drops of water and stain during the procedure. Two different sizes of round filter paper (Whatman 90 mm grade 1 qualitative filter paper and VWR 18.5 cm grade 410 qualitative filter paper) were torn into wedges for blotting sample, water, and stain from the TEM grids during the staining procedure. The smaller wedges (Whatman 90 mm) were used for blotting excess sample and staining fluid from the grid and for storing the grid. The larger wedges (VWR 18.5 cm) were used for quickly blotting excess fluid from the water washes and the first drop of stain. Plastic petri dishes (10 cm) lined with the Whatman 90 mm filter paper were assembled for storing the stained grids at the conclusion of the staining procedure. A 15 ml conical tube was filled with ddH2O for use in the water washes during the staining procedure. Sample concentration varied according to the type of material being stained, but for HDL particles, we usually prepared a solution of between 0.01 and 0.1 mg protein per ml of diluent, typically standard Tris buffer.

Figure 3: Layout of the staining station and the materials needed for our modified negative staining procedure using uranyl formate.
Stain procedure
Formvar/carbon-coated 200-mesh copper TEM grids (Electron Microscopy China #BZ11022a) were placed onto a parafilm-covered glass slide and set inside a 100 mm glass petri dish. To make the grids more hydrophilic, they were glow discharged in a glow discharge unit (Electron Microscopy Sciences EMS100) at 25 mA current for 2 minutes at negative polarity. Immediately after glow discharging the grids, the following steps were performed as rapidly as possible:
1. A glow discharged grid was floated carbon-side-down on top of a 15–20 µl drop of sample for 10–30 seconds.
2. Excess sample was blotted away by touching the edge of the grid with a small wedge (Whatman 90 mm) of filter paper (Figure 4A).
3. The grid was quickly touched to the surface of the first drop of ddH2O (carbon-side-down) while still being held by the forceps, and then one edge of the grid was rapidly touched to a large wedge of filter paper (VWR 18.5 cm) to wick away excess ddH2O. This large wedge of filter paper was held perpendicular to the pipette tip box rack directly behind the drops of water and stain so that the edge of the grid could be rapidly but gently touched to the filter paper for each water wash and first drop of stain (Figure 4B). A thin film of water should remain on the surface of the grid to prevent the sample from drying out.
4. The grid was then quickly touched to the surface of the second drop of ddH2O (carbon-side-down) and the edge of the grid quickly touched to the large wedge of filter paper to wick away excess ddH2O.
5. Following washing, the grid was quickly touched to the surface of the first drop of 0.7% UF stain (carbon-side-down), and then the edge of the grid was quickly touched to the large wedge of filter paper.
6. The grid was then floated on top of the second drop of 0.7% UF stain (carbon-side-down) and allowed to set for 45–60 seconds. The lid to the stain station was placed over the top of the station for the duration of this final staining period.
7. The grid was removed from the drop of stain and the excess stain blotted away using a small wedge of filter paper touched to the edge of the grid. The entire procedure, from step 1 to step 7, usually takes less than three minutes.
8. The small wedge of filter paper was then inserted into the opening between the tines of the forceps, just above the grid, to wick up excess fluid and to gently guide the grid from the forceps into the filter paper-lined plastic petri dish (Figure 5). Without this step, capillary action will draw the grid up onto the forceps when the forceps are opened.
The grid was allowed to dry and was stored away from light until ready to be viewed with a Thermo Fisher Scientific (Philips/FEI) T-12 or TF20 (for LCAT-incubated particles), TEM operated at 100 kV and 200 kV, respectively. Class averages and three-dimensional reconstructions were accomplished using the RELION-3.0 software package [Reference Scheres8]. RELION is an open-source software program for performing single-particle analysis.

Figure 4: Depictions of filter paper orientations with respect to blotting TEM grids. A) Orientation of the small wedge of filter paper (Whatman 90 mm) and TEM grid as the filter paper is briefly touched to the edge of a TEM grid to blot away excess fluid. B) Holding the large wedge of filter paper (VWR 18.5 cm) perpendicular to the pipette tip box rack for quickly touching the edge of a TEM grid to the filter paper between the two water washes and after applying the first drop of stain.

Figure 5: Use of a small wedge of filter paper to wick away excess fluid and guide a TEM grid into a filter paper-lined petri dish for storage.
Results
Compared to our previous staining method (Figure 6A) using phosphotungstic acid (PTA), we saw greater surface detail and sharper particle edges on HDL preparations with our new uranyl formate procedure (Figure 6B). Size quantitation analyses of mean particle diameters were similar between the two staining methods, suggesting that our modified staining procedure does not dramatically alter particle morphology (Figures 6C and 6D).
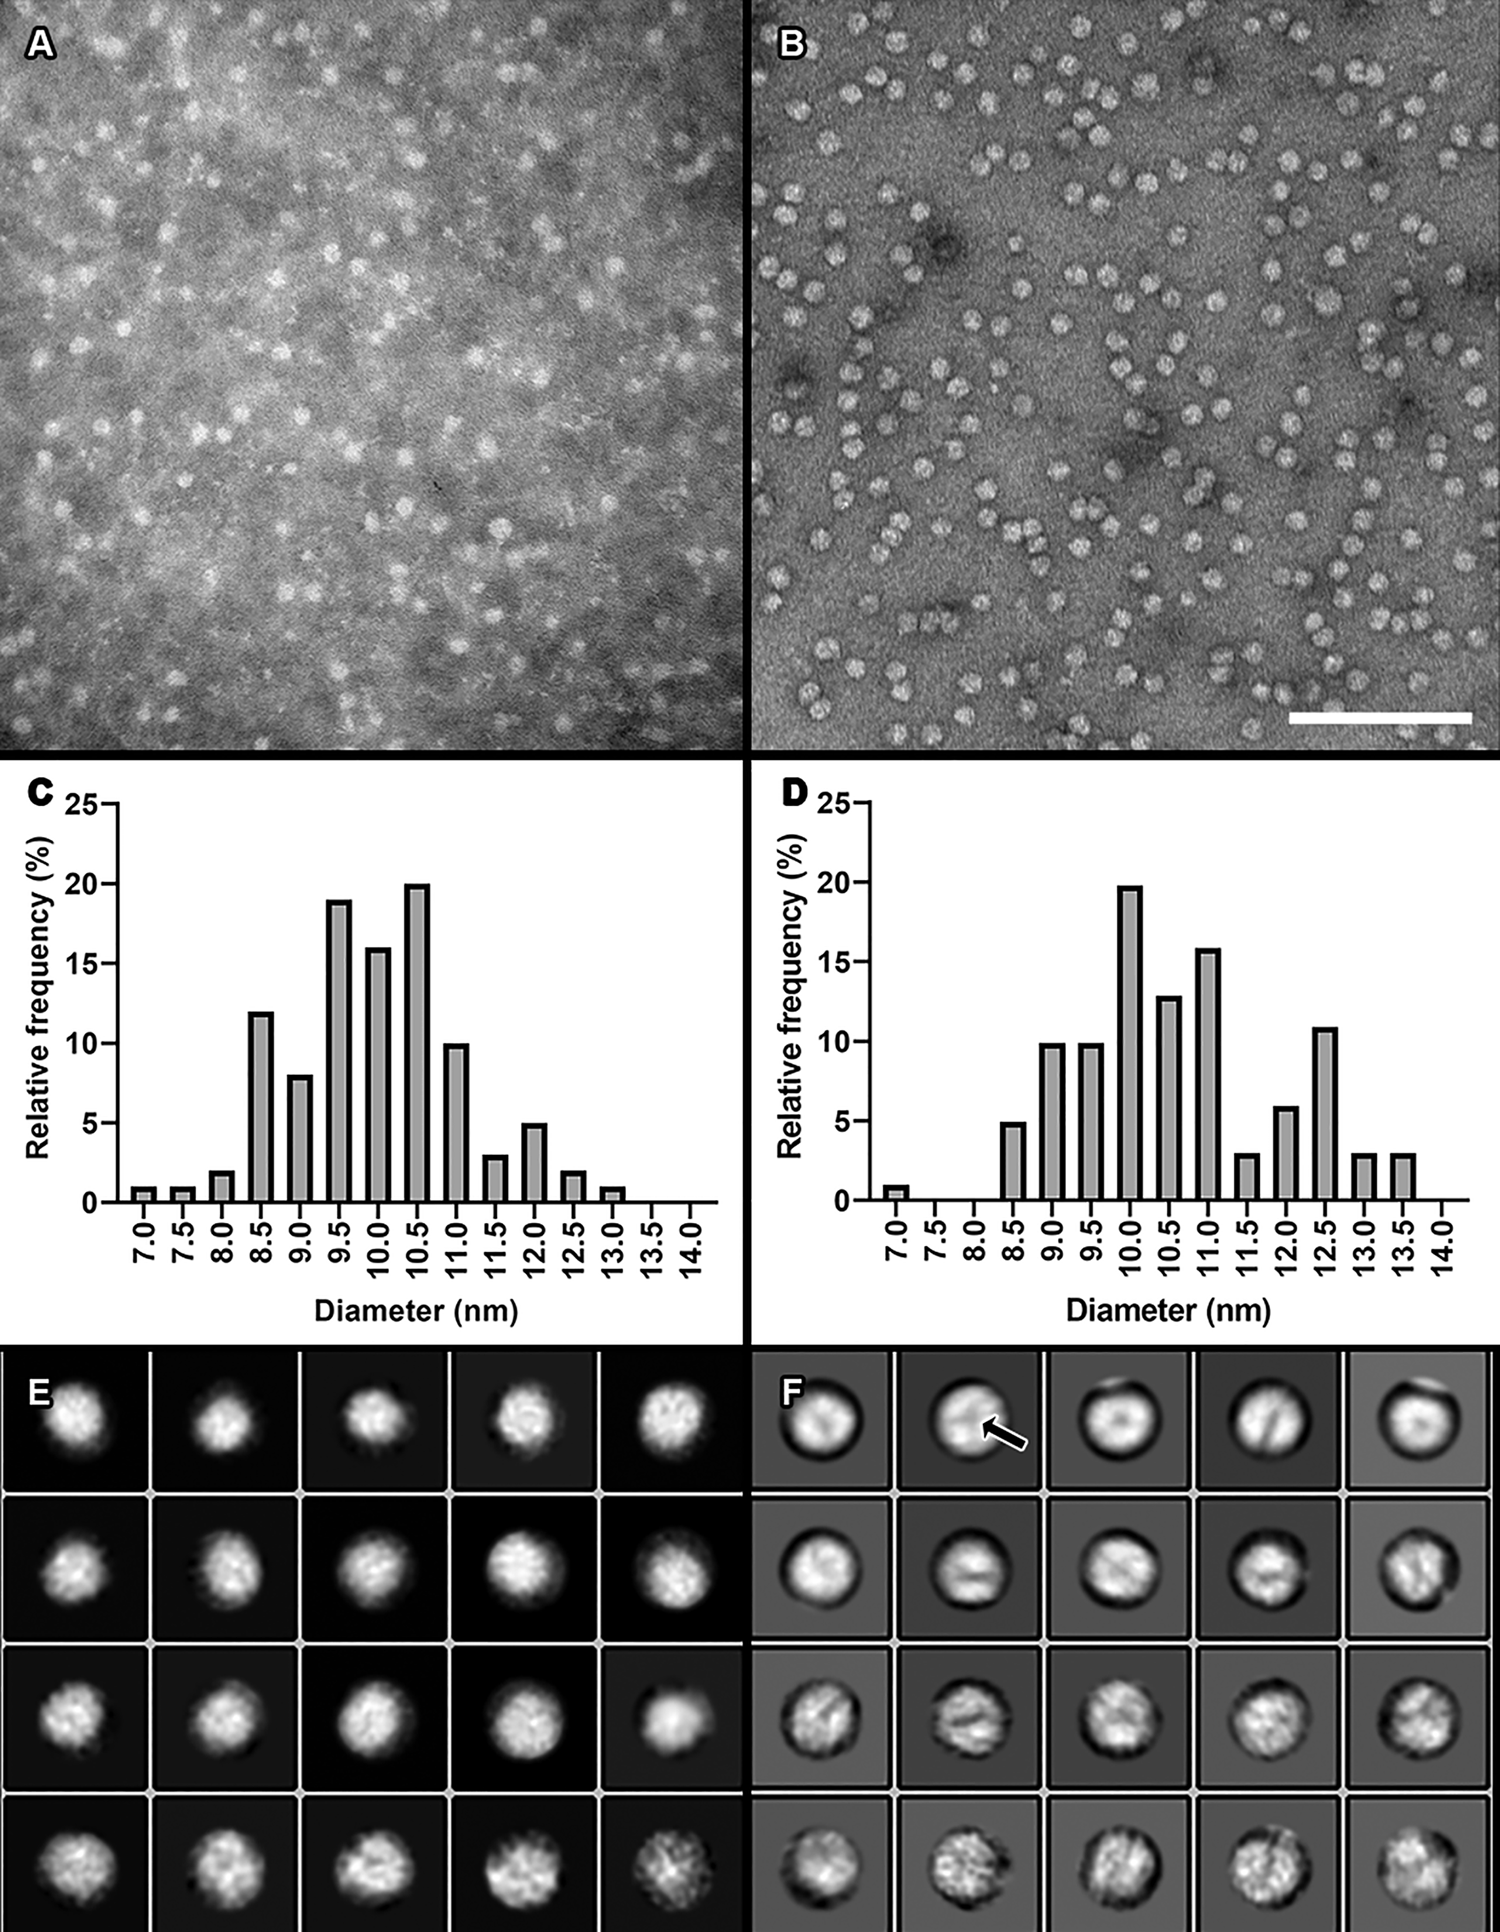
Figure 6: Comparison of our previous traditional negative staining method using PTA to our modified method using UF. A) A micrograph of isolated plasma HDL particles stained with 2% PTA. Image taken at 150,000× magnification. B) Plasma HDL particles stained with 0.7% UF using our modified negative staining procedure. Image taken at 150,000×. Scale bar = 100 nm for both 6A and 6B. C) A histogram of HDL particle distribution of ~100 particle diameters from the dataset shown in A. Mean and standard deviation = 9.98 nm +/- 1.129 nm. D) A histogram from measuring ~100 particle diameters from the dataset shown in B. Mean and standard deviation = 10.61 nm +/- 1.319 nm. E) Two-dimensional class averages generated from the dataset shown in A. F) Two-dimensional class averages generated from the dataset shown in B.
The increased surface detail and more defined particle edges from our modified staining procedure allowed us to perform single-particle analysis on HDL particles using the RELION-3.0 software package [Reference Scheres8]. Single-particle analysis is the process by which hundreds to thousands of individual particles are chosen from TEM micrographs, image averaged into two-dimensional class averages that represent unique views of the particle, and then arranged in unique orientations in space to produce a three-dimensional reconstruction of the particle. For a plasma HDL particle preparation, images of the individual chosen particles were extracted from the micrographs. Two-dimensional class averaging was then performed on the extracted particle images. The class averages generated from our modified staining procedure (Figure 6F) showed greater surface detail than those from our previous procedure (Figure 6E). Chosen class averages from the modified procedure were then arranged into a three-dimensional display, which was viewed and adjusted using the volume viewer tool in UCSF Chimera [Reference Petterson9] (Figure 7A). Further, we were able to separate areas of higher density (brighter areas in images) from those areas of lower density (darker areas in images) not seen with the PTA staining procedure (Figure 7B).

Figure 7: Three-dimensional reconstruction from single-particle analysis of a plasma HDL particle from the modified negative staining procedure using UF. A) Full-volume view of the particle. B) Reduced-volume view of the same reconstruction in A, showing areas of higher-density material after subtraction of lower-density material. Scale bar = 3 nm for both 7A and 7B.
Besides whole-particle reconstructions, we have also examined interactions between HDL particles and proteins important in the assembly and maturation of the HDL particle such as LCAT. LCAT is a plasma enzyme that interacts with Apo A on the HDL particle surface and esterifies free cholesterol (FC) to its stored form cholesteryl ester (CE). As it converts FC to EC, LCAT facilitates the movement of EC into the core of the HDL particle, driving its maturation from a discoidal particle to a spherical particle (Figure 1). We have generated two-dimensional class averages of HDL particles crosslinked to LCAT, which clearly defines the association of LCAT (arrow) to the surface of the HDL (Figure 8).

Figure 8: Two-dimensional class average of an HDL particle incubated with LCAT showing the binding of LCAT (position indicated by white arrow) to the HDL particle. Scale bar = 3 nm.
Discussion
Two-dimensional class averages of particles visualized with our modified negative stain procedure show greater detail on the HDL particle surface, making three-dimensional reconstruction more attainable than with the PTA staining method. The class averages of the LpA-I plasma particle from our modified negative stain procedure clearly show reproducible areas of density differences that we interpret as distinguishing surface proteins from surrounding lipids (arrow, Figure 6F). Further, from our 3D reconstruction, we believe the areas of higher density versus lower density represent protein and lipid, respectively (Figure 7B), based on orientation in the particle and molecular weight. The new staining method also provides more defined particle edges for more accurate particle diameter measurements. The greater edge definition can also be used for thresholding for automated measurement of particles in the future.
The improved surface detail available with our modified procedure also allowed visualization of the interactions between the HDL particles and LCAT. These images are aiding us in discovering unique binding sites between LCAT and Apo A on the HDL particle surface predicted by molecular modeling. While the additional image detail has moved our work forward, resolution from negative stain data continues to be a limiting factor due to the drying and flattening of the particles on the grid as well as stain artifact. However, we are now using our improved negative stain-generated models to help us refine more detail from cryo-EM images of similar particles lacking the negative stain drying artifacts.
Conclusion
Our new negative staining procedure using uranyl formate has allowed us to obtain more surface detail in HDL preparations and more accurate diameter measurements without significantly altering particle morphology. The additional surface detail helps to determine how proteins such as Apo A are arranged on the particle surface, as well as their interactions with other proteins such as ABCA1 and LCAT.
Acknowledgments
I gratefully acknowledge Dr. W. Gray (Jay) Jerome at Vanderbilt University Medical Center for his mentorship and assistance with these studies and this article; Dr. Elad Binshtein, Melissa Chambers, M.S., and Dr. Scott Collier at the Vanderbilt Center for Structural Biology Cryo-Electron Microscopy Facility for their assistance and training on their equipment; Dr. W. Sean Davidson, Dr. John T. Melchior, Dr. Shimpi Bedi, Scott E. Street, and Jamie Morris at the University of Cincinnati for providing the HDL preparations for our studies; Dr. Stephen G. Aller at the University of Alabama at Birmingham for his assistance and single-particle analysis software training; and Dr. Jere P. Segrest at Vanderbilt University Medical Center for providing the molecular modeling on which to base our EM studies. This work was supported by NHLBI grant P01 HL116263. TEM imaging was performed in part through use of the Vanderbilt Cell Imaging Shared Resource (supported by NIH grants CA68485, DK20593, DK58404, DK59637, and EY08126). Molecular graphics and analyses were performed with UCSF Chimera, developed by the Resource for Biocomputing, Visualization, and Informatics at the University of California, San Francisco, with support from NIH P41-GM103311.


